Cities with the Highest Percentage of Population Employed in Arts, Entertainment & Recreation in Ohio
RELATED REPORTS & OPTIONS
Arts, Entertainment & Recreation
Ohio
Compare Cities
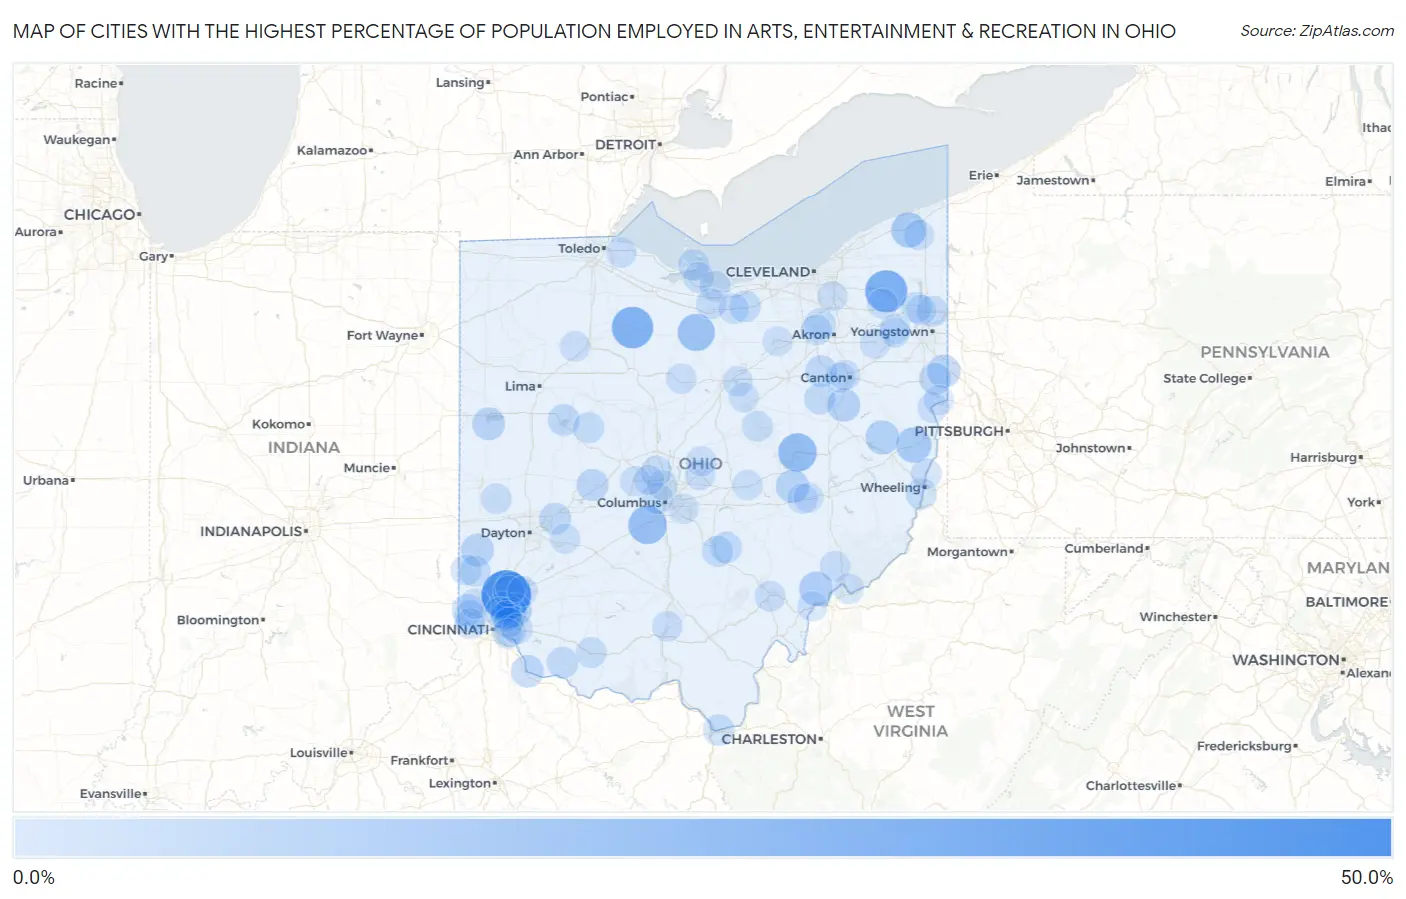
Map of Cities with the Highest Percentage of Population Employed in Arts, Entertainment & Recreation in Ohio
0.0%
50.0%
Cities with the Highest Percentage of Population Employed in Arts, Entertainment & Recreation in Ohio
| City | % Employed | vs State | vs National | |
| 1. | Olde West Chester | 42.6% | 1.7%(+40.9)#1 | 2.1%(+40.5)#61 |
| 2. | Parkman | 27.5% | 1.7%(+25.8)#2 | 2.1%(+25.4)#148 |
| 3. | Bascom | 26.2% | 1.7%(+24.6)#3 | 2.1%(+24.1)#172 |
| 4. | Hamburg | 24.3% | 1.7%(+22.6)#4 | 2.1%(+22.2)#196 |
| 5. | Canal Lewisville | 20.2% | 1.7%(+18.5)#5 | 2.1%(+18.1)#266 |
| 6. | Orient | 19.8% | 1.7%(+18.1)#6 | 2.1%(+17.7)#274 |
| 7. | Roachester | 18.1% | 1.7%(+16.5)#7 | 2.1%(+16.1)#321 |
| 8. | Holiday Lakes | 17.7% | 1.7%(+16.0)#8 | 2.1%(+15.6)#338 |
| 9. | Austinburg | 14.0% | 1.7%(+12.4)#9 | 2.1%(+12.0)#522 |
| 10. | Bloomingdale | 14.0% | 1.7%(+12.3)#10 | 2.1%(+11.9)#529 |
| 11. | Vincent | 11.9% | 1.7%(+10.2)#11 | 2.1%(+9.80)#678 |
| 12. | Scio | 11.3% | 1.7%(+9.58)#12 | 2.1%(+9.18)#741 |
| 13. | Remington | 10.9% | 1.7%(+9.21)#13 | 2.1%(+8.81)#779 |
| 14. | East Palestine | 10.2% | 1.7%(+8.51)#14 | 2.1%(+8.10)#880 |
| 15. | Adamsville | 10.1% | 1.7%(+8.45)#15 | 2.1%(+8.05)#888 |
| 16. | Zoar | 9.9% | 1.7%(+8.22)#16 | 2.1%(+7.82)#930 |
| 17. | Camden | 9.3% | 1.7%(+7.59)#17 | 2.1%(+7.19)#1,031 |
| 18. | Montezuma | 9.1% | 1.7%(+7.41)#18 | 2.1%(+7.01)#1,057 |
| 19. | Neville | 8.7% | 1.7%(+7.02)#19 | 2.1%(+6.61)#1,132 |
| 20. | Evendale | 8.5% | 1.7%(+6.85)#20 | 2.1%(+6.45)#1,179 |
| 21. | Mutual | 7.7% | 1.7%(+6.01)#21 | 2.1%(+5.61)#1,397 |
| 22. | Rogers | 7.6% | 1.7%(+5.94)#22 | 2.1%(+5.54)#1,415 |
| 23. | Holiday Valley | 7.5% | 1.7%(+5.80)#23 | 2.1%(+5.40)#1,463 |
| 24. | Chippewa Park | 7.4% | 1.7%(+5.70)#24 | 2.1%(+5.30)#1,494 |
| 25. | North Lawrence | 7.2% | 1.7%(+5.54)#25 | 2.1%(+5.13)#1,533 |
| 26. | Concorde Hills | 7.1% | 1.7%(+5.39)#26 | 2.1%(+4.98)#1,572 |
| 27. | Kipton | 7.0% | 1.7%(+5.30)#27 | 2.1%(+4.89)#1,607 |
| 28. | Hide A Way Hills | 6.9% | 1.7%(+5.24)#28 | 2.1%(+4.83)#1,618 |
| 29. | Deer Park | 6.9% | 1.7%(+5.21)#29 | 2.1%(+4.81)#1,632 |
| 30. | Wilmot | 6.8% | 1.7%(+5.12)#30 | 2.1%(+4.72)#1,651 |
| 31. | Georgetown | 6.7% | 1.7%(+5.06)#31 | 2.1%(+4.65)#1,678 |
| 32. | Grandview | 6.7% | 1.7%(+5.03)#32 | 2.1%(+4.63)#1,683 |
| 33. | Ridgewood | 6.7% | 1.7%(+5.03)#33 | 2.1%(+4.62)#1,685 |
| 34. | Burlington | 6.5% | 1.7%(+4.78)#34 | 2.1%(+4.37)#1,790 |
| 35. | Wetherington | 6.3% | 1.7%(+4.65)#35 | 2.1%(+4.24)#1,849 |
| 36. | Blue Jay | 6.2% | 1.7%(+4.49)#36 | 2.1%(+4.08)#1,913 |
| 37. | Sugar Grove | 6.1% | 1.7%(+4.47)#37 | 2.1%(+4.06)#1,922 |
| 38. | Darrtown | 6.1% | 1.7%(+4.38)#38 | 2.1%(+3.98)#1,946 |
| 39. | Lakeside | 6.0% | 1.7%(+4.34)#39 | 2.1%(+3.93)#1,973 |
| 40. | Rushsylvania | 6.0% | 1.7%(+4.30)#40 | 2.1%(+3.89)#1,988 |
| 41. | Sherwood | 5.9% | 1.7%(+4.26)#41 | 2.1%(+3.85)#2,014 |
| 42. | Marble Cliff | 5.9% | 1.7%(+4.22)#42 | 2.1%(+3.82)#2,024 |
| 43. | Vienna Center | 5.9% | 1.7%(+4.22)#43 | 2.1%(+3.82)#2,028 |
| 44. | Bellaire | 5.8% | 1.7%(+4.17)#44 | 2.1%(+3.76)#2,063 |
| 45. | Montrose Ghent | 5.7% | 1.7%(+4.06)#45 | 2.1%(+3.65)#2,126 |
| 46. | Morgandale | 5.7% | 1.7%(+4.04)#46 | 2.1%(+3.63)#2,134 |
| 47. | Pitsburg | 5.6% | 1.7%(+3.91)#47 | 2.1%(+3.51)#2,215 |
| 48. | Powell | 5.5% | 1.7%(+3.86)#48 | 2.1%(+3.45)#2,252 |
| 49. | Winchester | 5.5% | 1.7%(+3.85)#49 | 2.1%(+3.44)#2,256 |
| 50. | Four Bridges | 5.5% | 1.7%(+3.84)#50 | 2.1%(+3.44)#2,257 |
| 51. | Oxford | 5.4% | 1.7%(+3.73)#51 | 2.1%(+3.33)#2,318 |
| 52. | Gann Brinkhaven | 5.3% | 1.7%(+3.65)#52 | 2.1%(+3.25)#2,368 |
| 53. | Pigeon Creek | 5.3% | 1.7%(+3.64)#53 | 2.1%(+3.23)#2,373 |
| 54. | Addyston | 5.3% | 1.7%(+3.60)#54 | 2.1%(+3.19)#2,392 |
| 55. | North Lima | 5.3% | 1.7%(+3.58)#55 | 2.1%(+3.18)#2,401 |
| 56. | Athens | 5.2% | 1.7%(+3.57)#56 | 2.1%(+3.16)#2,423 |
| 57. | Huron | 5.2% | 1.7%(+3.56)#57 | 2.1%(+3.16)#2,425 |
| 58. | Milan | 5.2% | 1.7%(+3.55)#58 | 2.1%(+3.14)#2,435 |
| 59. | Sandusky | 5.2% | 1.7%(+3.49)#59 | 2.1%(+3.09)#2,470 |
| 60. | Lowell | 5.1% | 1.7%(+3.46)#60 | 2.1%(+3.06)#2,490 |
| 61. | Yorkville | 5.1% | 1.7%(+3.41)#61 | 2.1%(+3.01)#2,533 |
| 62. | Arlington Heights | 5.0% | 1.7%(+3.35)#62 | 2.1%(+2.95)#2,570 |
| 63. | Wellsville | 5.0% | 1.7%(+3.28)#63 | 2.1%(+2.87)#2,637 |
| 64. | Ai | 4.9% | 1.7%(+3.26)#64 | 2.1%(+2.85)#2,659 |
| 65. | Hanover | 4.9% | 1.7%(+3.21)#65 | 2.1%(+2.81)#2,682 |
| 66. | Garrettsville | 4.9% | 1.7%(+3.21)#66 | 2.1%(+2.80)#2,686 |
| 67. | North Robinson | 4.9% | 1.7%(+3.20)#67 | 2.1%(+2.80)#2,697 |
| 68. | Mifflin | 4.9% | 1.7%(+3.20)#68 | 2.1%(+2.80)#2,701 |
| 69. | Plain City | 4.8% | 1.7%(+3.13)#69 | 2.1%(+2.73)#2,753 |
| 70. | Waverly | 4.8% | 1.7%(+3.12)#70 | 2.1%(+2.71)#2,758 |
| 71. | Curtice | 4.8% | 1.7%(+3.11)#71 | 2.1%(+2.71)#2,760 |
| 72. | Silverton | 4.8% | 1.7%(+3.10)#72 | 2.1%(+2.70)#2,767 |
| 73. | Johnstown | 4.7% | 1.7%(+3.05)#73 | 2.1%(+2.64)#2,817 |
| 74. | Wakeman | 4.7% | 1.7%(+3.03)#74 | 2.1%(+2.63)#2,825 |
| 75. | Benton Ridge | 4.6% | 1.7%(+2.96)#75 | 2.1%(+2.56)#2,875 |
| 76. | Kings Mills | 4.6% | 1.7%(+2.96)#76 | 2.1%(+2.55)#2,879 |
| 77. | Atwater | 4.6% | 1.7%(+2.89)#77 | 2.1%(+2.49)#2,947 |
| 78. | Reno | 4.6% | 1.7%(+2.88)#78 | 2.1%(+2.48)#2,959 |
| 79. | Jefferson | 4.6% | 1.7%(+2.87)#79 | 2.1%(+2.47)#2,966 |
| 80. | Riverlea | 4.5% | 1.7%(+2.87)#80 | 2.1%(+2.46)#2,976 |
| 81. | Meyers Lake | 4.5% | 1.7%(+2.84)#81 | 2.1%(+2.44)#3,010 |
| 82. | New Baltimore | 4.5% | 1.7%(+2.83)#82 | 2.1%(+2.43)#3,023 |
| 83. | Dublin | 4.5% | 1.7%(+2.82)#83 | 2.1%(+2.42)#3,034 |
| 84. | Hartford Croton | 4.5% | 1.7%(+2.79)#84 | 2.1%(+2.39)#3,071 |
| 85. | Howland Center | 4.5% | 1.7%(+2.79)#85 | 2.1%(+2.38)#3,073 |
| 86. | Norwich | 4.4% | 1.7%(+2.77)#86 | 2.1%(+2.36)#3,106 |
| 87. | Mount Carmel | 4.4% | 1.7%(+2.74)#87 | 2.1%(+2.34)#3,131 |
| 88. | Mariemont | 4.3% | 1.7%(+2.64)#88 | 2.1%(+2.24)#3,240 |
| 89. | Perry Heights | 4.3% | 1.7%(+2.63)#89 | 2.1%(+2.23)#3,259 |
| 90. | Wilberforce | 4.3% | 1.7%(+2.62)#90 | 2.1%(+2.22)#3,270 |
| 91. | Salem Heights | 4.3% | 1.7%(+2.60)#91 | 2.1%(+2.19)#3,303 |
| 92. | Lodi | 4.3% | 1.7%(+2.59)#92 | 2.1%(+2.19)#3,312 |
| 93. | Craig Beach | 4.3% | 1.7%(+2.58)#93 | 2.1%(+2.18)#3,320 |
| 94. | Brice | 4.3% | 1.7%(+2.58)#94 | 2.1%(+2.17)#3,327 |
| 95. | Little Hocking | 4.2% | 1.7%(+2.56)#95 | 2.1%(+2.15)#3,344 |
| 96. | Northfield | 4.2% | 1.7%(+2.54)#96 | 2.1%(+2.14)#3,353 |
| 97. | New Concord | 4.2% | 1.7%(+2.48)#97 | 2.1%(+2.08)#3,427 |
| 98. | La Croft | 4.1% | 1.7%(+2.46)#98 | 2.1%(+2.05)#3,464 |
| 99. | Lake Milton | 4.1% | 1.7%(+2.42)#99 | 2.1%(+2.02)#3,522 |
| 100. | Perrysville | 4.1% | 1.7%(+2.42)#100 | 2.1%(+2.02)#3,526 |
Common Questions
What are the Top 10 Cities with the Highest Percentage of Population Employed in Arts, Entertainment & Recreation in Ohio?
Top 10 Cities with the Highest Percentage of Population Employed in Arts, Entertainment & Recreation in Ohio are:
#1
42.6%
#2
27.5%
#3
26.2%
#4
20.2%
#5
19.8%
#6
17.7%
#7
14.0%
#8
14.0%
#9
11.9%
#10
11.3%
What city has the Highest Percentage of Population Employed in Arts, Entertainment & Recreation in Ohio?
Olde West Chester has the Highest Percentage of Population Employed in Arts, Entertainment & Recreation in Ohio with 42.6%.
What is the Percentage of Population Employed in Arts, Entertainment & Recreation in the State of Ohio?
Percentage of Population Employed in Arts, Entertainment & Recreation in Ohio is 1.7%.
What is the Percentage of Population Employed in Arts, Entertainment & Recreation in the United States?
Percentage of Population Employed in Arts, Entertainment & Recreation in the United States is 2.1%.