Zip Codes with the Highest Percentage of Unpaid Family Workers in Rome, NY
RELATED REPORTS & OPTIONS
Select to Compare
Select to Compare
Compare Zip Codes
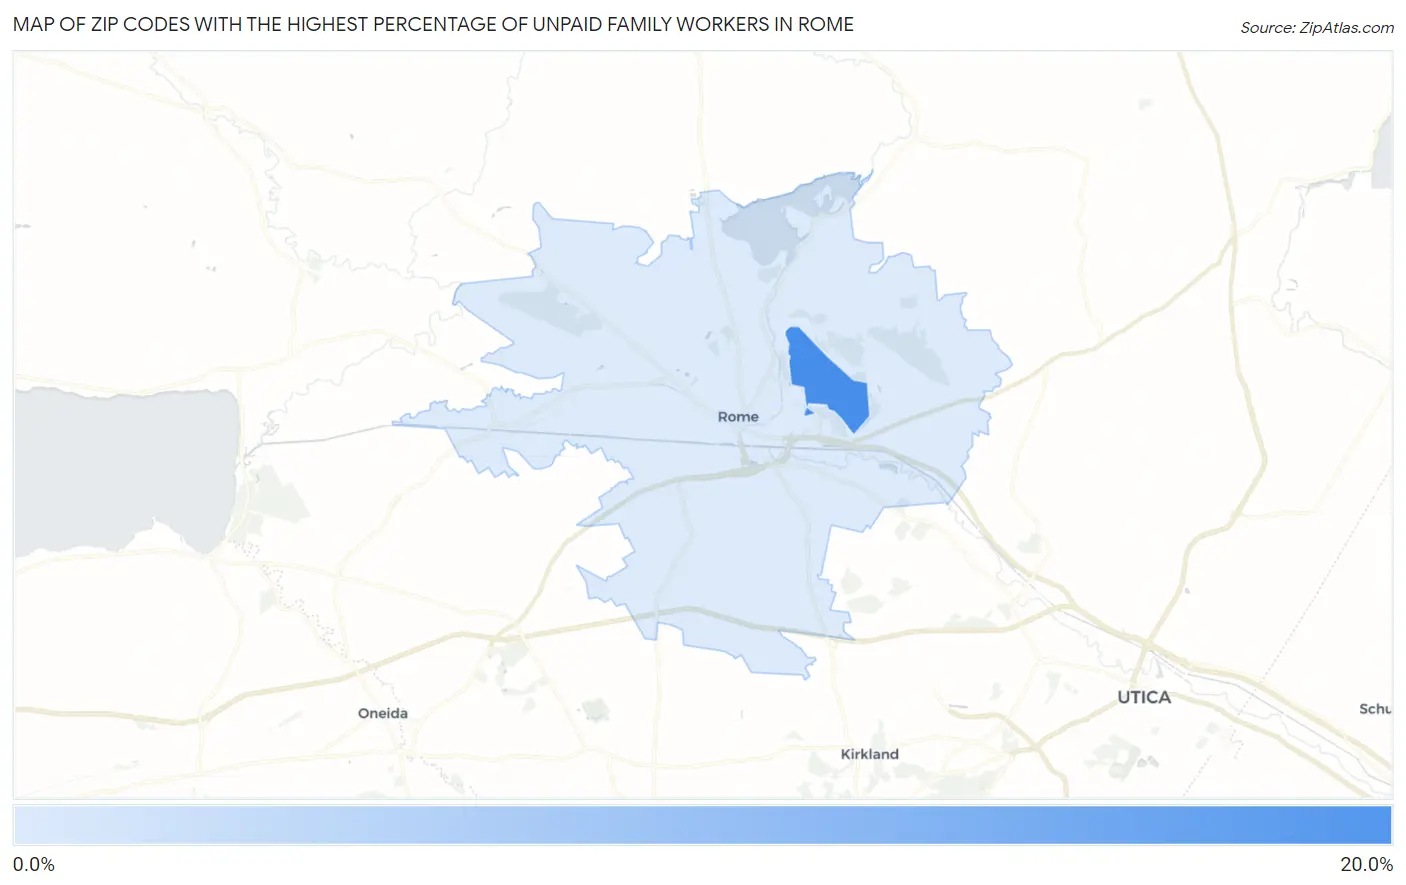
Map of Zip Codes with the Highest Percentage of Unpaid Family Workers in Rome
0.0%
15.0%
Zip Codes with the Highest Percentage of Unpaid Family Workers in Rome, NY
| Zip Code | % Unpaid Family Workers | vs State | vs National | |
| 1. | 13441 | 14.5% | 0.16%(+14.4)#2 | 0.19%(+14.3)#50 |
1
Common Questions
What are the Top Zip Codes with the Highest Percentage of Unpaid Family Workers in Rome, NY?
Top Zip Codes with the Highest Percentage of Unpaid Family Workers in Rome, NY are:
What zip code has the Highest Percentage of Unpaid Family Workers in Rome, NY?
13441 has the Highest Percentage of Unpaid Family Workers in Rome, NY with 14.5%.
What is the Percentage of Unpaid Family Workers in Rome, NY?
Percentage of Unpaid Family Workers in Rome is 0.20%.
What is the Percentage of Unpaid Family Workers in New York?
Percentage of Unpaid Family Workers in New York is 0.16%.
What is the Percentage of Unpaid Family Workers in the United States?
Percentage of Unpaid Family Workers in the United States is 0.19%.