Zip Codes with the Largest Chinese Community in Ithaca, NY
On this page
RELATED REPORTS & OPTIONS
Select to Compare
Population
Highest PopulationHighest Population DensityLowest Population DensityMale / Female RatioFemale / Male RatioOldest PopulationOldest Population | MaleOldest Population | FemaleYoungest PopulationYoungest Population | MaleYoungest Population | Female
Female Fertility
Highest Birth Rate | All WomenHighest Birth Rate | Women 35+Highest Birth Rate | Public IncomeLowest Birth Rate | All WomenLowest Birth Rate | Women 35+Lowest Birth Rate | Public Income
Female Fertility (Unmarried)
Highest Illegitimacy | All WomenHighest Illegitimacy | Women 35+Lowest Illegitimacy | All WomenLowest Illegitimacy | Women 35+
Race (Community Size)
Race (Percentage)
Ancestry (Community Size)
BhutaneseBolivianCentral AmericanColombianCubanDominicanEastern EuropeanEcuadorianEnglishFrench CanadianGermanGuatemalanHonduranIndian (Asian)IrishItalianKoreanPakistaniPeruvianPuerto RicanRussianSouth AmericanSubsaharan AfricanThaiVietnameseWelsh
Ancestry (Percentage)
BhutaneseBolivianCentral AmericanColombianCubanDominicanEastern EuropeanEcuadorianEnglishFrench CanadianGermanGuatemalanHonduranIndian (Asian)IrishItalianKoreanPakistaniPeruvianPuerto RicanRussianSouth AmericanSubsaharan AfricanThaiVietnameseWelsh
Immigrant Origin (Total)
AfricaAsiaBangladeshCaribbeanChinaColombiaDominican RepublicEastern AfricaEastern AsiaEuropeHong KongIndiaItalyJapanKoreaLatin AmericaNorthern EuropePeruPortugalSouth AmericaSouth Central AsiaSouthern EuropeWestern Africa
Immigrant Origin (Percentage)
AfricaAsiaBangladeshCaribbeanChinaColombiaDominican RepublicEastern AfricaEastern AsiaEuropeHong KongIndiaItalyJapanKoreaLatin AmericaNorthern EuropePeruPortugalSouth AmericaSouth Central AsiaSouthern EuropeWestern Africa
Income
Highest Per Capita IncomeHighest Earnings | MaleHighest Earnings | FemaleHighest Wage/Income Gap ($)Highest Wage/Income Gap (%)Lowest Per Capita IncomeLowest Earnings | MaleLowest Earnings | FemaleLowest Wage/Income Gap ($)Lowest Wage/Income Gap (%)
Unemployment
Highest UnemploymentHighest Unemployment | FemaleHighest Unemployment | Youth < 25Lowest UnemploymentLowest Unemployment | FemaleLowest Unemployment | Youth < 25
Employment Occupations
Arts, Media & EntertainmentBusiness & FinancialCommunity & Social Service Computer, Engineering & ScienceEducation Instruction & LibraryFarming, Fishing & ForestryFood Preparation & ServingHealthcare SupportInstallation, Maintenance & RepairLegal Services & SupportLife, Physical & Social ScienceManagementMaterial MovingOffice & AdministrationPersonal Care and ServiceProductionSales & RelatedTransportation
Employment Industries
Accommodation & Food ServicesAdministrative & Support ServicesArts, Entertainment & RecreationEducational ServicesHealth Care & Social AssistanceInformation & TechnologyManufacturingProfessional & Scientific ServicesRetail Trade
Employer Class
Private Company EmployeesSelf-Employed / Not IncorporatedNot-for-profit OrganizationsLocal Government EmployeesState Government EmployeesFederal Government Employees
Commute Time
Longest CommuteLongest Commute | MaleLongest Commute | FemaleShortest CommuteShortest Commute | MaleShortest Commute | Female
Commute Means
School Enrollment
Education by Degree Field
Select to Compare
States
AlabamaAlaskaArizonaArkansasCaliforniaColoradoConnecticutDelawareDistrict Of ColumbiaFloridaGeorgiaHawaiiIdahoIllinoisIndianaIowaKansasKentuckyLouisianaMaineMarylandMassachusettsMichiganMinnesotaMississippiMissouriMontanaNebraskaNevadaNew HampshireNew JerseyNew MexicoNew YorkNorth CarolinaNorth DakotaOhioOklahomaOregonPennsylvaniaPuerto RicoRhode IslandSouth CarolinaSouth DakotaTennesseeTexasUtahVermontVirginiaWashingtonWest VirginiaWisconsinWyoming
New York Cities
Compare Zip Codes
Comparison Subject
Compare StatesCompare CitiesCompare Zip Codes
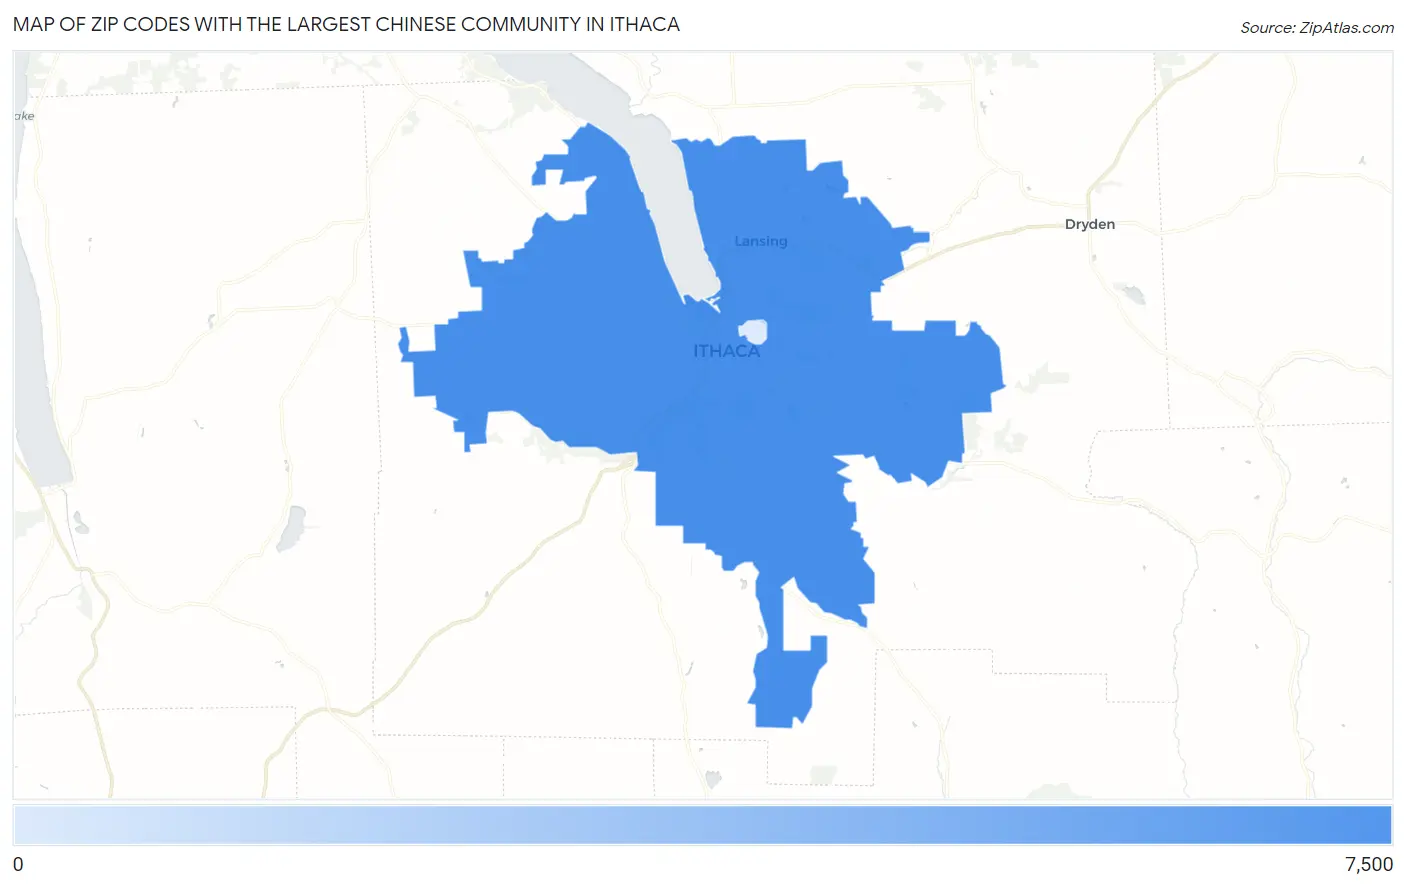
Map of Zip Codes with the Largest Chinese Community in Ithaca
0
0
Zip Codes with the Largest Chinese Community in Ithaca, NY
| Zip Code | Chinese | vs State | vs National |
1