Zip Codes with the Highest Percentage of Chinese Population in Floral Park, NY
On this page
RELATED REPORTS & OPTIONS
Select to Compare
Population
Highest PopulationHighest Population DensityLowest Population DensityMale / Female RatioFemale / Male RatioOldest PopulationOldest Population | MaleOldest Population | FemaleYoungest PopulationYoungest Population | MaleYoungest Population | Female
Families and Households
Race (Community Size)
Race (Percentage)
Ancestry (Community Size)
AmericanArabAustrianBurmeseCroatianCubanEastern EuropeanEnglishEuropeanFrenchGermanGreekHungarianIndian (Asian)IraqiIrishIsraeliItalianLithuanianPeruvianPolishRomanianRussianSouth AmericanSwissThaiUkrainian
Ancestry (Percentage)
AmericanArabAustrianBurmeseCroatianCubanEastern EuropeanEnglishEuropeanFrenchGermanGreekHungarianIndian (Asian)IraqiIrishIsraeliItalianLithuanianPeruvianPolishRomanianRussianSouth AmericanSwissThaiUkrainian
Immigrant Origin (Total)
AsiaAustriaCaribbeanCubaEastern AsiaEastern EuropeEuropeGermanyHungaryIndiaIranIsraelKoreaLatin AmericaPakistanPeruPolandRomaniaSouth AmericaSouth Central AsiaSouth Eastern AsiaWestern AsiaWestern Europe
Immigrant Origin (Percentage)
AsiaAustriaCaribbeanCubaEastern AsiaEastern EuropeEuropeGermanyHungaryIndiaIranIsraelKoreaLatin AmericaPakistanPeruPolandRomaniaSouth AmericaSouth Central AsiaSouth Eastern AsiaWestern AsiaWestern Europe
Income
Highest Per Capita IncomeHighest Earnings | MaleHighest Earnings | FemaleHighest Wage/Income Gap ($)Highest Wage/Income Gap (%)Highest Inequality / Gini IndexLowest Per Capita IncomeLowest Earnings | MaleLowest Earnings | FemaleLowest Wage/Income Gap ($)Lowest Wage/Income Gap (%)Lowest Inequality / Gini Index
Income (Families)
Highest Family IncomeLowest Family IncomeFamily Income | $0-10kFamily Income | $100k+Family Income | $200k+
Income (Households)
Highest Household IncomeLowest Household IncomeHousehold Income | $0-10kHousehold Income | $200k+Household Income | $100k+
Poverty
Highest PovertyHighest Poverty | FemaleHighest Poverty | Seniors 65+Highest Poverty | Seniors 75+ Lowest PovertyLowest Poverty | FemaleLowest Poverty | Seniors 65+Lowest Poverty | Seniors 75+
Poverty (Families)
Highest Family PovertyHighest Poverty | Single FemaleLowest Family PovertyLowest Poverty | Single Female
Employment Occupations
Arts, Media & EntertainmentBusiness & FinancialCommunity & Social Service Computer & MathematicsComputer, Engineering & ScienceEducation Instruction & LibraryHealth Diagnosing & TreatingHealth TechnologistsLegal Services & SupportLife, Physical & Social ScienceManagementOffice & AdministrationSales & Related
Employment Industries
Administrative & Support ServicesArts, Entertainment & RecreationEducational ServicesFinance & InsuranceHealth Care & Social AssistanceProfessional & Scientific ServicesPublic AdministrationReal Estate, Rental & LeasingRetail TradeTransportation & WarehousingUtilitiesWholesale Trade
Employer Class
Private Company EmployeesSelf-Employed / IncorporatedSelf-Employed / Not IncorporatedNot-for-profit OrganizationsLocal Government EmployeesState Government Employees
Commute Time
Longest CommuteLongest Commute | MaleLongest Commute | FemaleShortest CommuteShortest Commute | MaleShortest Commute | Female
Commute Means
School Enrollment
Education by Degree Field
Computers and MathematicsBio, Nature & AgriculturalPhysical and Health SciencesPsychologySocial SciencesEngineeringMultidisciplinary StudiesScience and EngineeringBusinessEducationLiterature and LanguagesLiberal Arts and HistoryVisual and Performing ArtsArts and Humanities
Occupancy
Finances
Highest Median Housing CostsHighest Property PricesHighest Owner Housing CostsHighest Renter Housing CostsHighest Housing Costs / IncomeLowest Median Housing CostsLowest Property PricesLowest Owner Housing CostsLowest Renter Housing CostsLowest Housing Costs / Income
Physical Characteristics
Select to Compare
States
AlabamaAlaskaArizonaArkansasCaliforniaColoradoConnecticutDelawareDistrict Of ColumbiaFloridaGeorgiaHawaiiIdahoIllinoisIndianaIowaKansasKentuckyLouisianaMaineMarylandMassachusettsMichiganMinnesotaMississippiMissouriMontanaNebraskaNevadaNew HampshireNew JerseyNew MexicoNew YorkNorth CarolinaNorth DakotaOhioOklahomaOregonPennsylvaniaPuerto RicoRhode IslandSouth CarolinaSouth DakotaTennesseeTexasUtahVermontVirginiaWashingtonWest VirginiaWisconsinWyoming
New York Cities
Compare Zip Codes
Comparison Subject
Compare StatesCompare CitiesCompare Zip Codes
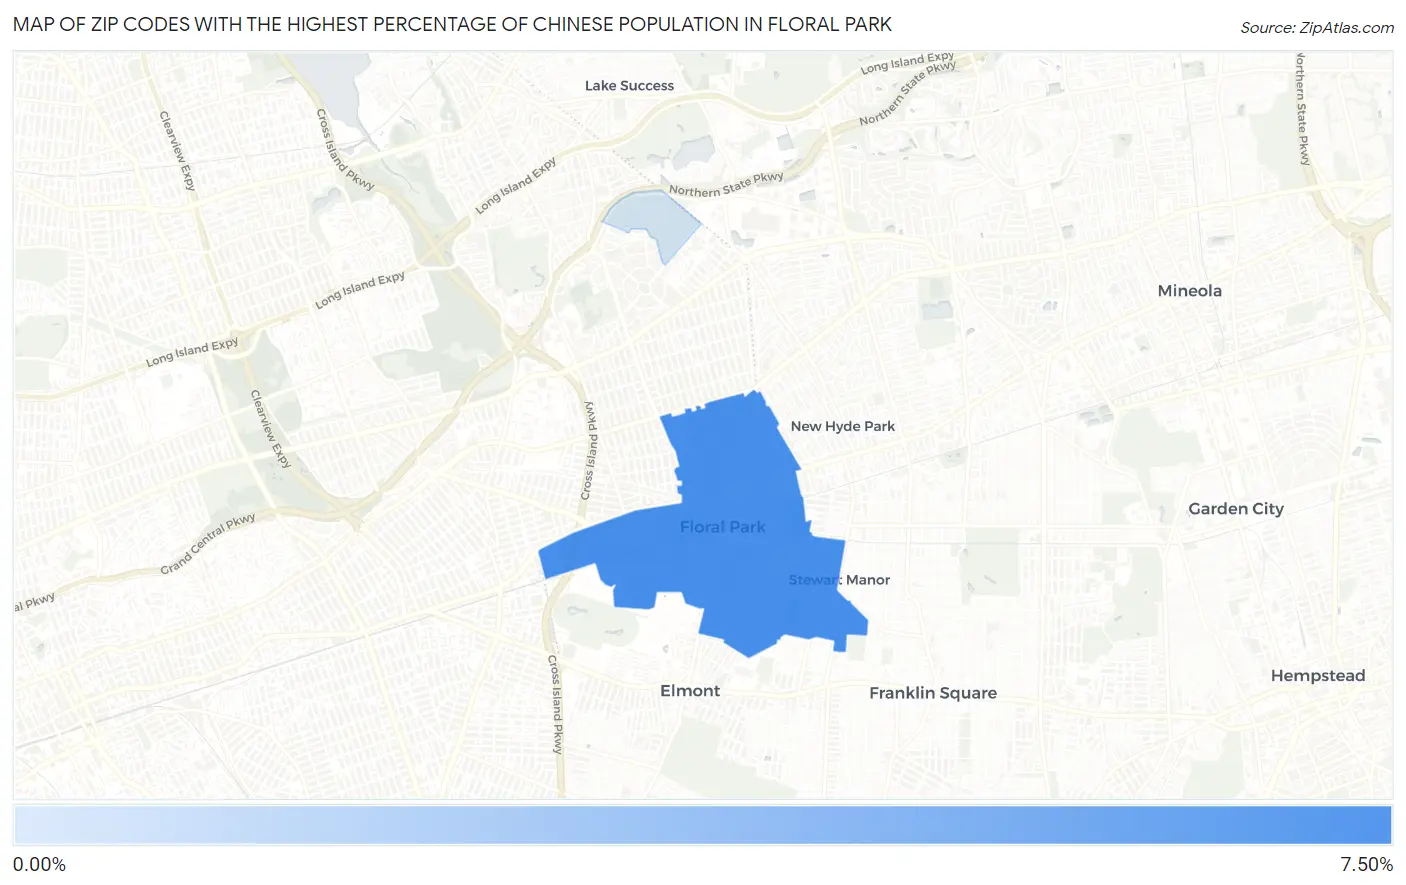
Map of Zip Codes with the Highest Percentage of Chinese Population in Floral Park
0.00%
0.00%
Zip Codes with the Highest Percentage of Chinese Population in Floral Park, NY
| Zip Code | Chinese | vs State | vs National |
1
Common Questions
What are the Top Zip Codes with the Highest Percentage of Chinese Population in Floral Park, NY?
Top Zip Codes with the Highest Percentage of Chinese Population in Floral Park, NY are:
What zip code has the Highest Percentage of Chinese Population in Floral Park, NY?
11001 has the Highest Percentage of Chinese Population in Floral Park, NY with 0.00%.