Cities with the Highest Percentage of Hawaiian / Pacific Population in Nevada
RELATED REPORTS & OPTIONS
Hawaiian / Pacific
Nevada
Compare Cities
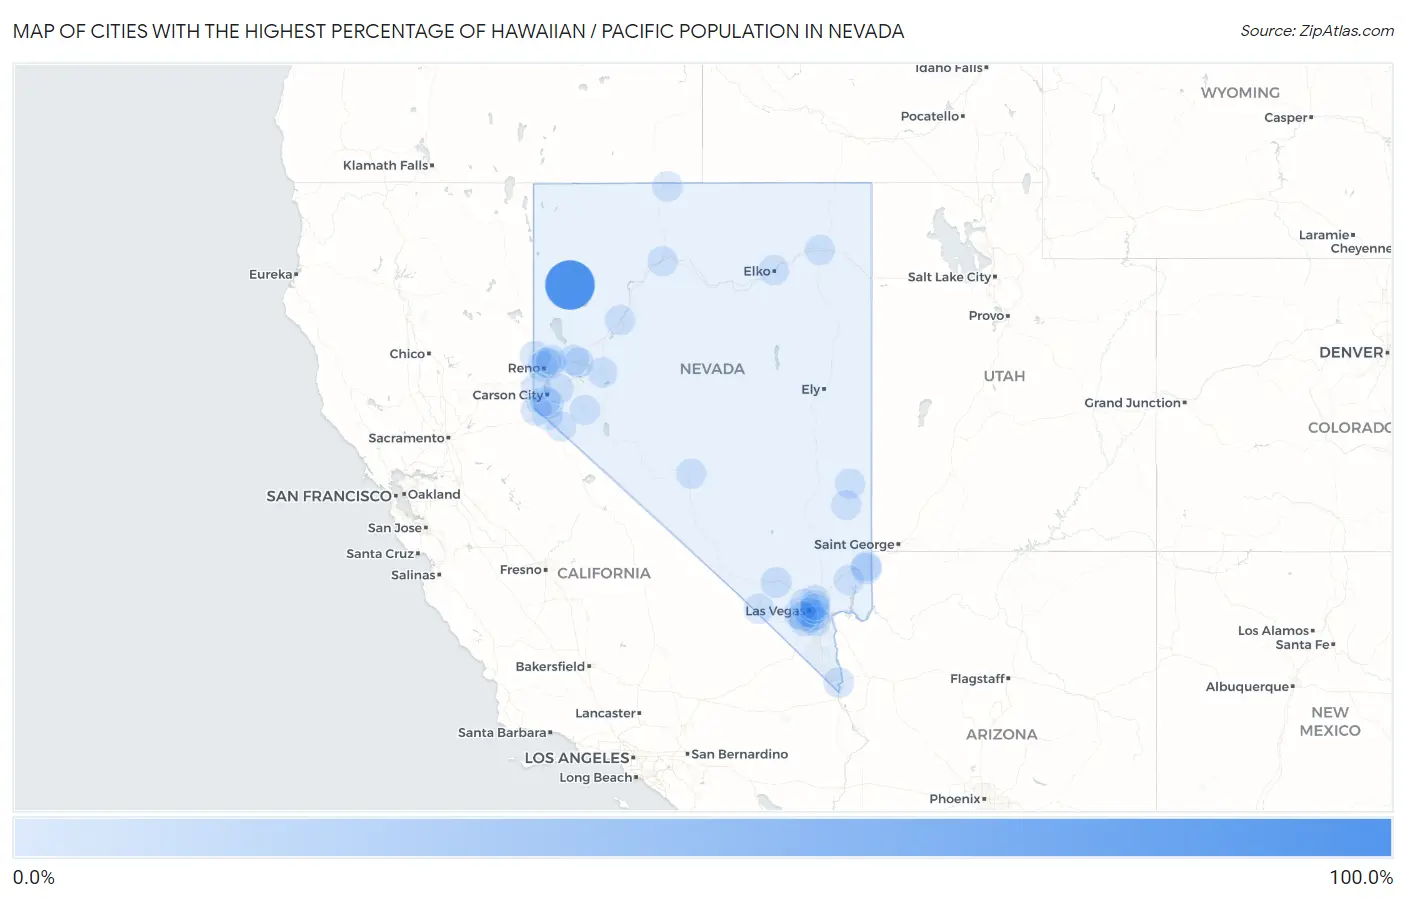
Map of Cities with the Highest Percentage of Hawaiian / Pacific Population in Nevada
0.0%
100.0%
Cities with the Highest Percentage of Hawaiian / Pacific Population in Nevada
| City | Hawaiian / Pacific | vs State | vs National | |
| 1. | Gerlach | 100.0% | 0.70%(+99.3)#1 | 0.19%(+99.8)#1 |
| 2. | Bunkerville | 3.3% | 0.70%(+2.57)#2 | 0.19%(+3.09)#283 |
| 3. | Indian Springs | 3.1% | 0.70%(+2.40)#3 | 0.19%(+2.92)#299 |
| 4. | Stateline | 3.1% | 0.70%(+2.39)#4 | 0.19%(+2.90)#304 |
| 5. | Wadsworth | 2.1% | 0.70%(+1.39)#5 | 0.19%(+1.91)#413 |
| 6. | Cold Springs | 1.4% | 0.70%(+0.728)#6 | 0.19%(+1.24)#570 |
| 7. | Laughlin | 1.1% | 0.70%(+0.432)#7 | 0.19%(+0.948)#680 |
| 8. | Enterprise | 1.1% | 0.70%(+0.347)#8 | 0.19%(+0.863)#714 |
| 9. | Summerlin South | 0.94% | 0.70%(+0.234)#9 | 0.19%(+0.750)#778 |
| 10. | Whitney | 0.91% | 0.70%(+0.205)#10 | 0.19%(+0.721)#800 |
| 11. | Paradise | 0.89% | 0.70%(+0.183)#11 | 0.19%(+0.699)#817 |
| 12. | Reno | 0.83% | 0.70%(+0.128)#12 | 0.19%(+0.644)#856 |
| 13. | North Las Vegas | 0.82% | 0.70%(+0.116)#13 | 0.19%(+0.632)#870 |
| 14. | Las Vegas | 0.81% | 0.70%(+0.108)#14 | 0.19%(+0.625)#878 |
| 15. | Fort Mcdermitt | 0.79% | 0.70%(+0.083)#15 | 0.19%(+0.599)#903 |
| 16. | Sparks | 0.78% | 0.70%(+0.074)#16 | 0.19%(+0.590)#917 |
| 17. | Spanish Springs | 0.74% | 0.70%(+0.032)#17 | 0.19%(+0.548)#951 |
| 18. | Henderson | 0.74% | 0.70%(+0.032)#18 | 0.19%(+0.548)#953 |
| 19. | Winchester | 0.71% | 0.70%(+0.001)#19 | 0.19%(+0.517)#990 |
| 20. | Spring Valley | 0.69% | 0.70%(-0.015)#20 | 0.19%(+0.501)#1,013 |
| 21. | Mesquite | 0.61% | 0.70%(-0.095)#21 | 0.19%(+0.421)#1,104 |
| 22. | Moapa Valley | 0.60% | 0.70%(-0.103)#22 | 0.19%(+0.413)#1,116 |
| 23. | Sunrise Manor | 0.52% | 0.70%(-0.188)#23 | 0.19%(+0.329)#1,224 |
| 24. | Pahrump | 0.51% | 0.70%(-0.193)#24 | 0.19%(+0.323)#1,231 |
| 25. | Winnemucca | 0.42% | 0.70%(-0.286)#25 | 0.19%(+0.230)#1,394 |
| 26. | Sun Valley | 0.37% | 0.70%(-0.336)#26 | 0.19%(+0.180)#1,525 |
| 27. | Fallon | 0.34% | 0.70%(-0.369)#27 | 0.19%(+0.147)#1,629 |
| 28. | Gardnerville Ranchos | 0.33% | 0.70%(-0.373)#28 | 0.19%(+0.143)#1,635 |
| 29. | Pioche | 0.27% | 0.70%(-0.435)#29 | 0.19%(+0.081)#1,851 |
| 30. | Johnson Lane | 0.17% | 0.70%(-0.536)#30 | 0.19%(-0.019)#2,283 |
| 31. | Fernley | 0.16% | 0.70%(-0.540)#31 | 0.19%(-0.024)#2,317 |
| 32. | Elko | 0.14% | 0.70%(-0.563)#32 | 0.19%(-0.047)#2,455 |
| 33. | Incline Village | 0.12% | 0.70%(-0.585)#33 | 0.19%(-0.069)#2,591 |
| 34. | Caliente | 0.12% | 0.70%(-0.586)#34 | 0.19%(-0.070)#2,597 |
| 35. | Topaz Ranch Estates | 0.12% | 0.70%(-0.587)#35 | 0.19%(-0.071)#2,611 |
| 36. | Indian Hills | 0.12% | 0.70%(-0.587)#36 | 0.19%(-0.071)#2,616 |
| 37. | Tonopah | 0.11% | 0.70%(-0.592)#37 | 0.19%(-0.076)#2,647 |
| 38. | Wells | 0.095% | 0.70%(-0.610)#38 | 0.19%(-0.094)#2,784 |
| 39. | Lovelock | 0.060% | 0.70%(-0.645)#39 | 0.19%(-0.129)#3,104 |
| 40. | Dayton | 0.058% | 0.70%(-0.646)#40 | 0.19%(-0.130)#3,117 |
| 41. | Yerington | 0.032% | 0.70%(-0.673)#41 | 0.19%(-0.157)#3,416 |
| 42. | Carson | 0.024% | 0.70%(-0.681)#42 | 0.19%(-0.165)#3,536 |
| 43. | Nellis Afb | 0.023% | 0.70%(-0.681)#43 | 0.19%(-0.165)#3,544 |
1
2Common Questions
What are the Top 10 Cities with the Highest Percentage of Hawaiian / Pacific Population in Nevada?
Top 10 Cities with the Highest Percentage of Hawaiian / Pacific Population in Nevada are:
#1
100.0%
#2
3.3%
#3
3.1%
#4
3.1%
#5
2.1%
#6
1.4%
#7
1.1%
#8
1.1%
#9
0.94%
#10
0.91%
What city has the Highest Percentage of Hawaiian / Pacific Population in Nevada?
Gerlach has the Highest Percentage of Hawaiian / Pacific Population in Nevada with 100.0%.
What is the Percentage of Hawaiian / Pacific Population in the State of Nevada?
Percentage of Hawaiian / Pacific Population in Nevada is 0.70%.
What is the Percentage of Hawaiian / Pacific Population in the United States?
Percentage of Hawaiian / Pacific Population in the United States is 0.19%.