Cities with the Largest Hawaiian / Pacific Community in New Jersey
RELATED REPORTS & OPTIONS
Hawaiian / Pacific
New Jersey
Compare Cities
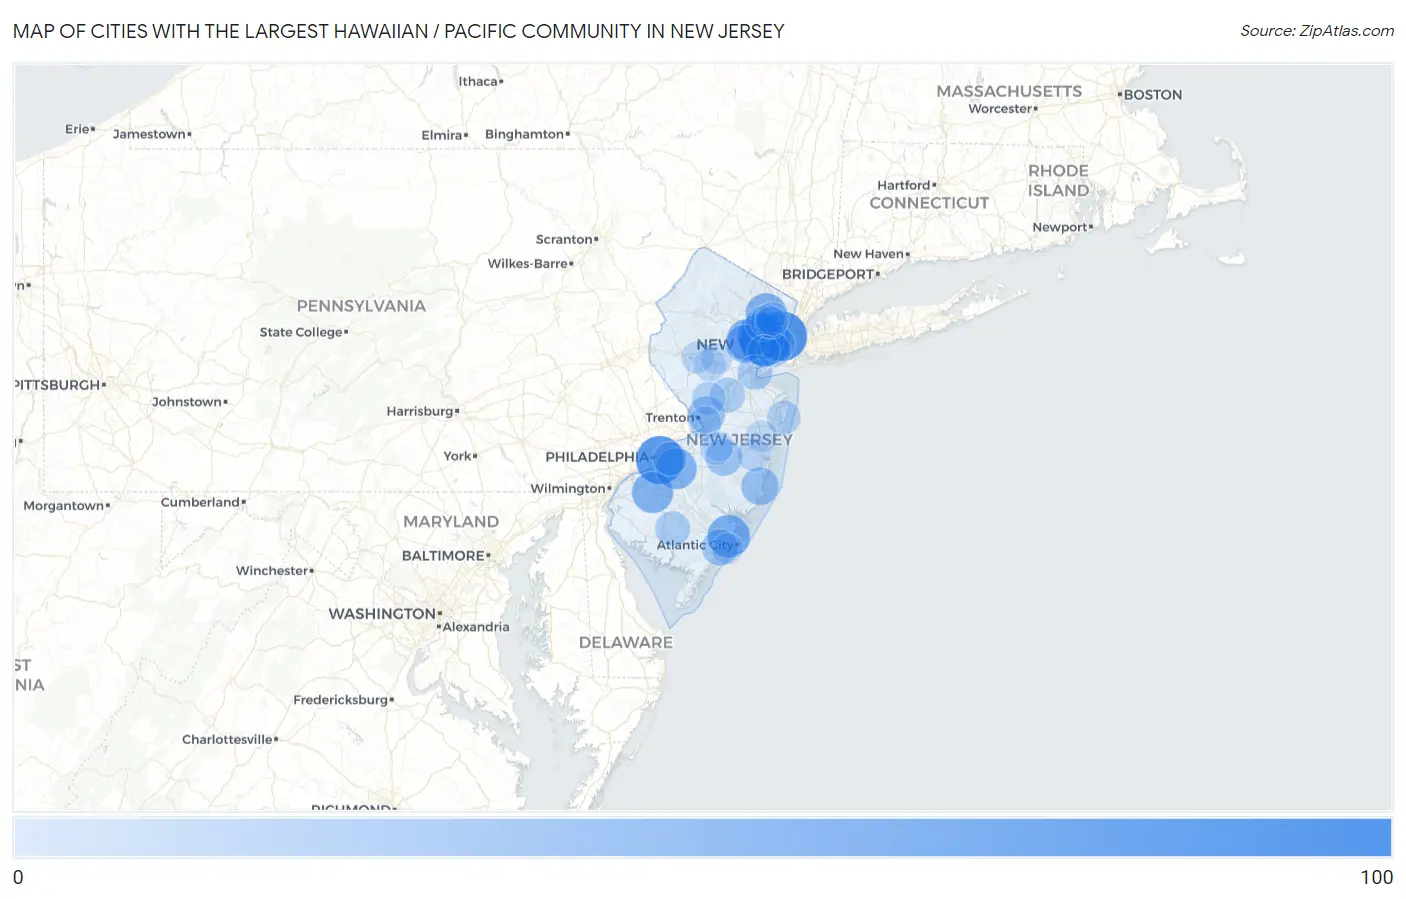
Map of Cities with the Largest Hawaiian / Pacific Community in New Jersey
0
100
Cities with the Largest Hawaiian / Pacific Community in New Jersey
| City | Hawaiian / Pacific | vs State | vs National | |
| 1. | Newark | 85 | 2,554(3.33%)#1 | 624,863(0.01%)#928 |
| 2. | Carteret Borough | 85 | 2,554(3.33%)#2 | 624,863(0.01%)#935 |
| 3. | Union City | 84 | 2,554(3.29%)#3 | 624,863(0.01%)#943 |
| 4. | Camden | 78 | 2,554(3.05%)#4 | 624,863(0.01%)#986 |
| 5. | East Orange | 70 | 2,554(2.74%)#5 | 624,863(0.01%)#1,047 |
| 6. | Fort Lee Borough | 55 | 2,554(2.15%)#6 | 624,863(0.01%)#1,227 |
| 7. | Absecon | 54 | 2,554(2.11%)#7 | 624,863(0.01%)#1,242 |
| 8. | Short Hills | 51 | 2,554(2.00%)#8 | 624,863(0.01%)#1,273 |
| 9. | Paterson | 48 | 2,554(1.88%)#9 | 624,863(0.01%)#1,309 |
| 10. | Richwood | 48 | 2,554(1.88%)#10 | 624,863(0.01%)#1,324 |
| 11. | Springdale | 47 | 2,554(1.84%)#11 | 624,863(0.01%)#1,340 |
| 12. | East Vineland | 43 | 2,554(1.68%)#12 | 624,863(0.01%)#1,396 |
| 13. | Summit | 35 | 2,554(1.37%)#13 | 624,863(0.01%)#1,548 |
| 14. | Roselle Borough | 35 | 2,554(1.37%)#14 | 624,863(0.01%)#1,549 |
| 15. | Barnegat | 33 | 2,554(1.29%)#15 | 624,863(0.01%)#1,604 |
| 16. | Somerdale Borough | 31 | 2,554(1.21%)#16 | 624,863(0.00%)#1,659 |
| 17. | Point Pleasant Borough | 30 | 2,554(1.17%)#17 | 624,863(0.00%)#1,675 |
| 18. | Mercerville | 30 | 2,554(1.17%)#18 | 624,863(0.00%)#1,678 |
| 19. | Little Silver Borough | 29 | 2,554(1.14%)#19 | 624,863(0.00%)#1,708 |
| 20. | Country Lake Estates | 28 | 2,554(1.10%)#20 | 624,863(0.00%)#1,749 |
| 21. | Linwood | 27 | 2,554(1.06%)#21 | 624,863(0.00%)#1,784 |
| 22. | Sayreville Borough | 26 | 2,554(1.02%)#22 | 624,863(0.00%)#1,797 |
| 23. | Landing | 26 | 2,554(1.02%)#23 | 624,863(0.00%)#1,820 |
| 24. | Lodi Borough | 24 | 2,554(0.94%)#24 | 624,863(0.00%)#1,868 |
| 25. | Beachwood Borough | 23 | 2,554(0.90%)#25 | 624,863(0.00%)#1,915 |
| 26. | Alpha Borough | 23 | 2,554(0.90%)#26 | 624,863(0.00%)#1,931 |
| 27. | Saddle River Borough | 22 | 2,554(0.86%)#27 | 624,863(0.00%)#1,972 |
| 28. | Vineland | 21 | 2,554(0.82%)#28 | 624,863(0.00%)#1,987 |
| 29. | Perth Amboy | 21 | 2,554(0.82%)#29 | 624,863(0.00%)#1,988 |
| 30. | Dayton | 21 | 2,554(0.82%)#30 | 624,863(0.00%)#2,017 |
| 31. | Jersey City | 20 | 2,554(0.78%)#31 | 624,863(0.00%)#2,040 |
| 32. | South River Borough | 19 | 2,554(0.74%)#32 | 624,863(0.00%)#2,104 |
| 33. | Upper Montclair | 19 | 2,554(0.74%)#33 | 624,863(0.00%)#2,106 |
| 34. | Leonia Borough | 18 | 2,554(0.70%)#34 | 624,863(0.00%)#2,160 |
| 35. | Woodland Park Borough | 17 | 2,554(0.67%)#35 | 624,863(0.00%)#2,204 |
| 36. | Bayonne | 16 | 2,554(0.63%)#36 | 624,863(0.00%)#2,240 |
| 37. | Asbury Park | 16 | 2,554(0.63%)#37 | 624,863(0.00%)#2,262 |
| 38. | Cherry Hill Mall | 16 | 2,554(0.63%)#38 | 624,863(0.00%)#2,264 |
| 39. | Englewood Cliffs Borough | 16 | 2,554(0.63%)#39 | 624,863(0.00%)#2,272 |
| 40. | Clifton | 15 | 2,554(0.59%)#40 | 624,863(0.00%)#2,293 |
| 41. | Princeton | 15 | 2,554(0.59%)#41 | 624,863(0.00%)#2,304 |
| 42. | Garfield | 13 | 2,554(0.51%)#42 | 624,863(0.00%)#2,441 |
| 43. | Lake Hopatcong | 13 | 2,554(0.51%)#43 | 624,863(0.00%)#2,456 |
| 44. | Rumson Borough | 13 | 2,554(0.51%)#44 | 624,863(0.00%)#2,462 |
| 45. | Holiday City Berkeley | 12 | 2,554(0.47%)#45 | 624,863(0.00%)#2,537 |
| 46. | White Horse | 11 | 2,554(0.43%)#46 | 624,863(0.00%)#2,604 |
| 47. | Fort Dix | 11 | 2,554(0.43%)#47 | 624,863(0.00%)#2,612 |
| 48. | Elizabeth | 10 | 2,554(0.39%)#48 | 624,863(0.00%)#2,658 |
| 49. | Bradley Gardens | 10 | 2,554(0.39%)#49 | 624,863(0.00%)#2,677 |
| 50. | White House Station | 10 | 2,554(0.39%)#50 | 624,863(0.00%)#2,699 |
| 51. | Passaic | 9 | 2,554(0.35%)#51 | 624,863(0.00%)#2,737 |
| 52. | Butler Borough | 9 | 2,554(0.35%)#52 | 624,863(0.00%)#2,777 |
| 53. | Lakewood | 8 | 2,554(0.31%)#53 | 624,863(0.00%)#2,821 |
| 54. | Madison Borough | 8 | 2,554(0.31%)#54 | 624,863(0.00%)#2,848 |
| 55. | Bound Brook Borough | 8 | 2,554(0.31%)#55 | 624,863(0.00%)#2,855 |
| 56. | North Arlington Borough | 7 | 2,554(0.27%)#56 | 624,863(0.00%)#2,953 |
| 57. | New Providence Borough | 7 | 2,554(0.27%)#57 | 624,863(0.00%)#2,959 |
| 58. | Hopewell Borough | 7 | 2,554(0.27%)#58 | 624,863(0.00%)#3,001 |
| 59. | Chesilhurst Borough | 7 | 2,554(0.27%)#59 | 624,863(0.00%)#3,010 |
| 60. | South Plainfield Borough | 6 | 2,554(0.23%)#60 | 624,863(0.00%)#3,046 |
| 61. | Green Knoll | 6 | 2,554(0.23%)#61 | 624,863(0.00%)#3,077 |
| 62. | Buena Borough | 5 | 2,554(0.20%)#62 | 624,863(0.00%)#3,191 |
| 63. | Margate City | 4 | 2,554(0.16%)#63 | 624,863(0.00%)#3,313 |
| 64. | Palisades Park Borough | 1 | 2,554(0.04%)#64 | 624,863(0.00%)#3,689 |
| 65. | Mcguire Afb | 1 | 2,554(0.04%)#65 | 624,863(0.00%)#3,708 |
Common Questions
What are the Top 10 Cities with the Largest Hawaiian / Pacific Community in New Jersey?
Top 10 Cities with the Largest Hawaiian / Pacific Community in New Jersey are:
#1
85
#2
84
#3
78
#4
70
#5
54
#6
51
#7
48
#8
48
#9
47
#10
35
What city has the Largest Hawaiian / Pacific Community in New Jersey?
Newark has the Largest Hawaiian / Pacific Community in New Jersey with 85.
What is the Total Hawaiian / Pacific Population in the State of New Jersey?
Total Hawaiian / Pacific Population in New Jersey is 2,554.
What is the Total Hawaiian / Pacific Population in the United States?
Total Hawaiian / Pacific Population in the United States is 624,863.