Cities with the Largest Hawaiian / Pacific Community in Massachusetts
RELATED REPORTS & OPTIONS
Hawaiian / Pacific
Massachusetts
Compare Cities
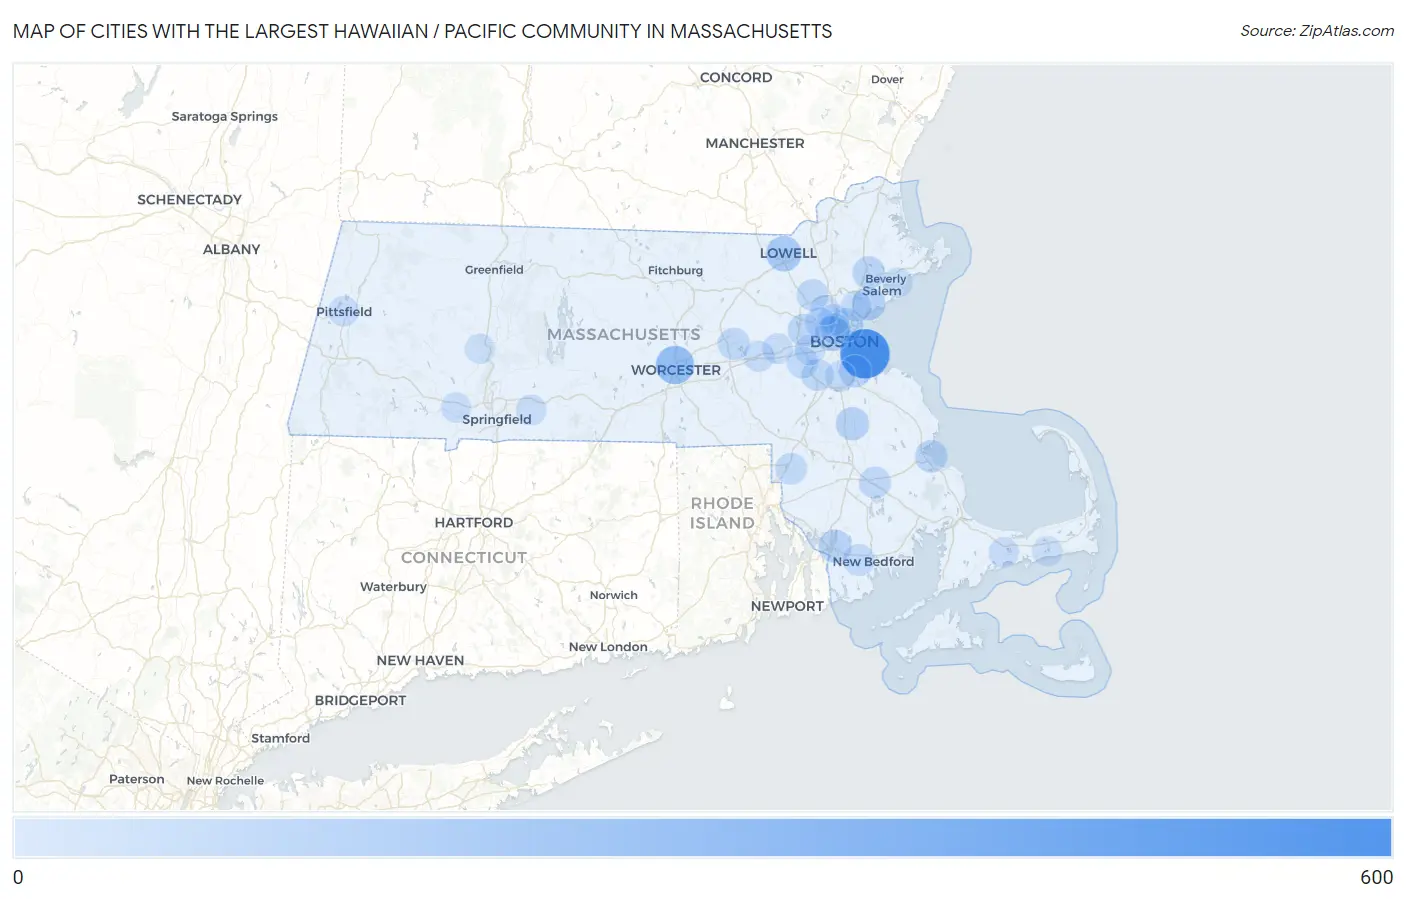
Map of Cities with the Largest Hawaiian / Pacific Community in Massachusetts
0
600
Cities with the Largest Hawaiian / Pacific Community in Massachusetts
| City | Hawaiian / Pacific | vs State | vs National | |
| 1. | Boston | 544 | 2,766(19.67%)#1 | 624,863(0.09%)#201 |
| 2. | Worcester | 227 | 2,766(8.21%)#2 | 624,863(0.04%)#452 |
| 3. | Lowell | 142 | 2,766(5.13%)#3 | 624,863(0.02%)#651 |
| 4. | Cambridge | 130 | 2,766(4.70%)#4 | 624,863(0.02%)#696 |
| 5. | Amherst | 119 | 2,766(4.30%)#5 | 624,863(0.02%)#744 |
| 6. | Everett | 94 | 2,766(3.40%)#6 | 624,863(0.02%)#872 |
| 7. | Brockton | 85 | 2,766(3.07%)#7 | 624,863(0.01%)#930 |
| 8. | Lynn | 82 | 2,766(2.96%)#8 | 624,863(0.01%)#960 |
| 9. | Fall River | 80 | 2,766(2.89%)#9 | 624,863(0.01%)#973 |
| 10. | North Plymouth | 69 | 2,766(2.49%)#10 | 624,863(0.01%)#1,056 |
| 11. | Danvers | 67 | 2,766(2.42%)#11 | 624,863(0.01%)#1,076 |
| 12. | Quincy | 63 | 2,766(2.28%)#12 | 624,863(0.01%)#1,119 |
| 13. | Waltham | 61 | 2,766(2.21%)#13 | 624,863(0.01%)#1,144 |
| 14. | Marlborough | 53 | 2,766(1.92%)#14 | 624,863(0.01%)#1,247 |
| 15. | Middleborough Center | 50 | 2,766(1.81%)#15 | 624,863(0.01%)#1,291 |
| 16. | Dedham | 49 | 2,766(1.77%)#16 | 624,863(0.01%)#1,295 |
| 17. | Burlington | 48 | 2,766(1.74%)#17 | 624,863(0.01%)#1,315 |
| 18. | Smith Mills | 45 | 2,766(1.63%)#18 | 624,863(0.01%)#1,361 |
| 19. | Needham | 43 | 2,766(1.55%)#19 | 624,863(0.01%)#1,385 |
| 20. | Attleboro | 42 | 2,766(1.52%)#20 | 624,863(0.01%)#1,404 |
| 21. | Medford | 32 | 2,766(1.16%)#21 | 624,863(0.01%)#1,612 |
| 22. | Saugus | 25 | 2,766(0.90%)#22 | 624,863(0.00%)#1,837 |
| 23. | Framingham | 24 | 2,766(0.87%)#23 | 624,863(0.00%)#1,858 |
| 24. | Milton | 20 | 2,766(0.72%)#24 | 624,863(0.00%)#2,050 |
| 25. | Somerville | 18 | 2,766(0.65%)#25 | 624,863(0.00%)#2,138 |
| 26. | Cochituate | 18 | 2,766(0.65%)#26 | 624,863(0.00%)#2,162 |
| 27. | Wilbraham | 15 | 2,766(0.54%)#27 | 624,863(0.00%)#2,331 |
| 28. | Newton | 14 | 2,766(0.51%)#28 | 624,863(0.00%)#2,357 |
| 29. | Arlington | 13 | 2,766(0.47%)#29 | 624,863(0.00%)#2,436 |
| 30. | Pittsfield | 12 | 2,766(0.43%)#30 | 624,863(0.00%)#2,511 |
| 31. | Barnstable Town | 11 | 2,766(0.40%)#31 | 624,863(0.00%)#2,579 |
| 32. | Westfield | 11 | 2,766(0.40%)#32 | 624,863(0.00%)#2,583 |
| 33. | West Dennis | 9 | 2,766(0.33%)#33 | 624,863(0.00%)#2,791 |
| 34. | Greenfield | 8 | 2,766(0.29%)#34 | 624,863(0.00%)#2,844 |
| 35. | Northampton | 6 | 2,766(0.22%)#35 | 624,863(0.00%)#3,043 |
| 36. | Winchester | 6 | 2,766(0.22%)#36 | 624,863(0.00%)#3,048 |
| 37. | Beverly | 5 | 2,766(0.18%)#37 | 624,863(0.00%)#3,152 |
Common Questions
What are the Top 10 Cities with the Largest Hawaiian / Pacific Community in Massachusetts?
Top 10 Cities with the Largest Hawaiian / Pacific Community in Massachusetts are:
#1
544
#2
227
#3
142
#4
130
#5
94
#6
85
#7
82
#8
80
#9
69
#10
67
What city has the Largest Hawaiian / Pacific Community in Massachusetts?
Boston has the Largest Hawaiian / Pacific Community in Massachusetts with 544.
What is the Total Hawaiian / Pacific Population in the State of Massachusetts?
Total Hawaiian / Pacific Population in Massachusetts is 2,766.
What is the Total Hawaiian / Pacific Population in the United States?
Total Hawaiian / Pacific Population in the United States is 624,863.