Zip Codes with the Highest Percentage of Population Employed in Construction & Extraction in Wyoming
RELATED REPORTS & OPTIONS
Construction & Extraction
Wyoming
Compare Zip Codes
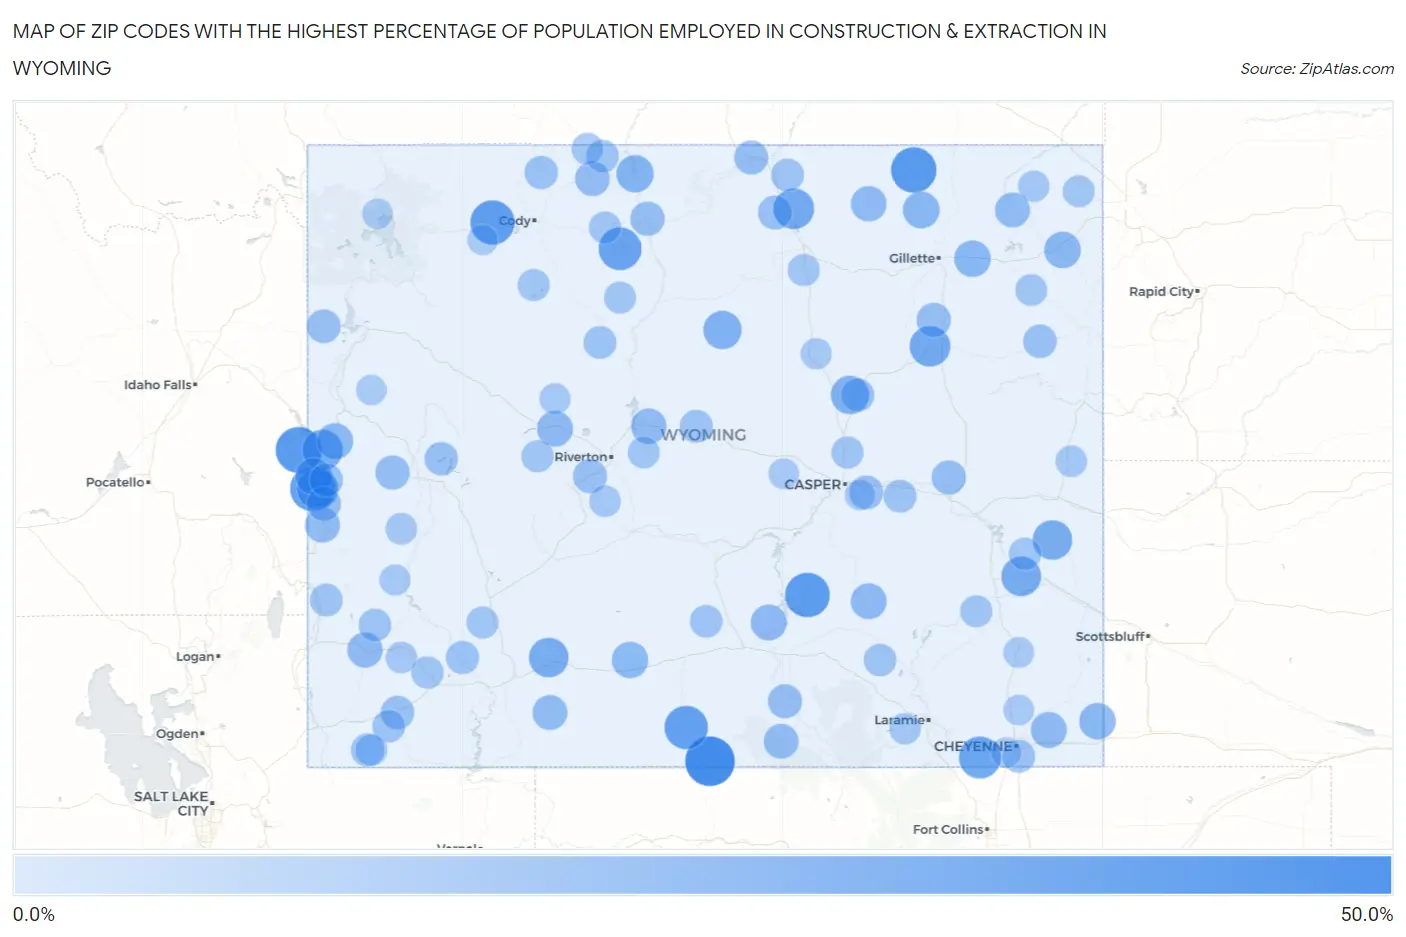
Map of Zip Codes with the Highest Percentage of Population Employed in Construction & Extraction in Wyoming
0.0%
50.0%
Zip Codes with the Highest Percentage of Population Employed in Construction & Extraction in Wyoming
| Zip Code | % Employed | vs State | vs National | |
| 1. | 82323 | 43.7% | 8.6%(+35.0)#1 | 5.0%(+38.7)#174 |
| 2. | 83120 | 36.3% | 8.6%(+27.7)#2 | 5.0%(+31.3)#270 |
| 3. | 82725 | 35.3% | 8.6%(+26.6)#3 | 5.0%(+30.3)#289 |
| 4. | 83111 | 33.7% | 8.6%(+25.1)#4 | 5.0%(+28.7)#318 |
| 5. | 82327 | 33.5% | 8.6%(+24.9)#5 | 5.0%(+28.5)#320 |
| 6. | 82450 | 32.8% | 8.6%(+24.2)#6 | 5.0%(+27.8)#334 |
| 7. | 82321 | 31.0% | 8.6%(+22.3)#7 | 5.0%(+26.0)#371 |
| 8. | 82434 | 29.7% | 8.6%(+21.1)#8 | 5.0%(+24.7)#408 |
| 9. | 82059 | 28.0% | 8.6%(+19.4)#9 | 5.0%(+23.0)#463 |
| 10. | 83122 | 26.3% | 8.6%(+17.7)#10 | 5.0%(+21.3)#536 |
| 11. | 82832 | 25.6% | 8.6%(+17.0)#11 | 5.0%(+20.6)#563 |
| 12. | 82732 | 25.4% | 8.6%(+16.8)#12 | 5.0%(+20.4)#568 |
| 13. | 83118 | 25.1% | 8.6%(+16.5)#13 | 5.0%(+20.1)#583 |
| 14. | 82214 | 23.4% | 8.6%(+14.8)#14 | 5.0%(+18.4)#688 |
| 15. | 82945 | 23.1% | 8.6%(+14.4)#15 | 5.0%(+18.1)#715 |
| 16. | 82219 | 23.1% | 8.6%(+14.4)#16 | 5.0%(+18.1)#720 |
| 17. | 82643 | 20.7% | 8.6%(+12.0)#17 | 5.0%(+15.7)#918 |
| 18. | 82442 | 20.3% | 8.6%(+11.7)#18 | 5.0%(+15.3)#955 |
| 19. | 82431 | 18.5% | 8.6%(+9.87)#19 | 5.0%(+13.5)#1,205 |
| 20. | 82716 | 17.4% | 8.6%(+8.76)#20 | 5.0%(+12.4)#1,399 |
| 21. | 83127 | 17.2% | 8.6%(+8.53)#21 | 5.0%(+12.2)#1,431 |
| 22. | 82729 | 17.1% | 8.6%(+8.45)#22 | 5.0%(+12.1)#1,449 |
| 23. | 82727 | 17.1% | 8.6%(+8.42)#23 | 5.0%(+12.1)#1,458 |
| 24. | 82082 | 16.9% | 8.6%(+8.27)#24 | 5.0%(+11.9)#1,484 |
| 25. | 82336 | 16.7% | 8.6%(+8.02)#25 | 5.0%(+11.7)#1,552 |
| 26. | 83128 | 16.4% | 8.6%(+7.76)#26 | 5.0%(+11.4)#1,611 |
| 27. | 82060 | 15.8% | 8.6%(+7.17)#27 | 5.0%(+10.8)#1,763 |
| 28. | 82334 | 15.7% | 8.6%(+7.09)#28 | 5.0%(+10.7)#1,784 |
| 29. | 82329 | 15.6% | 8.6%(+6.98)#29 | 5.0%(+10.6)#1,815 |
| 30. | 82516 | 15.6% | 8.6%(+6.91)#30 | 5.0%(+10.6)#1,834 |
| 31. | 82831 | 15.0% | 8.6%(+6.30)#31 | 5.0%(+9.96)#2,045 |
| 32. | 82649 | 14.7% | 8.6%(+6.05)#32 | 5.0%(+9.71)#2,158 |
| 33. | 83116 | 14.6% | 8.6%(+5.93)#33 | 5.0%(+9.59)#2,208 |
| 34. | 82721 | 14.0% | 8.6%(+5.31)#34 | 5.0%(+8.96)#2,482 |
| 35. | 83126 | 13.9% | 8.6%(+5.26)#35 | 5.0%(+8.91)#2,504 |
| 36. | 82901 | 13.7% | 8.6%(+5.08)#36 | 5.0%(+8.74)#2,575 |
| 37. | 82325 | 13.5% | 8.6%(+4.88)#37 | 5.0%(+8.54)#2,689 |
| 38. | 82412 | 13.2% | 8.6%(+4.57)#38 | 5.0%(+8.23)#2,831 |
| 39. | 82718 | 12.7% | 8.6%(+4.03)#39 | 5.0%(+7.69)#3,127 |
| 40. | 83110 | 12.5% | 8.6%(+3.82)#40 | 5.0%(+7.47)#3,286 |
| 41. | 82426 | 12.4% | 8.6%(+3.78)#41 | 5.0%(+7.44)#3,321 |
| 42. | 82633 | 12.4% | 8.6%(+3.75)#42 | 5.0%(+7.41)#3,343 |
| 43. | 83115 | 12.3% | 8.6%(+3.66)#43 | 5.0%(+7.31)#3,395 |
| 44. | 82331 | 12.2% | 8.6%(+3.57)#44 | 5.0%(+7.22)#3,446 |
| 45. | 82839 | 12.0% | 8.6%(+3.37)#45 | 5.0%(+7.02)#3,574 |
| 46. | 82515 | 11.8% | 8.6%(+3.17)#46 | 5.0%(+6.82)#3,710 |
| 47. | 82842 | 11.8% | 8.6%(+3.12)#47 | 5.0%(+6.77)#3,740 |
| 48. | 82636 | 11.6% | 8.6%(+2.94)#48 | 5.0%(+6.60)#3,892 |
| 49. | 83414 | 11.6% | 8.6%(+2.92)#49 | 5.0%(+6.58)#3,909 |
| 50. | 82701 | 11.1% | 8.6%(+2.42)#50 | 5.0%(+6.08)#4,311 |
| 51. | 83112 | 10.9% | 8.6%(+2.24)#51 | 5.0%(+5.89)#4,477 |
| 52. | 82937 | 10.9% | 8.6%(+2.23)#52 | 5.0%(+5.89)#4,483 |
| 53. | 82635 | 10.6% | 8.6%(+1.99)#53 | 5.0%(+5.64)#4,720 |
| 54. | 82941 | 10.6% | 8.6%(+1.98)#54 | 5.0%(+5.64)#4,728 |
| 55. | 82435 | 10.5% | 8.6%(+1.84)#55 | 5.0%(+5.50)#4,862 |
| 56. | 82935 | 10.2% | 8.6%(+1.58)#56 | 5.0%(+5.24)#5,154 |
| 57. | 82930 | 10.2% | 8.6%(+1.51)#57 | 5.0%(+5.16)#5,221 |
| 58. | 82642 | 10.0% | 8.6%(+1.35)#58 | 5.0%(+5.01)#5,413 |
| 59. | 82007 | 9.8% | 8.6%(+1.16)#59 | 5.0%(+4.82)#5,627 |
| 60. | 82637 | 9.8% | 8.6%(+1.14)#60 | 5.0%(+4.80)#5,653 |
| 61. | 82443 | 9.8% | 8.6%(+1.11)#61 | 5.0%(+4.76)#5,704 |
| 62. | 82801 | 9.5% | 8.6%(+0.885)#62 | 5.0%(+4.54)#5,988 |
| 63. | 83114 | 9.5% | 8.6%(+0.875)#63 | 5.0%(+4.53)#6,002 |
| 64. | 82939 | 9.4% | 8.6%(+0.795)#64 | 5.0%(+4.45)#6,116 |
| 65. | 82420 | 9.2% | 8.6%(+0.532)#65 | 5.0%(+4.19)#6,471 |
| 66. | 82301 | 9.2% | 8.6%(+0.521)#66 | 5.0%(+4.18)#6,487 |
| 67. | 83101 | 9.1% | 8.6%(+0.460)#67 | 5.0%(+4.12)#6,592 |
| 68. | 82083 | 8.9% | 8.6%(+0.269)#68 | 5.0%(+3.92)#6,891 |
| 69. | 82215 | 8.7% | 8.6%(+0.047)#69 | 5.0%(+3.70)#7,251 |
| 70. | 82934 | 8.7% | 8.6%(+0.047)#70 | 5.0%(+3.70)#7,252 |
| 71. | 82514 | 8.5% | 8.6%(-0.127)#71 | 5.0%(+3.53)#7,541 |
| 72. | 82601 | 8.4% | 8.6%(-0.258)#72 | 5.0%(+3.40)#7,775 |
| 73. | 82411 | 8.2% | 8.6%(-0.452)#73 | 5.0%(+3.20)#8,111 |
| 74. | 82201 | 8.1% | 8.6%(-0.508)#74 | 5.0%(+3.15)#8,200 |
| 75. | 82433 | 8.0% | 8.6%(-0.600)#75 | 5.0%(+3.05)#8,395 |
| 76. | 82932 | 8.0% | 8.6%(-0.606)#76 | 5.0%(+3.05)#8,408 |
| 77. | 82834 | 7.9% | 8.6%(-0.712)#77 | 5.0%(+2.94)#8,620 |
| 78. | 82401 | 7.8% | 8.6%(-0.835)#78 | 5.0%(+2.82)#8,852 |
| 79. | 82710 | 7.7% | 8.6%(-0.907)#79 | 5.0%(+2.75)#9,002 |
| 80. | 82423 | 7.7% | 8.6%(-0.956)#80 | 5.0%(+2.70)#9,112 |
| 81. | 82501 | 7.5% | 8.6%(-1.12)#81 | 5.0%(+2.54)#9,467 |
| 82. | 82730 | 7.5% | 8.6%(-1.16)#82 | 5.0%(+2.50)#9,553 |
| 83. | 83113 | 7.3% | 8.6%(-1.39)#83 | 5.0%(+2.27)#10,069 |
| 84. | 82225 | 7.0% | 8.6%(-1.64)#84 | 5.0%(+2.02)#10,713 |
| 85. | 82944 | 7.0% | 8.6%(-1.66)#85 | 5.0%(+2.00)#10,766 |
| 86. | 82520 | 7.0% | 8.6%(-1.67)#86 | 5.0%(+1.99)#10,787 |
| 87. | 83124 | 6.9% | 8.6%(-1.75)#87 | 5.0%(+1.90)#10,999 |
| 88. | 82720 | 6.8% | 8.6%(-1.81)#88 | 5.0%(+1.84)#11,150 |
| 89. | 82070 | 6.7% | 8.6%(-1.98)#89 | 5.0%(+1.68)#11,557 |
| 90. | 82523 | 6.1% | 8.6%(-2.55)#90 | 5.0%(+1.10)#13,217 |
| 91. | 82639 | 6.0% | 8.6%(-2.69)#91 | 5.0%(+0.965)#13,616 |
| 92. | 83123 | 6.0% | 8.6%(-2.70)#92 | 5.0%(+0.958)#13,639 |
| 93. | 82210 | 5.6% | 8.6%(-3.03)#93 | 5.0%(+0.624)#14,650 |
| 94. | 82604 | 5.2% | 8.6%(-3.42)#94 | 5.0%(+0.233)#15,964 |
| 95. | 82009 | 5.1% | 8.6%(-3.57)#95 | 5.0%(+0.085)#16,458 |
| 96. | 82609 | 5.0% | 8.6%(-3.65)#96 | 5.0%(+0.005)#16,764 |
| 97. | 82190 | 4.9% | 8.6%(-3.75)#97 | 5.0%(-0.100)#17,132 |
| 98. | 82414 | 4.9% | 8.6%(-3.78)#98 | 5.0%(-0.126)#17,219 |
| 99. | 82001 | 4.6% | 8.6%(-4.01)#99 | 5.0%(-0.353)#17,985 |
| 100. | 83001 | 4.6% | 8.6%(-4.05)#100 | 5.0%(-0.396)#18,150 |
1
2Common Questions
What are the Top 10 Zip Codes with the Highest Percentage of Population Employed in Construction & Extraction in Wyoming?
Top 10 Zip Codes with the Highest Percentage of Population Employed in Construction & Extraction in Wyoming are:
What zip code has the Highest Percentage of Population Employed in Construction & Extraction in Wyoming?
82323 has the Highest Percentage of Population Employed in Construction & Extraction in Wyoming with 43.7%.
What is the Percentage of Population Employed in Construction & Extraction in the State of Wyoming?
Percentage of Population Employed in Construction & Extraction in Wyoming is 8.6%.
What is the Percentage of Population Employed in Construction & Extraction in the United States?
Percentage of Population Employed in Construction & Extraction in the United States is 5.0%.