Zip Codes with the Highest Percentage of Black / African American Population in Wyoming
RELATED REPORTS & OPTIONS
Black / African American
Wyoming
Compare Zip Codes
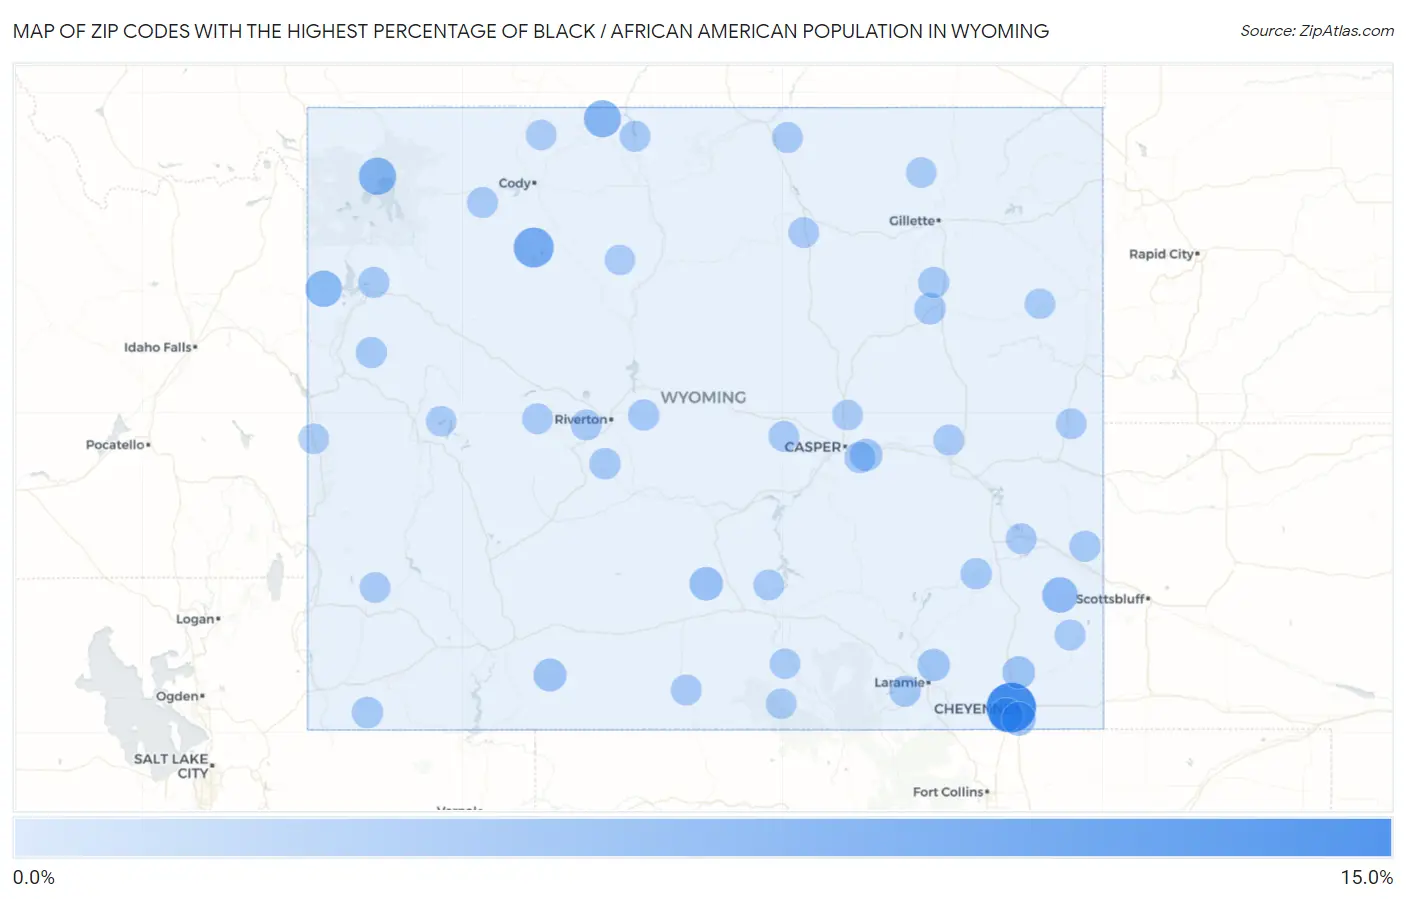
Map of Zip Codes with the Highest Percentage of Black / African American Population in Wyoming
0.0%
15.0%
Zip Codes with the Highest Percentage of Black / African American Population in Wyoming
| Zip Code | Black / African American | vs State | vs National | |
| 1. | 82005 | 15.0% | 0.85%(+14.1)#1 | 12.5%(+2.50)#4,963 |
| 2. | 82433 | 7.4% | 0.85%(+6.58)#2 | 12.5%(-5.04)#7,853 |
| 3. | 82190 | 5.3% | 0.85%(+4.45)#3 | 12.5%(-7.17)#9,313 |
| 4. | 82420 | 5.0% | 0.85%(+4.20)#4 | 12.5%(-7.42)#9,518 |
| 5. | 83414 | 4.6% | 0.85%(+3.71)#5 | 12.5%(-7.92)#9,962 |
| 6. | 82244 | 4.0% | 0.85%(+3.11)#6 | 12.5%(-8.52)#10,556 |
| 7. | 82001 | 3.0% | 0.85%(+2.12)#7 | 12.5%(-9.50)#11,877 |
| 8. | 82007 | 2.7% | 0.85%(+1.86)#8 | 12.5%(-9.77)#12,284 |
| 9. | 82301 | 2.4% | 0.85%(+1.54)#9 | 12.5%(-10.1)#12,810 |
| 10. | 82901 | 1.9% | 0.85%(+1.06)#10 | 12.5%(-10.6)#13,797 |
| 11. | 82009 | 1.7% | 0.85%(+0.813)#11 | 12.5%(-10.8)#14,397 |
| 12. | 82636 | 1.5% | 0.85%(+0.640)#12 | 12.5%(-11.0)#14,862 |
| 13. | 82072 | 1.5% | 0.85%(+0.615)#13 | 12.5%(-11.0)#14,939 |
| 14. | 82732 | 0.86% | 0.85%(+0.015)#14 | 12.5%(-11.6)#17,134 |
| 15. | 82609 | 0.74% | 0.85%(-0.108)#15 | 12.5%(-11.7)#17,754 |
| 16. | 82930 | 0.71% | 0.85%(-0.137)#16 | 12.5%(-11.8)#17,902 |
| 17. | 82520 | 0.70% | 0.85%(-0.144)#17 | 12.5%(-11.8)#17,947 |
| 18. | 82201 | 0.67% | 0.85%(-0.179)#18 | 12.5%(-11.8)#18,136 |
| 19. | 82070 | 0.63% | 0.85%(-0.214)#19 | 12.5%(-11.8)#18,315 |
| 20. | 82501 | 0.61% | 0.85%(-0.232)#20 | 12.5%(-11.9)#18,409 |
| 21. | 82718 | 0.60% | 0.85%(-0.248)#21 | 12.5%(-11.9)#18,495 |
| 22. | 82240 | 0.57% | 0.85%(-0.272)#22 | 12.5%(-11.9)#18,630 |
| 23. | 83013 | 0.52% | 0.85%(-0.328)#23 | 12.5%(-12.0)#18,984 |
| 24. | 83001 | 0.49% | 0.85%(-0.361)#24 | 12.5%(-12.0)#19,198 |
| 25. | 82414 | 0.45% | 0.85%(-0.401)#25 | 12.5%(-12.0)#19,428 |
| 26. | 82431 | 0.44% | 0.85%(-0.409)#26 | 12.5%(-12.0)#19,482 |
| 27. | 82221 | 0.39% | 0.85%(-0.452)#27 | 12.5%(-12.1)#19,776 |
| 28. | 82510 | 0.36% | 0.85%(-0.486)#28 | 12.5%(-12.1)#20,018 |
| 29. | 82801 | 0.34% | 0.85%(-0.503)#29 | 12.5%(-12.1)#20,126 |
| 30. | 82334 | 0.34% | 0.85%(-0.511)#30 | 12.5%(-12.1)#20,184 |
| 31. | 82633 | 0.33% | 0.85%(-0.511)#31 | 12.5%(-12.1)#20,185 |
| 32. | 82604 | 0.30% | 0.85%(-0.548)#32 | 12.5%(-12.2)#20,431 |
| 33. | 82321 | 0.28% | 0.85%(-0.563)#33 | 12.5%(-12.2)#20,539 |
| 34. | 82214 | 0.26% | 0.85%(-0.588)#34 | 12.5%(-12.2)#20,722 |
| 35. | 82225 | 0.23% | 0.85%(-0.618)#35 | 12.5%(-12.2)#20,952 |
| 36. | 82834 | 0.21% | 0.85%(-0.633)#36 | 12.5%(-12.3)#21,065 |
| 37. | 82514 | 0.21% | 0.85%(-0.634)#37 | 12.5%(-12.3)#21,067 |
| 38. | 83101 | 0.19% | 0.85%(-0.658)#38 | 12.5%(-12.3)#21,248 |
| 39. | 82325 | 0.15% | 0.85%(-0.701)#39 | 12.5%(-12.3)#21,591 |
| 40. | 82601 | 0.13% | 0.85%(-0.713)#40 | 12.5%(-12.3)#21,676 |
| 41. | 82435 | 0.13% | 0.85%(-0.717)#41 | 12.5%(-12.3)#21,710 |
| 42. | 83127 | 0.13% | 0.85%(-0.721)#42 | 12.5%(-12.3)#21,745 |
| 43. | 82701 | 0.11% | 0.85%(-0.735)#43 | 12.5%(-12.4)#21,863 |
| 44. | 82716 | 0.072% | 0.85%(-0.775)#44 | 12.5%(-12.4)#22,203 |
| 45. | 82331 | 0.042% | 0.85%(-0.804)#45 | 12.5%(-12.4)#22,423 |
| 46. | 82941 | 0.042% | 0.85%(-0.804)#46 | 12.5%(-12.4)#22,425 |
| 47. | 82401 | 0.014% | 0.85%(-0.832)#47 | 12.5%(-12.5)#22,587 |
1
2Common Questions
What are the Top 10 Zip Codes with the Highest Percentage of Black / African American Population in Wyoming?
Top 10 Zip Codes with the Highest Percentage of Black / African American Population in Wyoming are:
What zip code has the Highest Percentage of Black / African American Population in Wyoming?
82005 has the Highest Percentage of Black / African American Population in Wyoming with 15.0%.
What is the Percentage of Black / African American Population in the State of Wyoming?
Percentage of Black / African American Population in Wyoming is 0.85%.
What is the Percentage of Black / African American Population in the United States?
Percentage of Black / African American Population in the United States is 12.5%.