Zip Codes with the Highest Percentage of Population Walking to Work in Gillette, WY
RELATED REPORTS & OPTIONS
Select to Compare
Select to Compare
Compare Zip Codes
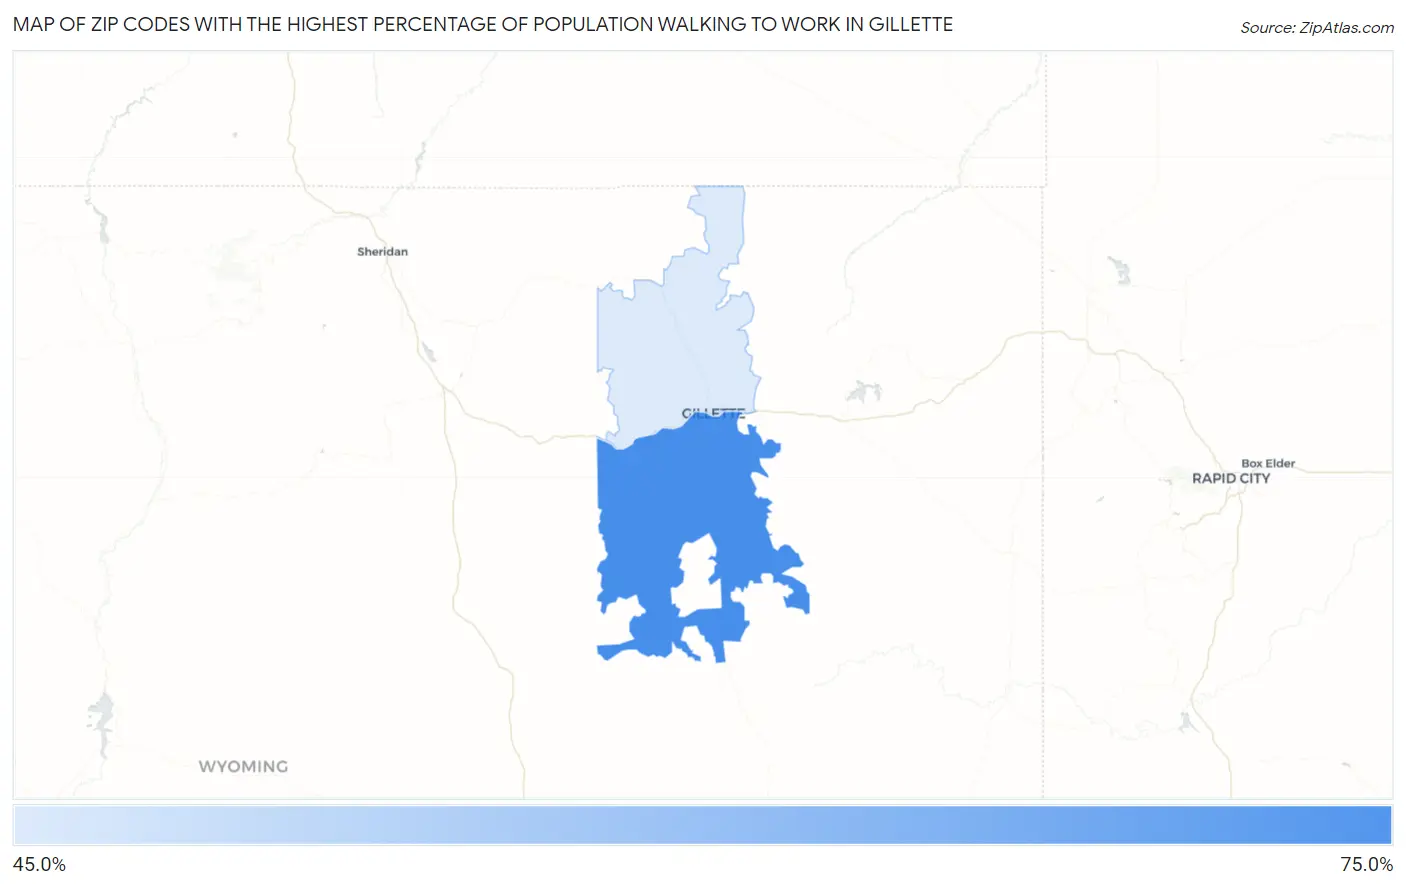
Map of Zip Codes with the Highest Percentage of Population Walking to Work in Gillette
48.7%
48.7%
Zip Codes with the Highest Percentage of Population Walking to Work in Gillette, WY
| Zip Code | % Walk to Work | vs State | vs National | |
| 1. | 82716 | 48.7% | 38.2%(+10.5)#29 | 33.4%(+15.3)#5,007 |
1
Common Questions
What are the Top Zip Codes with the Highest Percentage of Population Walking to Work in Gillette, WY?
Top Zip Codes with the Highest Percentage of Population Walking to Work in Gillette, WY are:
What zip code has the Highest Percentage of Population Walking to Work in Gillette, WY?
82716 has the Highest Percentage of Population Walking to Work in Gillette, WY with 48.7%.
What is the Percentage of Population Walking to Work in Gillette, WY?
Percentage of Population Walking to Work in Gillette is 57.8%.
What is the Percentage of Population Walking to Work in Wyoming?
Percentage of Population Walking to Work in Wyoming is 38.2%.
What is the Percentage of Population Walking to Work in the United States?
Percentage of Population Walking to Work in the United States is 33.4%.