Madison, WV Map & Demographics
Madison Map
Madison Overview
$27,649
PER CAPITA INCOME
$83,819
AVG FAMILY INCOME
$63,864
AVG HOUSEHOLD INCOME
0.38
INEQUALITY / GINI INDEX
2,880
TOTAL POPULATION
1,613
MALE POPULATION
1,267
FEMALE POPULATION
127.31
MALES / 100 FEMALES
78.55
FEMALES / 100 MALES
44.4
MEDIAN AGE
3.7
AVG FAMILY SIZE
2.8
AVG HOUSEHOLD SIZE
1,289
LABOR FORCE [ PEOPLE ]
55.8%
PERCENT IN LABOR FORCE
10.5%
UNEMPLOYMENT RATE
Madison Zip Codes
Madison Area Codes
Income in Madison
Income Overview in Madison
Per Capita Income in Madison is $27,649, while median incomes of families and households are $83,819 and $63,864 respectively.
| Characteristic | Number | Measure |
| Per Capita Income | 2,880 | $27,649 |
| Median Family Income | 651 | $83,819 |
| Mean Family Income | 651 | $92,589 |
| Median Household Income | 1,014 | $63,864 |
| Mean Household Income | 1,014 | $74,752 |
| Income Deficit | 651 | $0 |
| Wage / Income Gap (%) | 2,880 | 0.00% |
| Wage / Income Gap ($) | 2,880 | 100.00¢ per $1 |
| Gini / Inequality Index | 2,880 | 0.38 |
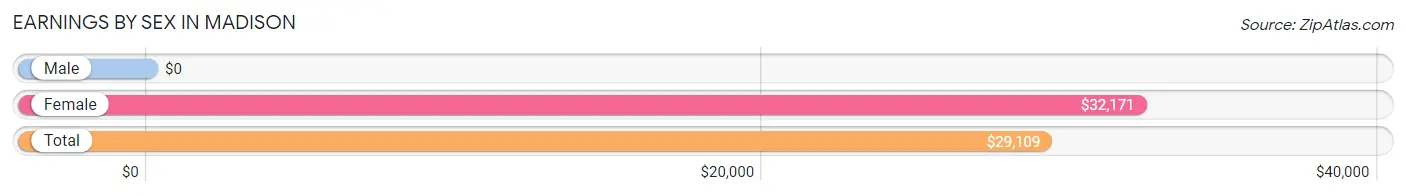
Earnings by Sex in Madison
| Sex | Number | Average Earnings |
| Male | 795 (60.4%) | $0 |
| Female | 521 (39.6%) | $32,171 |
| Total | 1,316 (100.0%) | $29,109 |
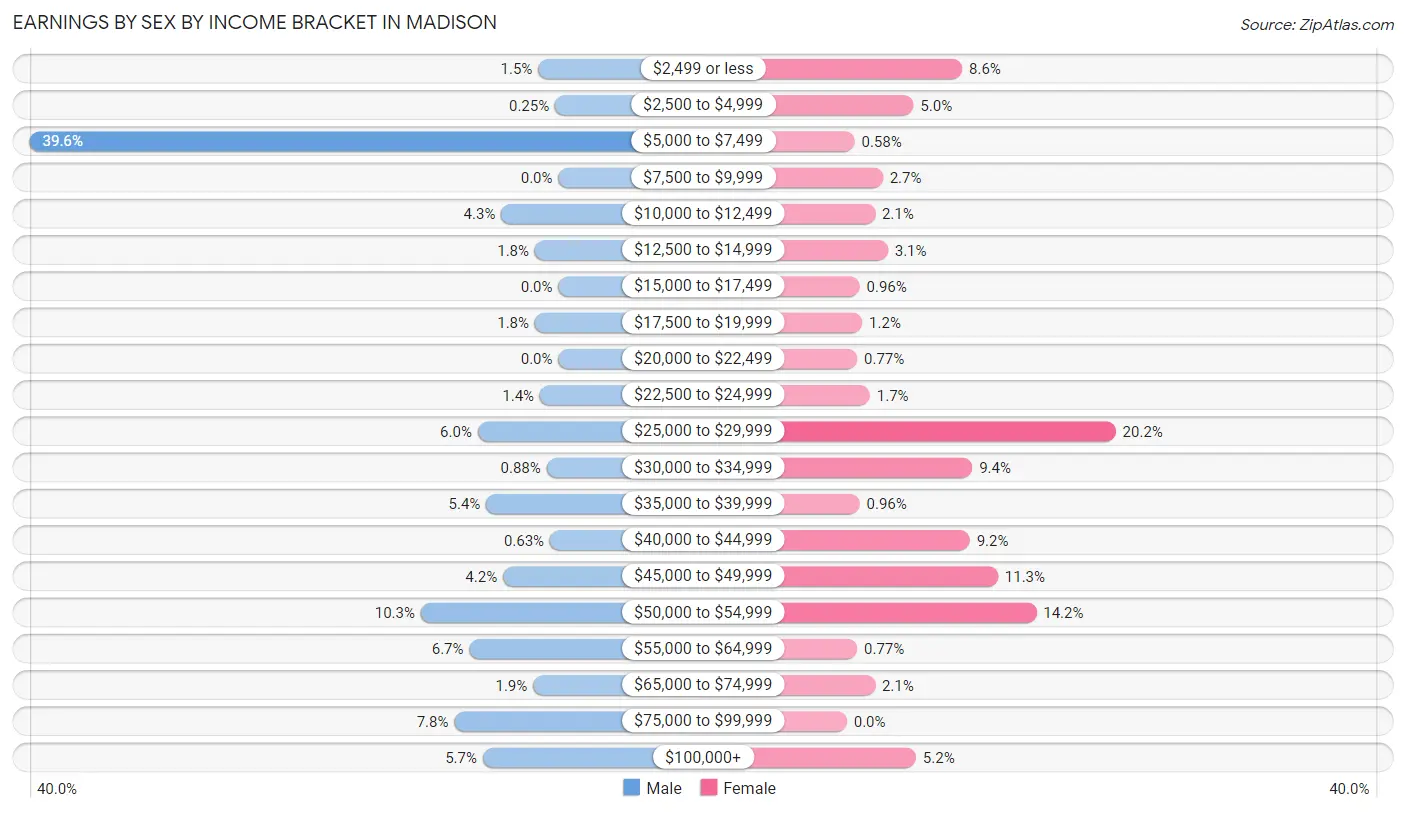
Earnings by Sex by Income Bracket in Madison
The most common earnings brackets in Madison are $5,000 to $7,499 for men (315 | 39.6%) and $25,000 to $29,999 for women (105 | 20.2%).
| Income | Male | Female |
| $2,499 or less | 12 (1.5%) | 45 (8.6%) |
| $2,500 to $4,999 | 2 (0.3%) | 26 (5.0%) |
| $5,000 to $7,499 | 315 (39.6%) | 3 (0.6%) |
| $7,500 to $9,999 | 0 (0.0%) | 14 (2.7%) |
| $10,000 to $12,499 | 34 (4.3%) | 11 (2.1%) |
| $12,500 to $14,999 | 14 (1.8%) | 16 (3.1%) |
| $15,000 to $17,499 | 0 (0.0%) | 5 (1.0%) |
| $17,500 to $19,999 | 14 (1.8%) | 6 (1.1%) |
| $20,000 to $22,499 | 0 (0.0%) | 4 (0.8%) |
| $22,500 to $24,999 | 11 (1.4%) | 9 (1.7%) |
| $25,000 to $29,999 | 48 (6.0%) | 105 (20.2%) |
| $30,000 to $34,999 | 7 (0.9%) | 49 (9.4%) |
| $35,000 to $39,999 | 43 (5.4%) | 5 (1.0%) |
| $40,000 to $44,999 | 5 (0.6%) | 48 (9.2%) |
| $45,000 to $49,999 | 33 (4.2%) | 59 (11.3%) |
| $50,000 to $54,999 | 82 (10.3%) | 74 (14.2%) |
| $55,000 to $64,999 | 53 (6.7%) | 4 (0.8%) |
| $65,000 to $74,999 | 15 (1.9%) | 11 (2.1%) |
| $75,000 to $99,999 | 62 (7.8%) | 0 (0.0%) |
| $100,000+ | 45 (5.7%) | 27 (5.2%) |
| Total | 795 (100.0%) | 521 (100.0%) |
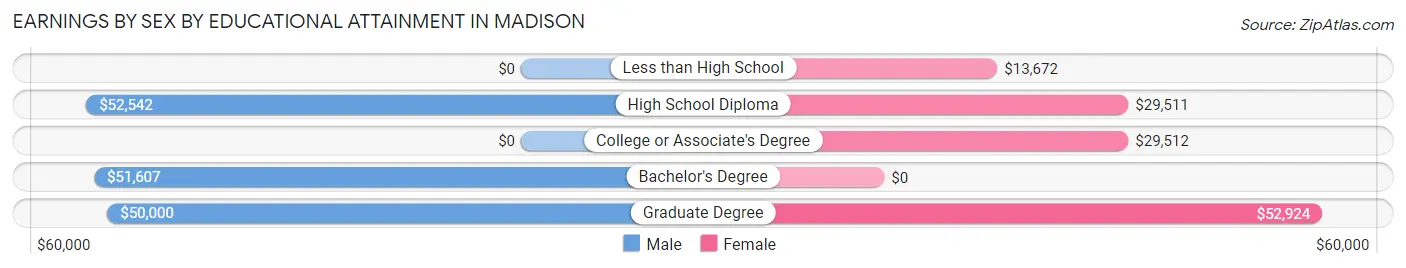
Earnings by Sex by Educational Attainment in Madison
Average earnings in Madison are $28,750 for men and $33,083 for women, a difference of 13.1%. Men with an educational attainment of high school diploma enjoy the highest average annual earnings of $52,542, while those with graduate degree education earn the least with $50,000. Women with an educational attainment of graduate degree earn the most with the average annual earnings of $52,924, while those with less than high school education have the smallest earnings of $13,672.
| Educational Attainment | Male Income | Female Income |
| Less than High School | - | - |
| High School Diploma | $52,542 | $29,511 |
| College or Associate's Degree | - | - |
| Bachelor's Degree | $51,607 | $0 |
| Graduate Degree | $50,000 | $52,924 |
| Total | $28,750 | $33,083 |
Family Income in Madison
Family Income Brackets in Madison
According to the Madison family income data, there are 155 families falling into the $100,000 to $149,999 income range, which is the most common income bracket and makes up 23.8% of all families.
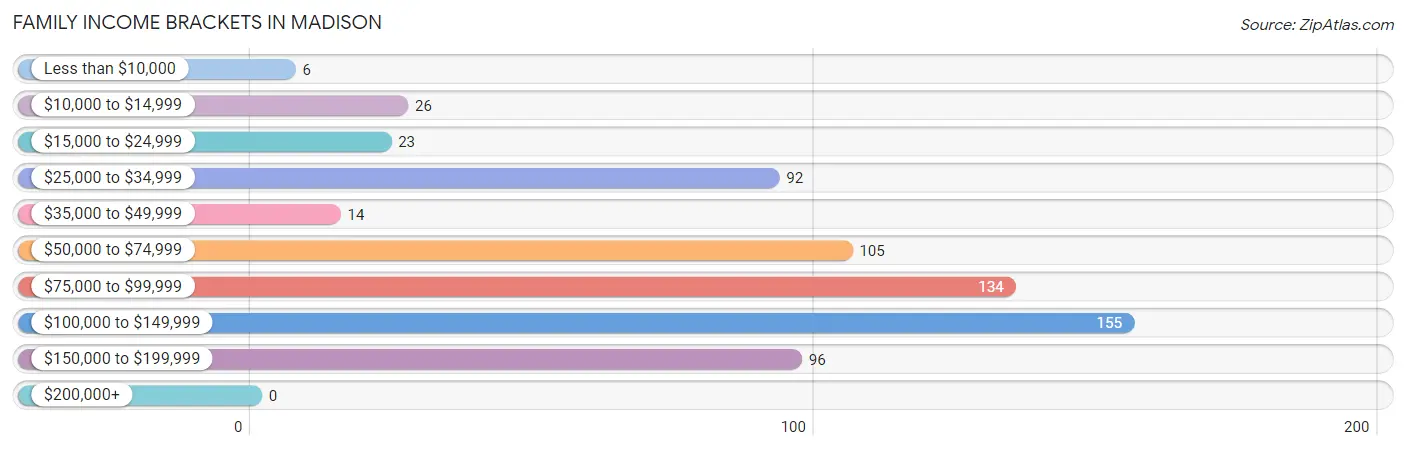
| Income Bracket | # Families | % Families |
| Less than $10,000 | 6 | 0.9% |
| $10,000 to $14,999 | 26 | 4.0% |
| $15,000 to $24,999 | 23 | 3.5% |
| $25,000 to $34,999 | 92 | 14.1% |
| $35,000 to $49,999 | 14 | 2.2% |
| $50,000 to $74,999 | 105 | 16.1% |
| $75,000 to $99,999 | 134 | 20.6% |
| $100,000 to $149,999 | 155 | 23.8% |
| $150,000 to $199,999 | 96 | 14.7% |
| $200,000+ | 0 | 0.0% |
Family Income by Famaliy Size in Madison
4-person families (131 | 20.1%) account for the highest median family income in Madison with $122,422 per family, while 2-person families (311 | 47.8%) have the highest median income of $33,722 per family member.
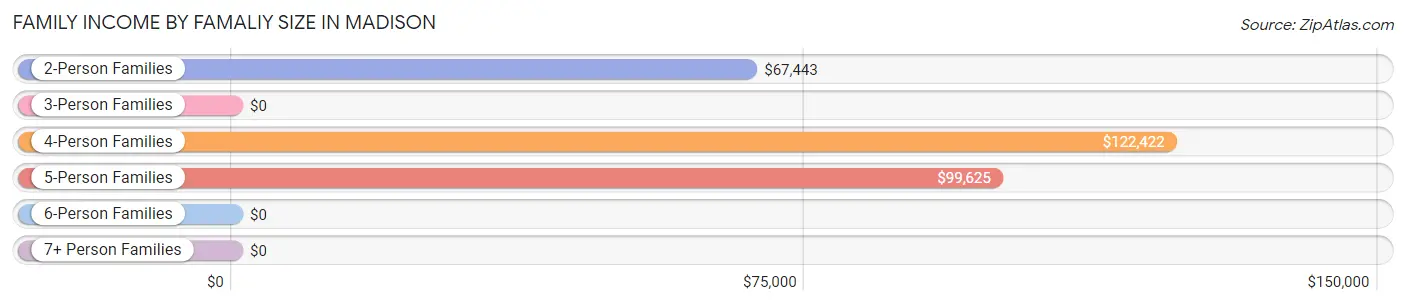
| Income Bracket | # Families | Median Income |
| 2-Person Families | 311 (47.8%) | $67,443 |
| 3-Person Families | 144 (22.1%) | $0 |
| 4-Person Families | 131 (20.1%) | $122,422 |
| 5-Person Families | 49 (7.5%) | $99,625 |
| 6-Person Families | 14 (2.1%) | $0 |
| 7+ Person Families | 2 (0.3%) | $0 |
| Total | 651 (100.0%) | $83,819 |
Family Income by Number of Earners in Madison
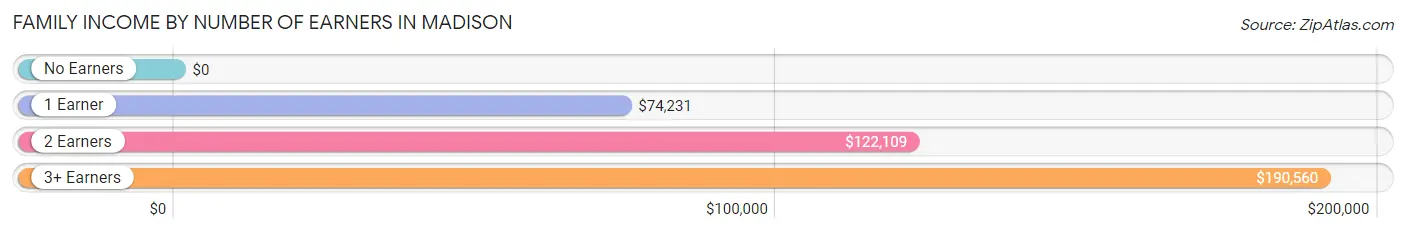
| Number of Earners | # Families | Median Income |
| No Earners | 195 (29.9%) | $0 |
| 1 Earner | 182 (28.0%) | $74,231 |
| 2 Earners | 229 (35.2%) | $122,109 |
| 3+ Earners | 45 (6.9%) | $190,560 |
| Total | 651 (100.0%) | $83,819 |
Household Income in Madison
Household Income Brackets in Madison
With 173 households falling in the category, the $100,000 to $149,999 income range is the most frequent in Madison, accounting for 17.1% of all households.
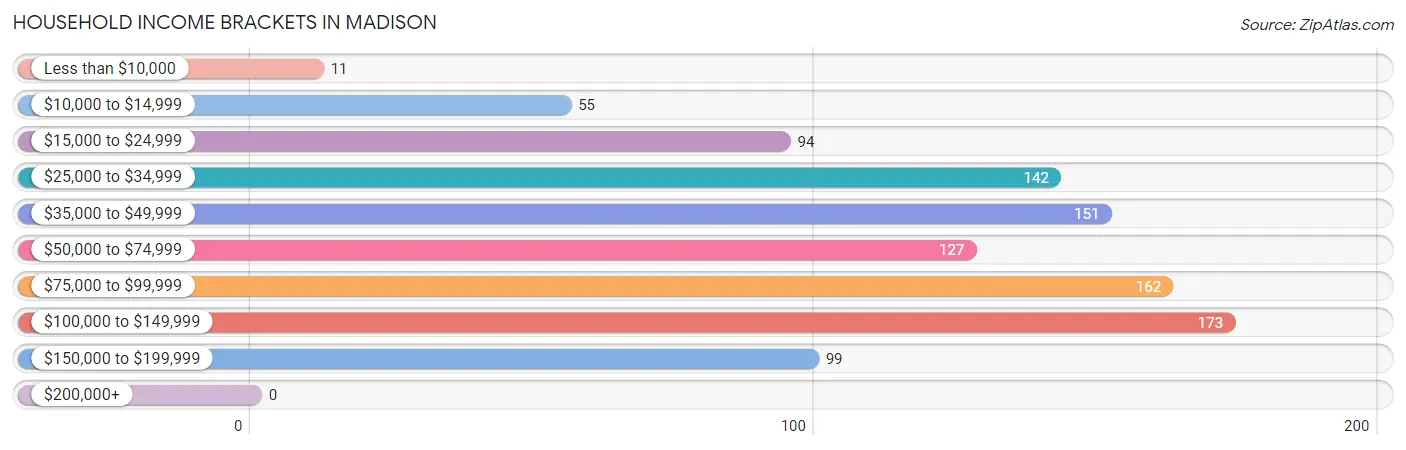
| Income Bracket | # Households | % Households |
| Less than $10,000 | 11 | 1.1% |
| $10,000 to $14,999 | 55 | 5.4% |
| $15,000 to $24,999 | 94 | 9.3% |
| $25,000 to $34,999 | 142 | 14.0% |
| $35,000 to $49,999 | 151 | 14.9% |
| $50,000 to $74,999 | 127 | 12.5% |
| $75,000 to $99,999 | 162 | 16.0% |
| $100,000 to $149,999 | 173 | 17.1% |
| $150,000 to $199,999 | 99 | 9.8% |
| $200,000+ | 0 | 0.0% |
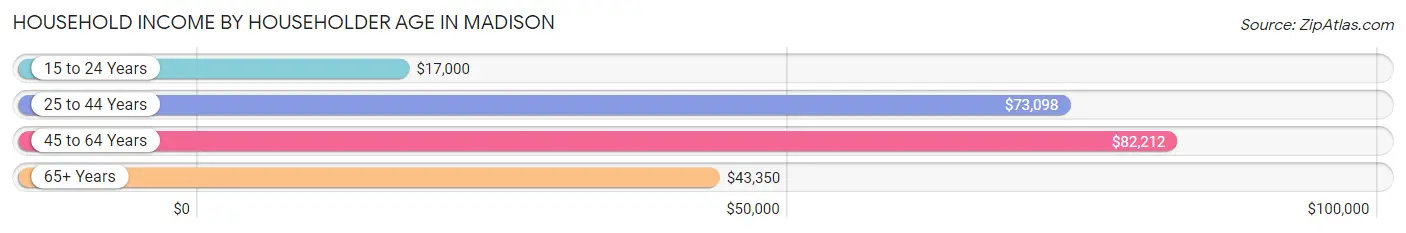
Household Income by Householder Age in Madison
The median household income in Madison is $63,864, with the highest median household income of $82,212 found in the 45 to 64 years age bracket for the primary householder. A total of 360 households (35.5%) fall into this category. Meanwhile, the 15 to 24 years age bracket for the primary householder has the lowest median household income of $17,000, with 24 households (2.4%) in this group.
| Income Bracket | # Households | Median Income |
| 15 to 24 Years | 24 (2.4%) | $17,000 |
| 25 to 44 Years | 201 (19.8%) | $73,098 |
| 45 to 64 Years | 360 (35.5%) | $82,212 |
| 65+ Years | 429 (42.3%) | $43,350 |
| Total | 1,014 (100.0%) | $63,864 |
Poverty in Madison
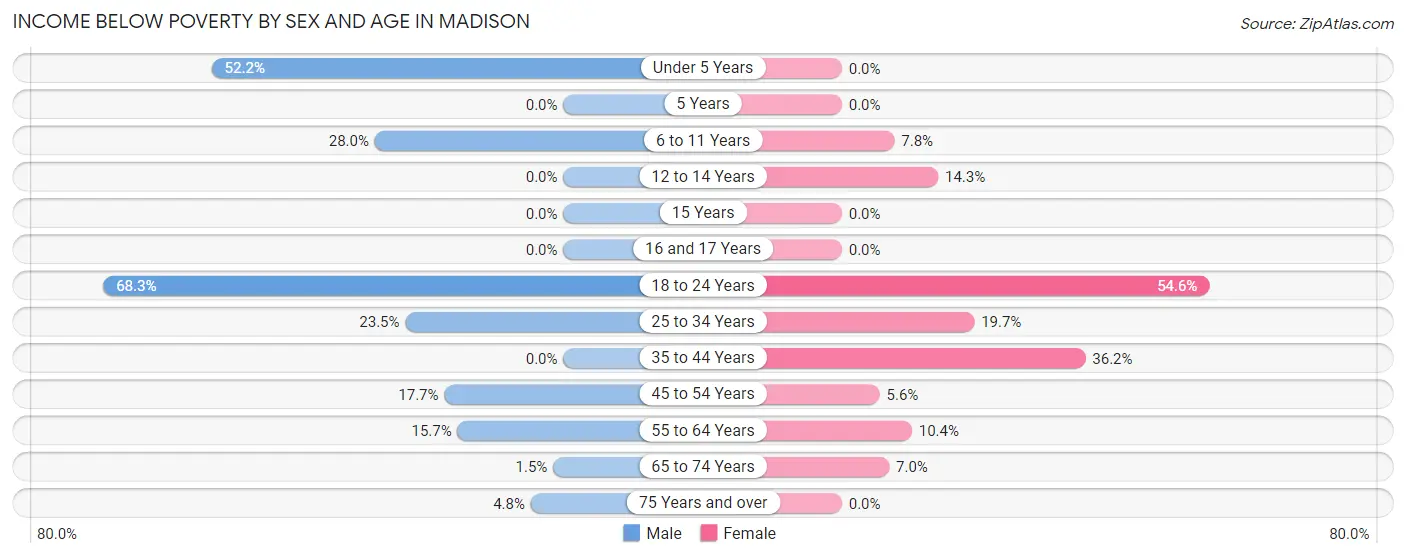
Income Below Poverty by Sex and Age in Madison
With 18.0% poverty level for males and 12.1% for females among the residents of Madison, 18 to 24 year old males and 18 to 24 year old females are the most vulnerable to poverty, with 69 males (68.3%) and 24 females (54.5%) in their respective age groups living below the poverty level.
| Age Bracket | Male | Female |
| Under 5 Years | 47 (52.2%) | 0 (0.0%) |
| 5 Years | 0 (0.0%) | 0 (0.0%) |
| 6 to 11 Years | 21 (28.0%) | 10 (7.8%) |
| 12 to 14 Years | 0 (0.0%) | 5 (14.3%) |
| 15 Years | 0 (0.0%) | 0 (0.0%) |
| 16 and 17 Years | 0 (0.0%) | 0 (0.0%) |
| 18 to 24 Years | 69 (68.3%) | 24 (54.5%) |
| 25 to 34 Years | 80 (23.5%) | 35 (19.7%) |
| 35 to 44 Years | 0 (0.0%) | 34 (36.2%) |
| 45 to 54 Years | 41 (17.7%) | 11 (5.6%) |
| 55 to 64 Years | 22 (15.7%) | 18 (10.4%) |
| 65 to 74 Years | 4 (1.5%) | 16 (7.0%) |
| 75 Years and over | 6 (4.8%) | 0 (0.0%) |
| Total | 290 (18.0%) | 153 (12.1%) |
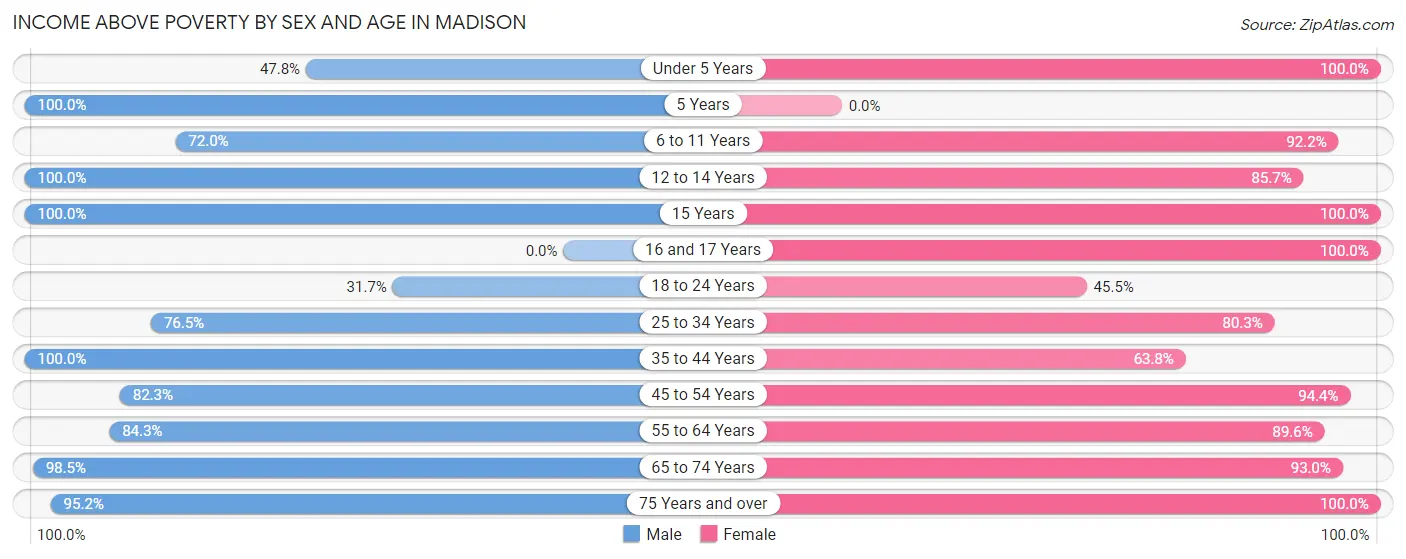
Income Above Poverty by Sex and Age in Madison
According to the poverty statistics in Madison, males aged 5 years and females aged under 5 years are the age groups that are most secure financially, with 100.0% of males and 100.0% of females in these age groups living above the poverty line.
| Age Bracket | Male | Female |
| Under 5 Years | 43 (47.8%) | 107 (100.0%) |
| 5 Years | 11 (100.0%) | 0 (0.0%) |
| 6 to 11 Years | 54 (72.0%) | 118 (92.2%) |
| 12 to 14 Years | 69 (100.0%) | 30 (85.7%) |
| 15 Years | 38 (100.0%) | 17 (100.0%) |
| 16 and 17 Years | 0 (0.0%) | 11 (100.0%) |
| 18 to 24 Years | 32 (31.7%) | 20 (45.5%) |
| 25 to 34 Years | 261 (76.5%) | 143 (80.3%) |
| 35 to 44 Years | 126 (100.0%) | 60 (63.8%) |
| 45 to 54 Years | 191 (82.3%) | 185 (94.4%) |
| 55 to 64 Years | 118 (84.3%) | 155 (89.6%) |
| 65 to 74 Years | 261 (98.5%) | 212 (93.0%) |
| 75 Years and over | 118 (95.2%) | 54 (100.0%) |
| Total | 1,322 (82.0%) | 1,112 (87.9%) |
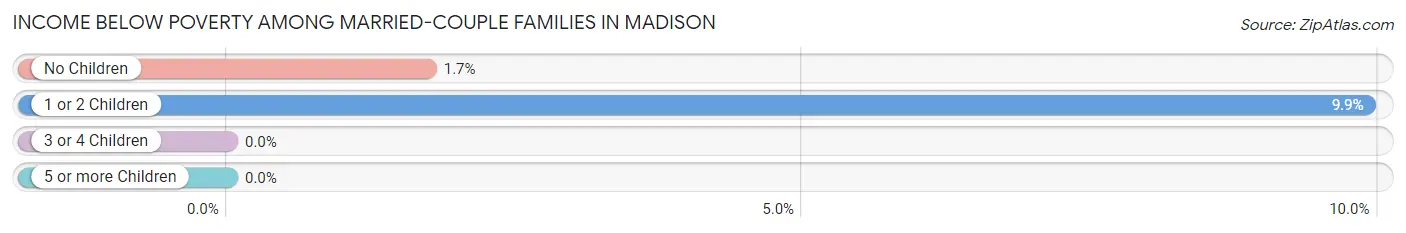
Income Below Poverty Among Married-Couple Families in Madison
The poverty statistics for married-couple families in Madison show that 4.3% or 25 of the total 578 families live below the poverty line. Families with 1 or 2 children have the highest poverty rate of 9.9%, comprising of 19 families. On the other hand, families with 3 or 4 children have the lowest poverty rate of 0.0%, which includes 0 families.
| Children | Above Poverty | Below Poverty |
| No Children | 340 (98.3%) | 6 (1.7%) |
| 1 or 2 Children | 173 (90.1%) | 19 (9.9%) |
| 3 or 4 Children | 40 (100.0%) | 0 (0.0%) |
| 5 or more Children | 0 (0.0%) | 0 (0.0%) |
| Total | 553 (95.7%) | 25 (4.3%) |
Income Below Poverty Among Single-Parent Households in Madison
According to the poverty data in Madison, 35.9% or 14 single-father households and 58.8% or 20 single-mother households are living below the poverty line. Among single-father households, those with 1 or 2 children have the highest poverty rate, with 14 households (48.3%) experiencing poverty. Likewise, among single-mother households, those with 3 or 4 children have the highest poverty rate, with 5 households (100.0%) falling below the poverty line.
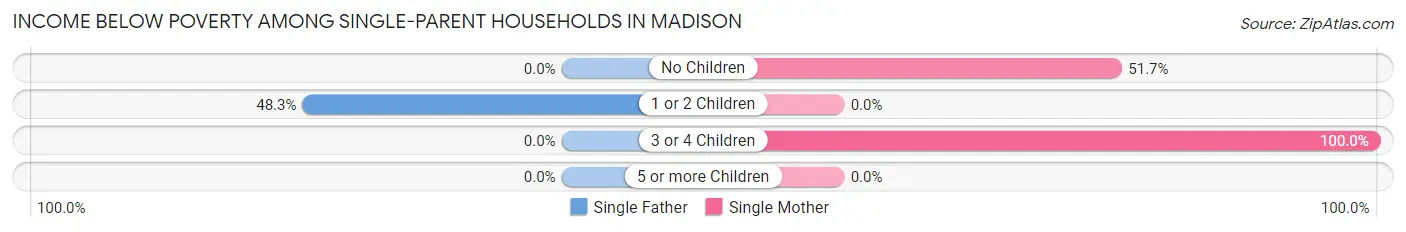
| Children | Single Father | Single Mother |
| No Children | 0 (0.0%) | 15 (51.7%) |
| 1 or 2 Children | 14 (48.3%) | 0 (0.0%) |
| 3 or 4 Children | 0 (0.0%) | 5 (100.0%) |
| 5 or more Children | 0 (0.0%) | 0 (0.0%) |
| Total | 14 (35.9%) | 20 (58.8%) |
Income Below Poverty Among Married-Couple vs Single-Parent Households in Madison
The poverty data for Madison shows that 25 of the married-couple family households (4.3%) and 34 of the single-parent households (46.6%) are living below the poverty level. Within the married-couple family households, those with 1 or 2 children have the highest poverty rate, with 19 households (9.9%) falling below the poverty line. Among the single-parent households, those with 3 or 4 children have the highest poverty rate, with 5 household (100.0%) living below poverty.
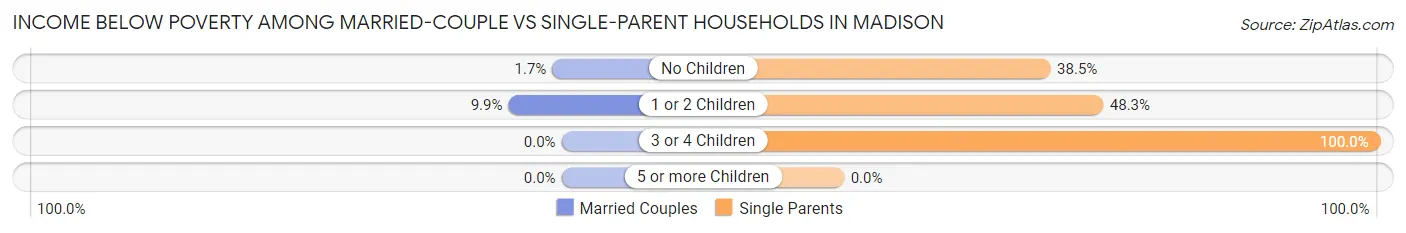
| Children | Married-Couple Families | Single-Parent Households |
| No Children | 6 (1.7%) | 15 (38.5%) |
| 1 or 2 Children | 19 (9.9%) | 14 (48.3%) |
| 3 or 4 Children | 0 (0.0%) | 5 (100.0%) |
| 5 or more Children | 0 (0.0%) | 0 (0.0%) |
| Total | 25 (4.3%) | 34 (46.6%) |
Race in Madison
The most populous races in Madison are White / Caucasian (2,760 | 95.8%), Two or more Races (74 | 2.6%), and Asian (26 | 0.9%).
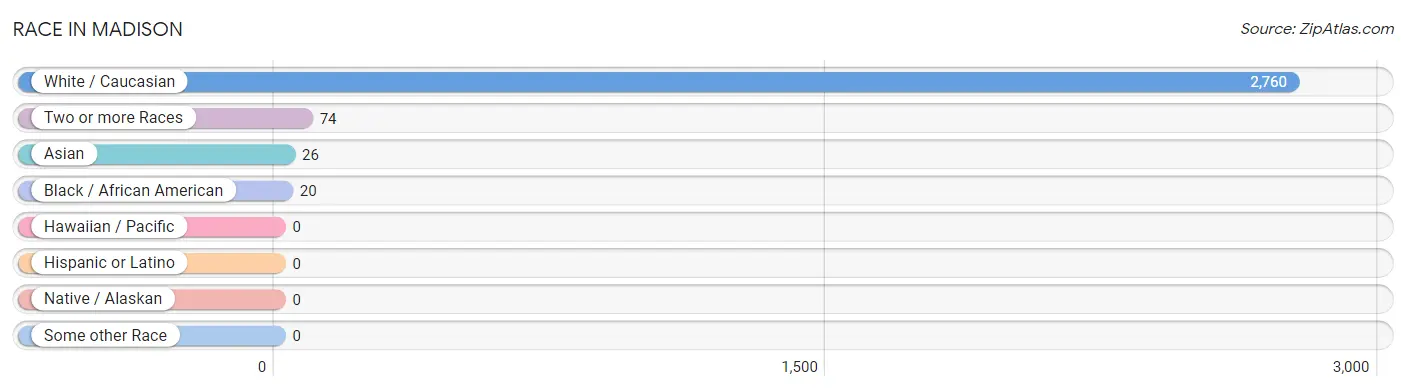
| Race | # Population | % Population |
| Asian | 26 | 0.9% |
| Black / African American | 20 | 0.7% |
| Hawaiian / Pacific | 0 | 0.0% |
| Hispanic or Latino | 0 | 0.0% |
| Native / Alaskan | 0 | 0.0% |
| White / Caucasian | 2,760 | 95.8% |
| Two or more Races | 74 | 2.6% |
| Some other Race | 0 | 0.0% |
| Total | 2,880 | 100.0% |
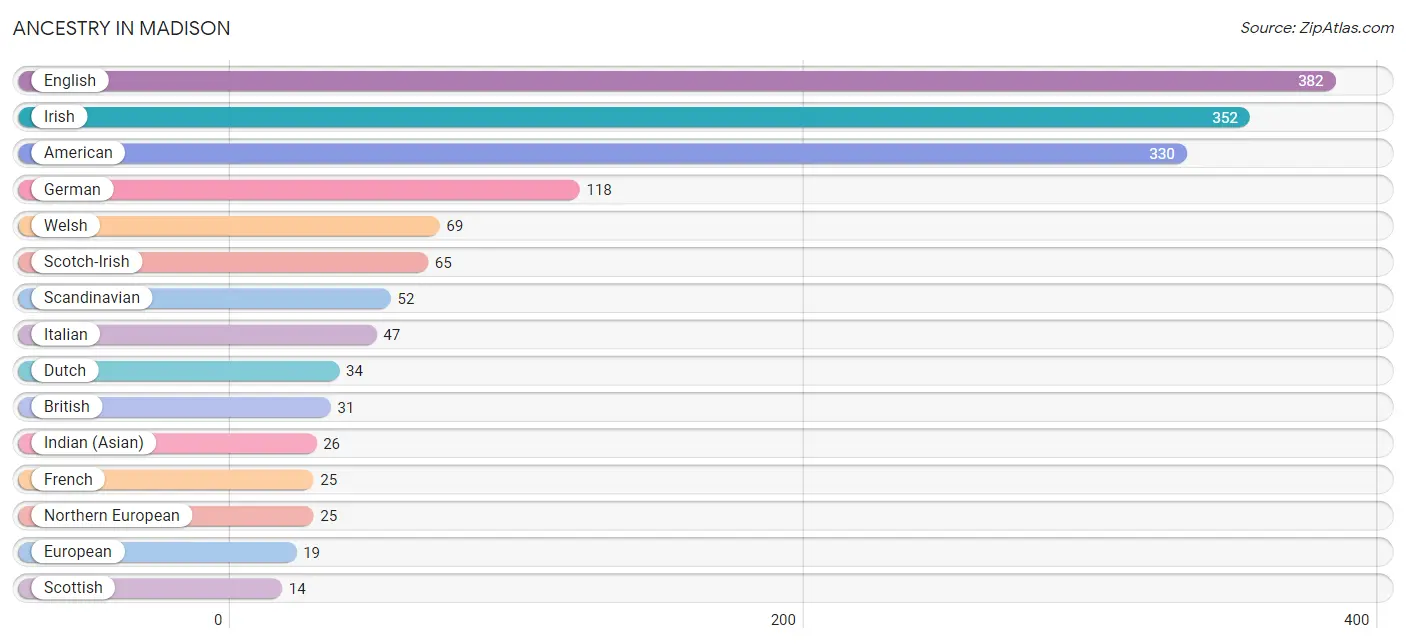
Ancestry in Madison
The most populous ancestries reported in Madison are English (382 | 13.3%), Irish (352 | 12.2%), American (330 | 11.5%), German (118 | 4.1%), and Welsh (69 | 2.4%), together accounting for 43.4% of all Madison residents.
| Ancestry | # Population | % Population |
| American | 330 | 11.5% |
| British | 31 | 1.1% |
| Dutch | 34 | 1.2% |
| English | 382 | 13.3% |
| European | 19 | 0.7% |
| French | 25 | 0.9% |
| German | 118 | 4.1% |
| Greek | 1 | 0.0% |
| Indian (Asian) | 26 | 0.9% |
| Irish | 352 | 12.2% |
| Italian | 47 | 1.6% |
| Northern European | 25 | 0.9% |
| Scandinavian | 52 | 1.8% |
| Scotch-Irish | 65 | 2.3% |
| Scottish | 14 | 0.5% |
| Welsh | 69 | 2.4% | View All 16 Rows |
Immigrants in Madison
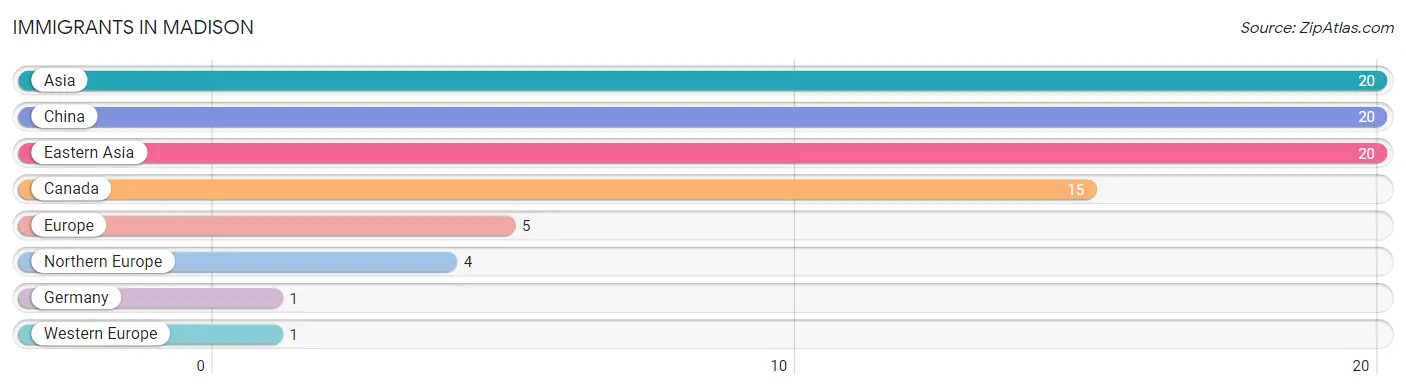
The most numerous immigrant groups reported in Madison came from Asia (20 | 0.7%), China (20 | 0.7%), Eastern Asia (20 | 0.7%), Canada (15 | 0.5%), and Europe (5 | 0.2%), together accounting for 2.8% of all Madison residents.
| Immigration Origin | # Population | % Population |
| Asia | 20 | 0.7% |
| Canada | 15 | 0.5% |
| China | 20 | 0.7% |
| Eastern Asia | 20 | 0.7% |
| Europe | 5 | 0.2% |
| Germany | 1 | 0.0% |
| Northern Europe | 4 | 0.1% |
| Western Europe | 1 | 0.0% | View All 8 Rows |
Sex and Age in Madison
Sex and Age in Madison
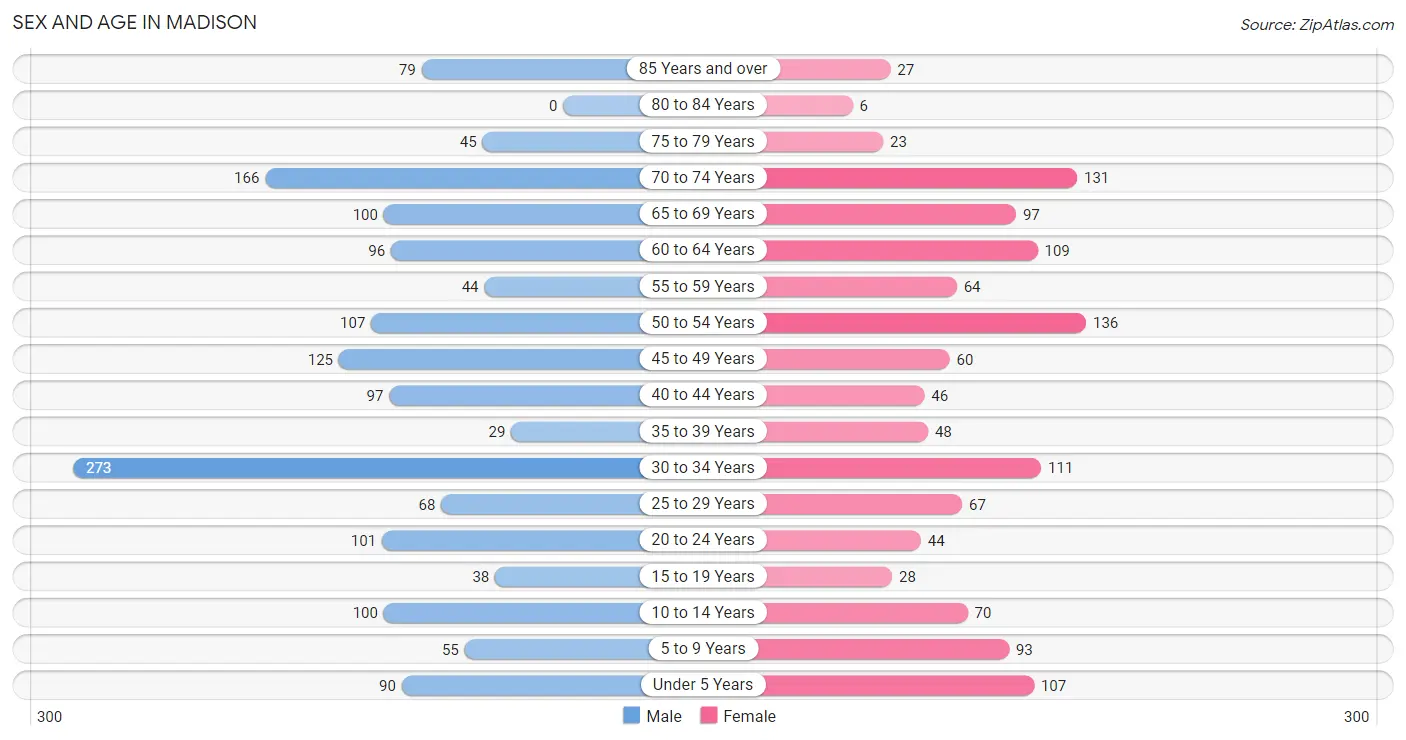
The most populous age groups in Madison are 30 to 34 Years (273 | 16.9%) for men and 50 to 54 Years (136 | 10.7%) for women.
| Age Bracket | Male | Female |
| Under 5 Years | 90 (5.6%) | 107 (8.5%) |
| 5 to 9 Years | 55 (3.4%) | 93 (7.3%) |
| 10 to 14 Years | 100 (6.2%) | 70 (5.5%) |
| 15 to 19 Years | 38 (2.4%) | 28 (2.2%) |
| 20 to 24 Years | 101 (6.3%) | 44 (3.5%) |
| 25 to 29 Years | 68 (4.2%) | 67 (5.3%) |
| 30 to 34 Years | 273 (16.9%) | 111 (8.8%) |
| 35 to 39 Years | 29 (1.8%) | 48 (3.8%) |
| 40 to 44 Years | 97 (6.0%) | 46 (3.6%) |
| 45 to 49 Years | 125 (7.7%) | 60 (4.7%) |
| 50 to 54 Years | 107 (6.6%) | 136 (10.7%) |
| 55 to 59 Years | 44 (2.7%) | 64 (5.1%) |
| 60 to 64 Years | 96 (5.9%) | 109 (8.6%) |
| 65 to 69 Years | 100 (6.2%) | 97 (7.7%) |
| 70 to 74 Years | 166 (10.3%) | 131 (10.3%) |
| 75 to 79 Years | 45 (2.8%) | 23 (1.8%) |
| 80 to 84 Years | 0 (0.0%) | 6 (0.5%) |
| 85 Years and over | 79 (4.9%) | 27 (2.1%) |
| Total | 1,613 (100.0%) | 1,267 (100.0%) |
Families and Households in Madison
Median Family Size in Madison
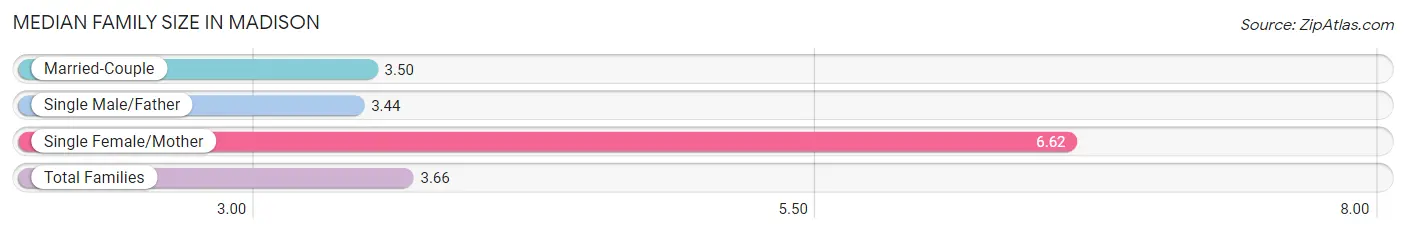
The median family size in Madison is 3.66 persons per family, with single female/mother families (34 | 5.2%) accounting for the largest median family size of 6.62 persons per family. On the other hand, single male/father families (39 | 6.0%) represent the smallest median family size with 3.44 persons per family.
| Family Type | # Families | Family Size |
| Married-Couple | 578 (88.8%) | 3.50 |
| Single Male/Father | 39 (6.0%) | 3.44 |
| Single Female/Mother | 34 (5.2%) | 6.62 |
| Total Families | 651 (100.0%) | 3.66 |
Median Household Size in Madison
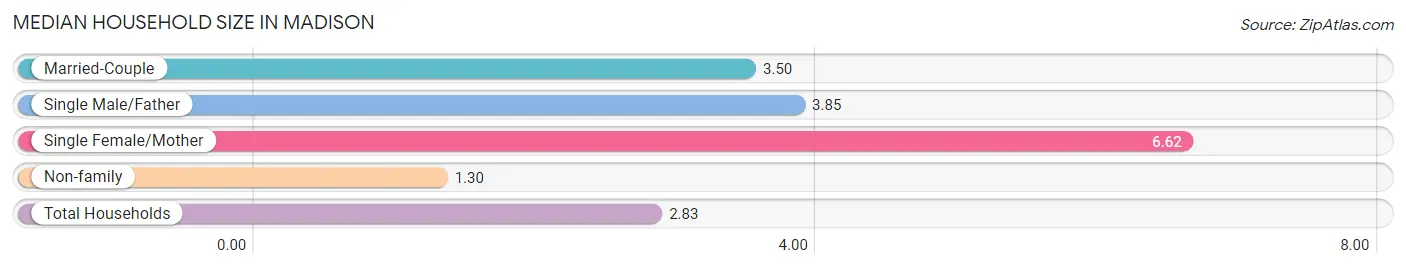
The median household size in Madison is 2.83 persons per household, with single female/mother households (34 | 3.4%) accounting for the largest median household size of 6.62 persons per household. non-family households (363 | 35.8%) represent the smallest median household size with 1.30 persons per household.
| Household Type | # Households | Household Size |
| Married-Couple | 578 (57.0%) | 3.50 |
| Single Male/Father | 39 (3.8%) | 3.85 |
| Single Female/Mother | 34 (3.4%) | 6.62 |
| Non-family | 363 (35.8%) | 1.30 |
| Total Households | 1,014 (100.0%) | 2.83 |
Household Size by Marriage Status in Madison
Out of a total of 1,014 households in Madison, 651 (64.2%) are family households, while 363 (35.8%) are nonfamily households. The most numerous type of family households are 2-person households, comprising 311, and the most common type of nonfamily households are 1-person households, comprising 306.
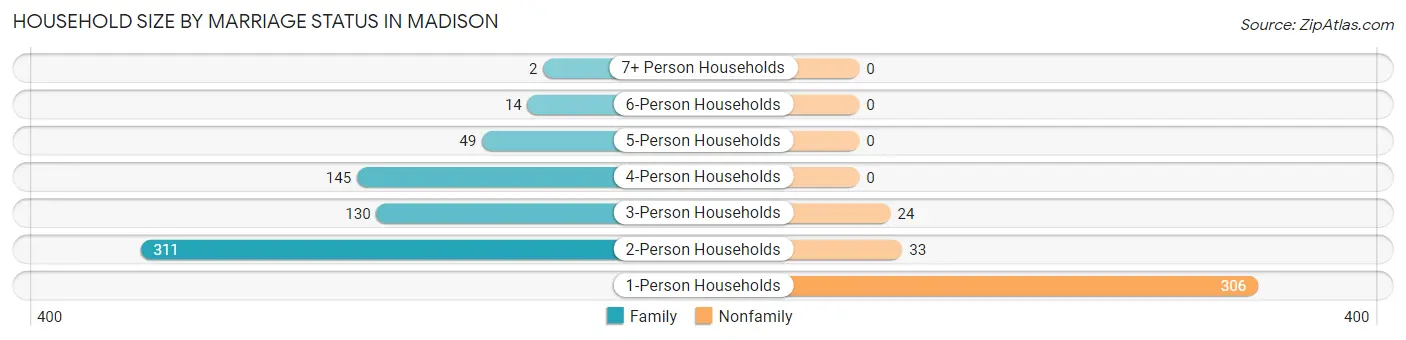
| Household Size | Family Households | Nonfamily Households |
| 1-Person Households | - | 306 (30.2%) |
| 2-Person Households | 311 (30.7%) | 33 (3.3%) |
| 3-Person Households | 130 (12.8%) | 24 (2.4%) |
| 4-Person Households | 145 (14.3%) | 0 (0.0%) |
| 5-Person Households | 49 (4.8%) | 0 (0.0%) |
| 6-Person Households | 14 (1.4%) | 0 (0.0%) |
| 7+ Person Households | 2 (0.2%) | 0 (0.0%) |
| Total | 651 (64.2%) | 363 (35.8%) |
Female Fertility in Madison
Fertility by Age in Madison
Average fertility rate in Madison is 12.0 births per 1,000 women. Women in the age bracket of 35 to 50 years have the highest fertility rate with 29.0 births per 1,000 women. Women in the age bracket of 35 to 50 years acount for 100.0% of all women with births.
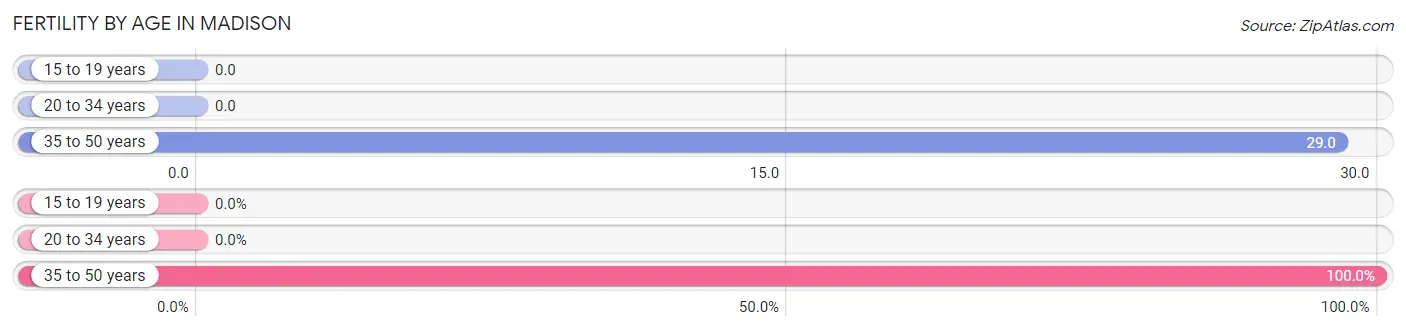
| Age Bracket | Women with Births | Births / 1,000 Women |
| 15 to 19 years | 0 (0.0%) | 0.0 |
| 20 to 34 years | 0 (0.0%) | 0.0 |
| 35 to 50 years | 5 (100.0%) | 29.0 |
| Total | 5 (100.0%) | 12.0 |
Fertility by Age by Marriage Status in Madison
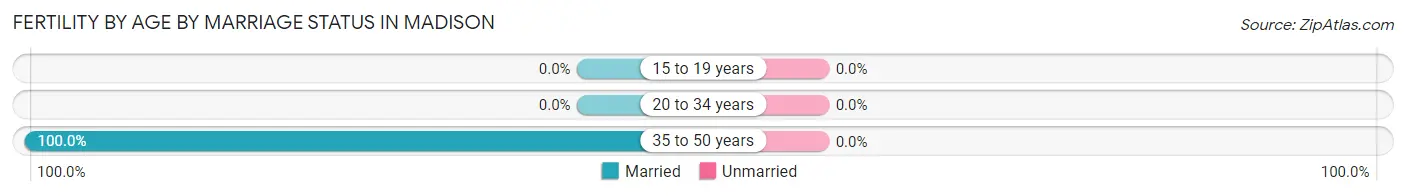
| Age Bracket | Married | Unmarried |
| 15 to 19 years | 0 (0.0%) | 0 (0.0%) |
| 20 to 34 years | 0 (0.0%) | 0 (0.0%) |
| 35 to 50 years | 5 (100.0%) | 0 (0.0%) |
| Total | 5 (100.0%) | 0 (0.0%) |
Fertility by Education in Madison
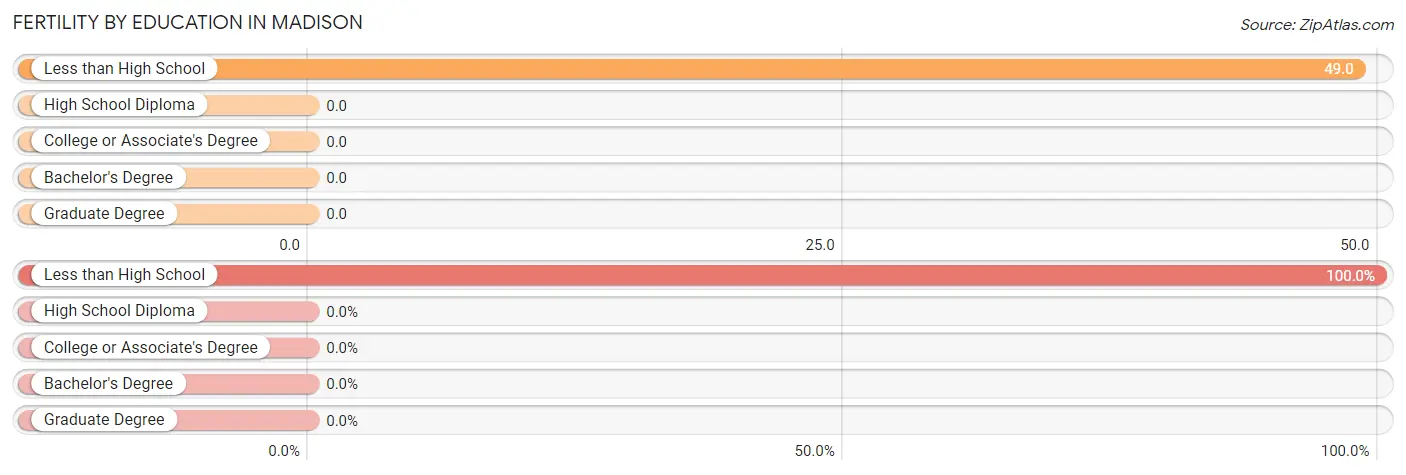
| Educational Attainment | Women with Births | Births / 1,000 Women |
| Less than High School | 5 (100.0%) | 49.0 |
| High School Diploma | 0 (0.0%) | 0.0 |
| College or Associate's Degree | 0 (0.0%) | 0.0 |
| Bachelor's Degree | 0 (0.0%) | 0.0 |
| Graduate Degree | 0 (0.0%) | 0.0 |
| Total | 5 (100.0%) | 12.0 |
Fertility by Education by Marriage Status in Madison
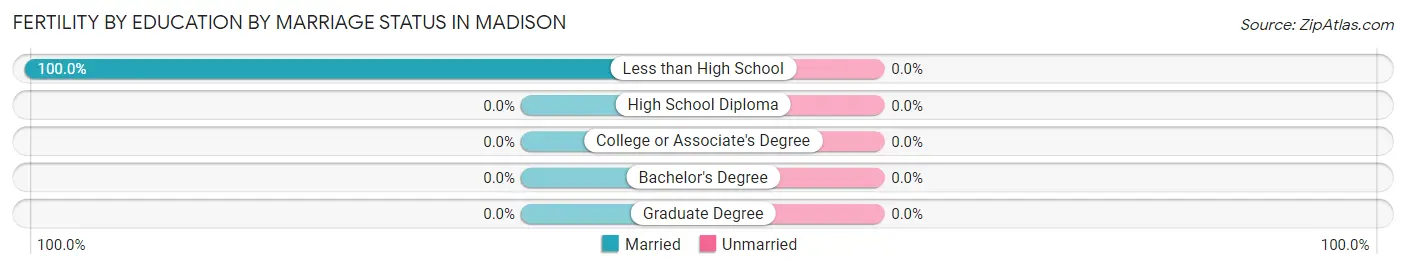
| Educational Attainment | Married | Unmarried |
| Less than High School | 5 (100.0%) | 0 (0.0%) |
| High School Diploma | 0 (0.0%) | 0 (0.0%) |
| College or Associate's Degree | 0 (0.0%) | 0 (0.0%) |
| Bachelor's Degree | 0 (0.0%) | 0 (0.0%) |
| Graduate Degree | 0 (0.0%) | 0 (0.0%) |
| Total | 5 (100.0%) | 0 (0.0%) |
Employment Characteristics in Madison
Employment by Class of Employer in Madison
Among the 1,154 employed individuals in Madison, private company employees (843 | 73.1%), local government employees (197 | 17.1%), and not-for-profit organizations (41 | 3.5%) make up the most common classes of employment.
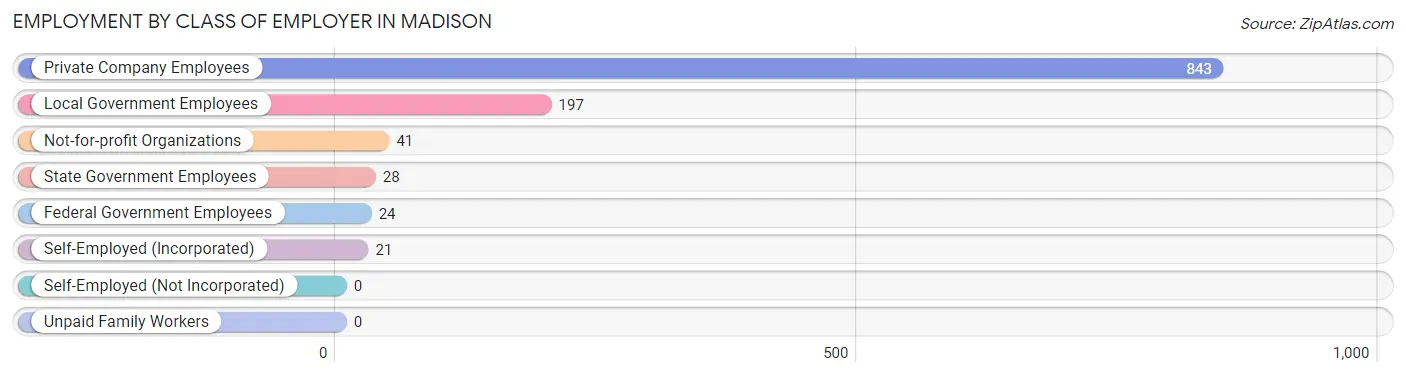
| Employer Class | # Employees | % Employees |
| Private Company Employees | 843 | 73.1% |
| Self-Employed (Incorporated) | 21 | 1.8% |
| Self-Employed (Not Incorporated) | 0 | 0.0% |
| Not-for-profit Organizations | 41 | 3.5% |
| Local Government Employees | 197 | 17.1% |
| State Government Employees | 28 | 2.4% |
| Federal Government Employees | 24 | 2.1% |
| Unpaid Family Workers | 0 | 0.0% |
| Total | 1,154 | 100.0% |
Employment Status by Age in Madison
According to the labor force statistics for Madison, out of the total population over 16 years of age (2,310), 55.8% or 1,289 individuals are in the labor force, with 10.5% or 135 of them unemployed. The age group with the highest labor force participation rate is 25 to 29 years, with 84.4% or 114 individuals in the labor force. Within the labor force, the 45 to 54 years age range has the highest percentage of unemployed individuals, with 27.3% or 87 of them being unemployed.
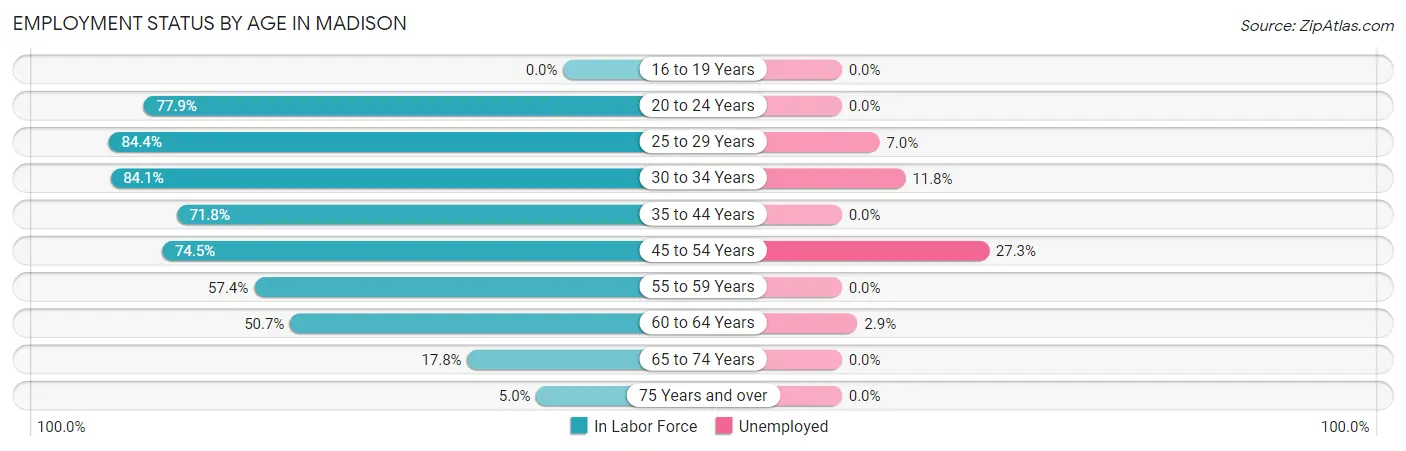
| Age Bracket | In Labor Force | Unemployed |
| 16 to 19 Years | 0 (0.0%) | 0 (0.0%) |
| 20 to 24 Years | 113 (77.9%) | 0 (0.0%) |
| 25 to 29 Years | 114 (84.4%) | 8 (7.0%) |
| 30 to 34 Years | 323 (84.1%) | 38 (11.8%) |
| 35 to 44 Years | 158 (71.8%) | 0 (0.0%) |
| 45 to 54 Years | 319 (74.5%) | 87 (27.3%) |
| 55 to 59 Years | 62 (57.4%) | 0 (0.0%) |
| 60 to 64 Years | 104 (50.7%) | 3 (2.9%) |
| 65 to 74 Years | 88 (17.8%) | 0 (0.0%) |
| 75 Years and over | 9 (5.0%) | 0 (0.0%) |
| Total | 1,289 (55.8%) | 135 (10.5%) |
Employment Status by Educational Attainment in Madison
According to labor force statistics for Madison, 73.0% of individuals (1,080) out of the total population between 25 and 64 years of age (1,480) are in the labor force, with 12.6% or 136 of them being unemployed. The group with the highest labor force participation rate are those with the educational attainment of bachelor's degree or higher, with 85.4% or 204 individuals in the labor force. Within the labor force, individuals with high school diploma education have the highest percentage of unemployment, with 25.1% or 83 of them being unemployed.
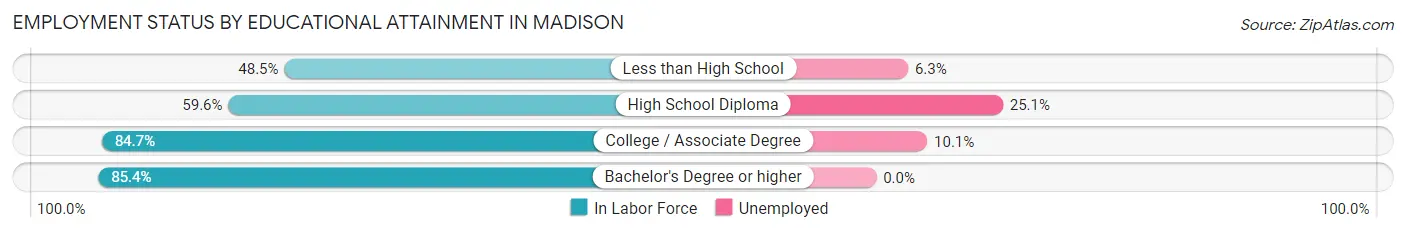
| Educational Attainment | In Labor Force | Unemployed |
| Less than High School | 48 (48.5%) | 6 (6.3%) |
| High School Diploma | 331 (59.6%) | 139 (25.1%) |
| College / Associate Degree | 497 (84.7%) | 59 (10.1%) |
| Bachelor's Degree or higher | 204 (85.4%) | 0 (0.0%) |
| Total | 1,080 (73.0%) | 186 (12.6%) |
Employment Occupations by Sex in Madison
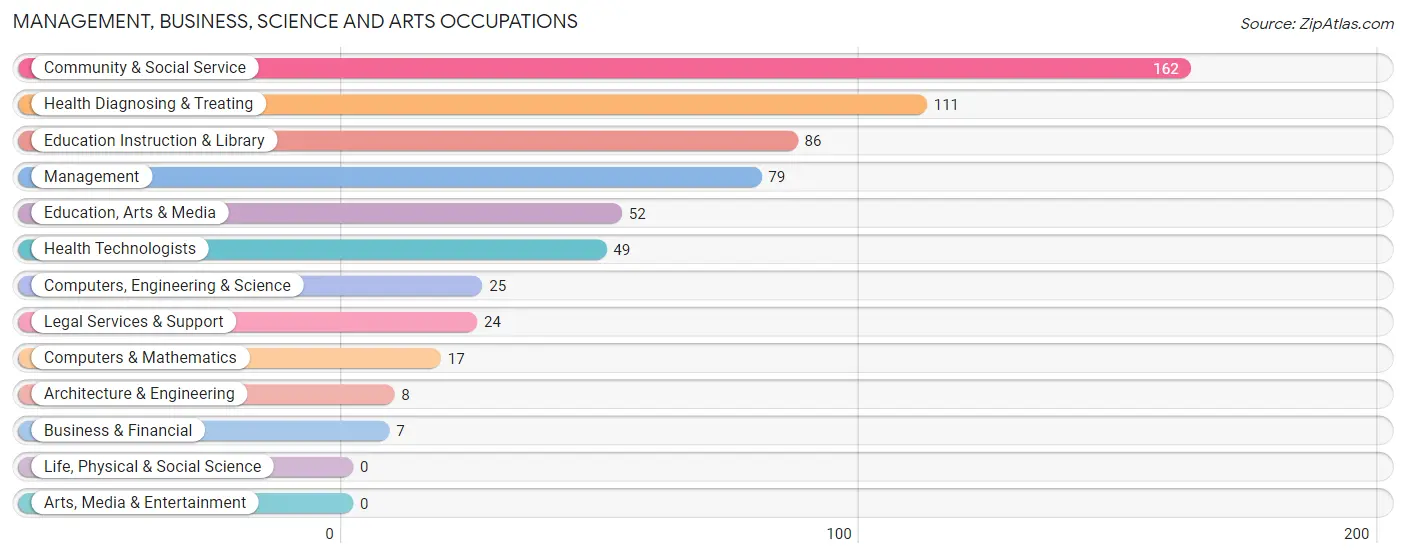
Management, Business, Science and Arts Occupations
The most common Management, Business, Science and Arts occupations in Madison are Community & Social Service (162 | 14.0%), Health Diagnosing & Treating (111 | 9.6%), Education Instruction & Library (86 | 7.4%), Management (79 | 6.9%), and Education, Arts & Media (52 | 4.5%).
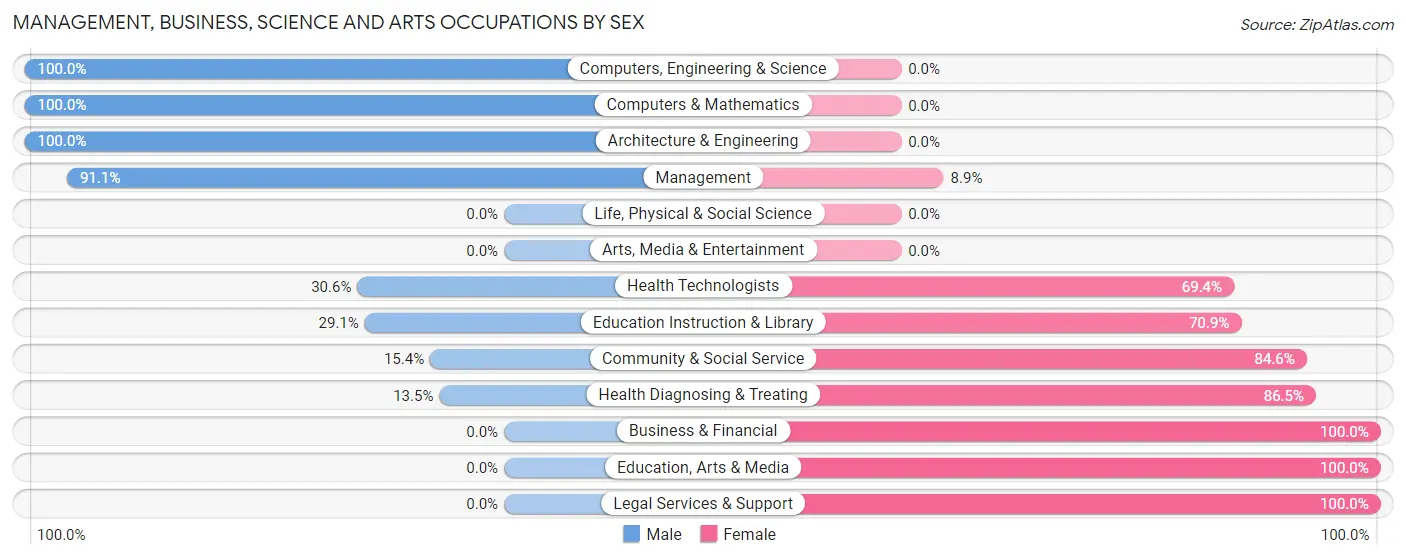
Management, Business, Science and Arts Occupations by Sex
Within the Management, Business, Science and Arts occupations in Madison, the most male-oriented occupations are Computers, Engineering & Science (100.0%), Computers & Mathematics (100.0%), and Architecture & Engineering (100.0%), while the most female-oriented occupations are Business & Financial (100.0%), Education, Arts & Media (100.0%), and Legal Services & Support (100.0%).
| Occupation | Male | Female |
| Management | 72 (91.1%) | 7 (8.9%) |
| Business & Financial | 0 (0.0%) | 7 (100.0%) |
| Computers, Engineering & Science | 25 (100.0%) | 0 (0.0%) |
| Computers & Mathematics | 17 (100.0%) | 0 (0.0%) |
| Architecture & Engineering | 8 (100.0%) | 0 (0.0%) |
| Life, Physical & Social Science | 0 (0.0%) | 0 (0.0%) |
| Community & Social Service | 25 (15.4%) | 137 (84.6%) |
| Education, Arts & Media | 0 (0.0%) | 52 (100.0%) |
| Legal Services & Support | 0 (0.0%) | 24 (100.0%) |
| Education Instruction & Library | 25 (29.1%) | 61 (70.9%) |
| Arts, Media & Entertainment | 0 (0.0%) | 0 (0.0%) |
| Health Diagnosing & Treating | 15 (13.5%) | 96 (86.5%) |
| Health Technologists | 15 (30.6%) | 34 (69.4%) |
| Total (Category) | 137 (35.7%) | 247 (64.3%) |
| Total (Overall) | 700 (60.7%) | 454 (39.3%) |
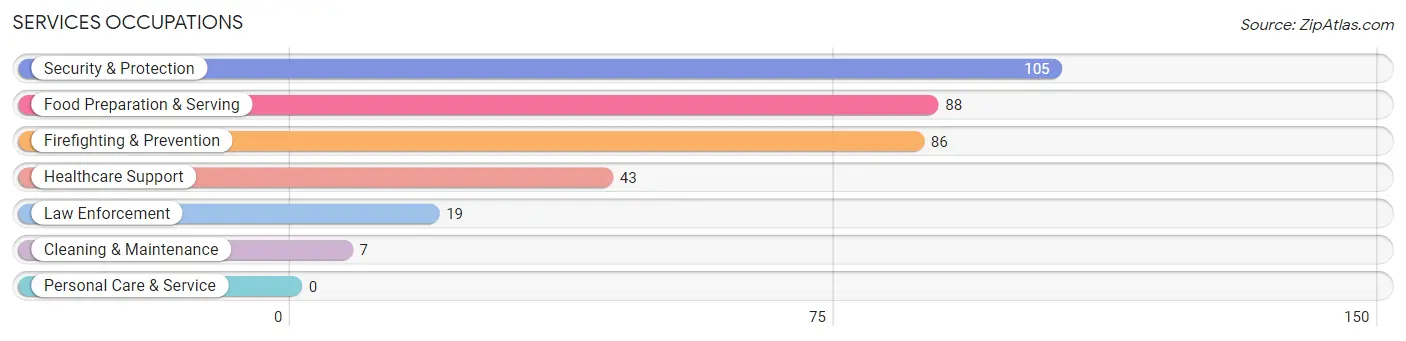
Services Occupations
The most common Services occupations in Madison are Security & Protection (105 | 9.1%), Food Preparation & Serving (88 | 7.6%), Firefighting & Prevention (86 | 7.4%), Healthcare Support (43 | 3.7%), and Law Enforcement (19 | 1.7%).
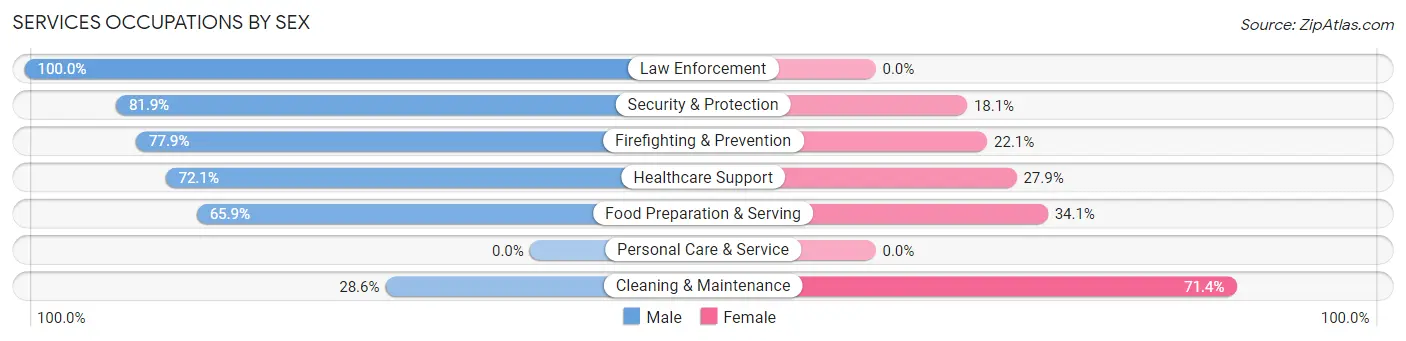
Services Occupations by Sex
Within the Services occupations in Madison, the most male-oriented occupations are Law Enforcement (100.0%), Security & Protection (81.9%), and Firefighting & Prevention (77.9%), while the most female-oriented occupations are Cleaning & Maintenance (71.4%), Food Preparation & Serving (34.1%), and Healthcare Support (27.9%).
| Occupation | Male | Female |
| Healthcare Support | 31 (72.1%) | 12 (27.9%) |
| Security & Protection | 86 (81.9%) | 19 (18.1%) |
| Firefighting & Prevention | 67 (77.9%) | 19 (22.1%) |
| Law Enforcement | 19 (100.0%) | 0 (0.0%) |
| Food Preparation & Serving | 58 (65.9%) | 30 (34.1%) |
| Cleaning & Maintenance | 2 (28.6%) | 5 (71.4%) |
| Personal Care & Service | 0 (0.0%) | 0 (0.0%) |
| Total (Category) | 177 (72.8%) | 66 (27.2%) |
| Total (Overall) | 700 (60.7%) | 454 (39.3%) |
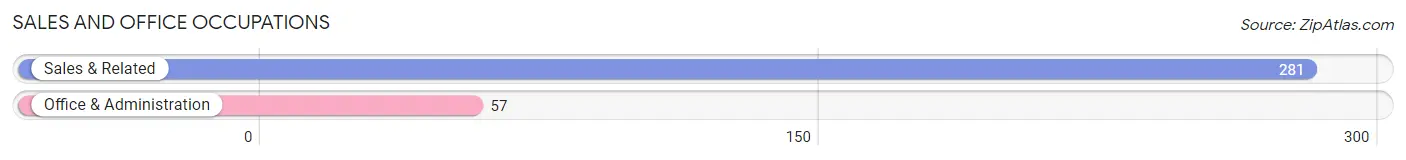
Sales and Office Occupations
The most common Sales and Office occupations in Madison are Sales & Related (281 | 24.3%), and Office & Administration (57 | 4.9%).
Sales and Office Occupations by Sex
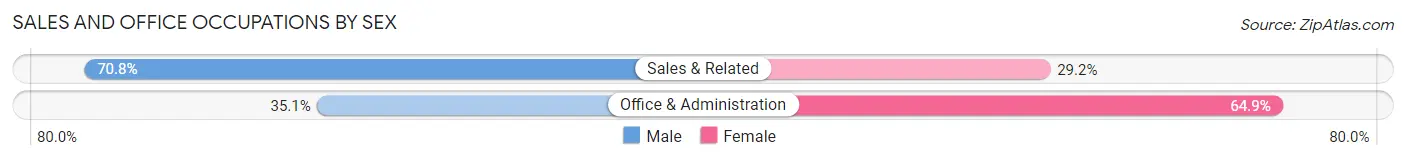
| Occupation | Male | Female |
| Sales & Related | 199 (70.8%) | 82 (29.2%) |
| Office & Administration | 20 (35.1%) | 37 (64.9%) |
| Total (Category) | 219 (64.8%) | 119 (35.2%) |
| Total (Overall) | 700 (60.7%) | 454 (39.3%) |
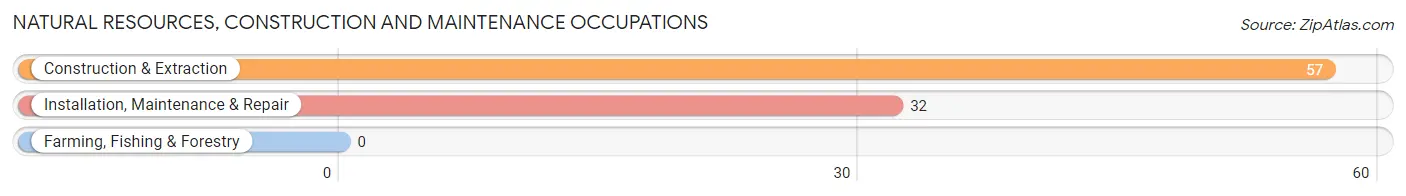
Natural Resources, Construction and Maintenance Occupations
The most common Natural Resources, Construction and Maintenance occupations in Madison are Construction & Extraction (57 | 4.9%), and Installation, Maintenance & Repair (32 | 2.8%).
Natural Resources, Construction and Maintenance Occupations by Sex
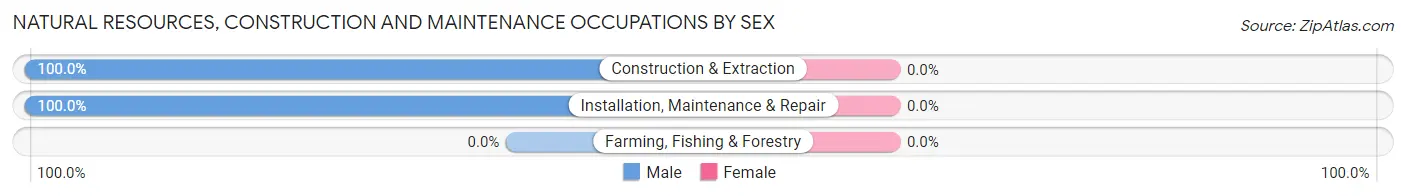
| Occupation | Male | Female |
| Farming, Fishing & Forestry | 0 (0.0%) | 0 (0.0%) |
| Construction & Extraction | 57 (100.0%) | 0 (0.0%) |
| Installation, Maintenance & Repair | 32 (100.0%) | 0 (0.0%) |
| Total (Category) | 89 (100.0%) | 0 (0.0%) |
| Total (Overall) | 700 (60.7%) | 454 (39.3%) |
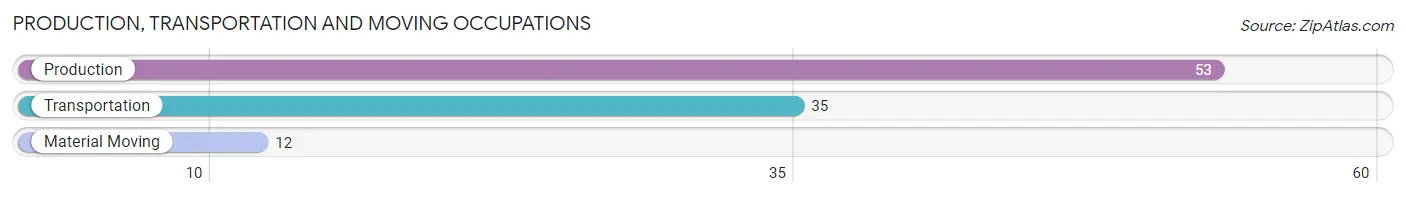
Production, Transportation and Moving Occupations
The most common Production, Transportation and Moving occupations in Madison are Production (53 | 4.6%), Transportation (35 | 3.0%), and Material Moving (12 | 1.0%).
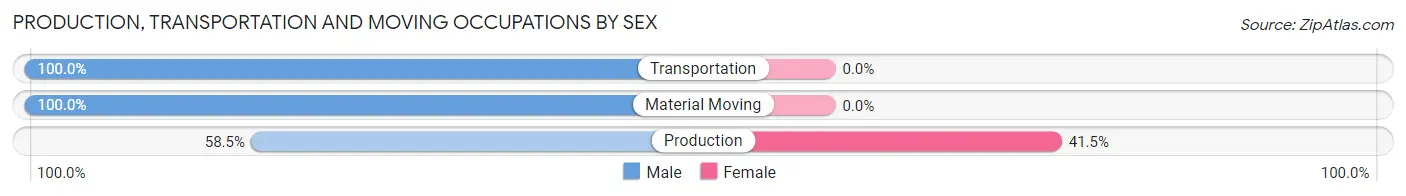
Production, Transportation and Moving Occupations by Sex
| Occupation | Male | Female |
| Production | 31 (58.5%) | 22 (41.5%) |
| Transportation | 35 (100.0%) | 0 (0.0%) |
| Material Moving | 12 (100.0%) | 0 (0.0%) |
| Total (Category) | 78 (78.0%) | 22 (22.0%) |
| Total (Overall) | 700 (60.7%) | 454 (39.3%) |
Employment Industries by Sex in Madison
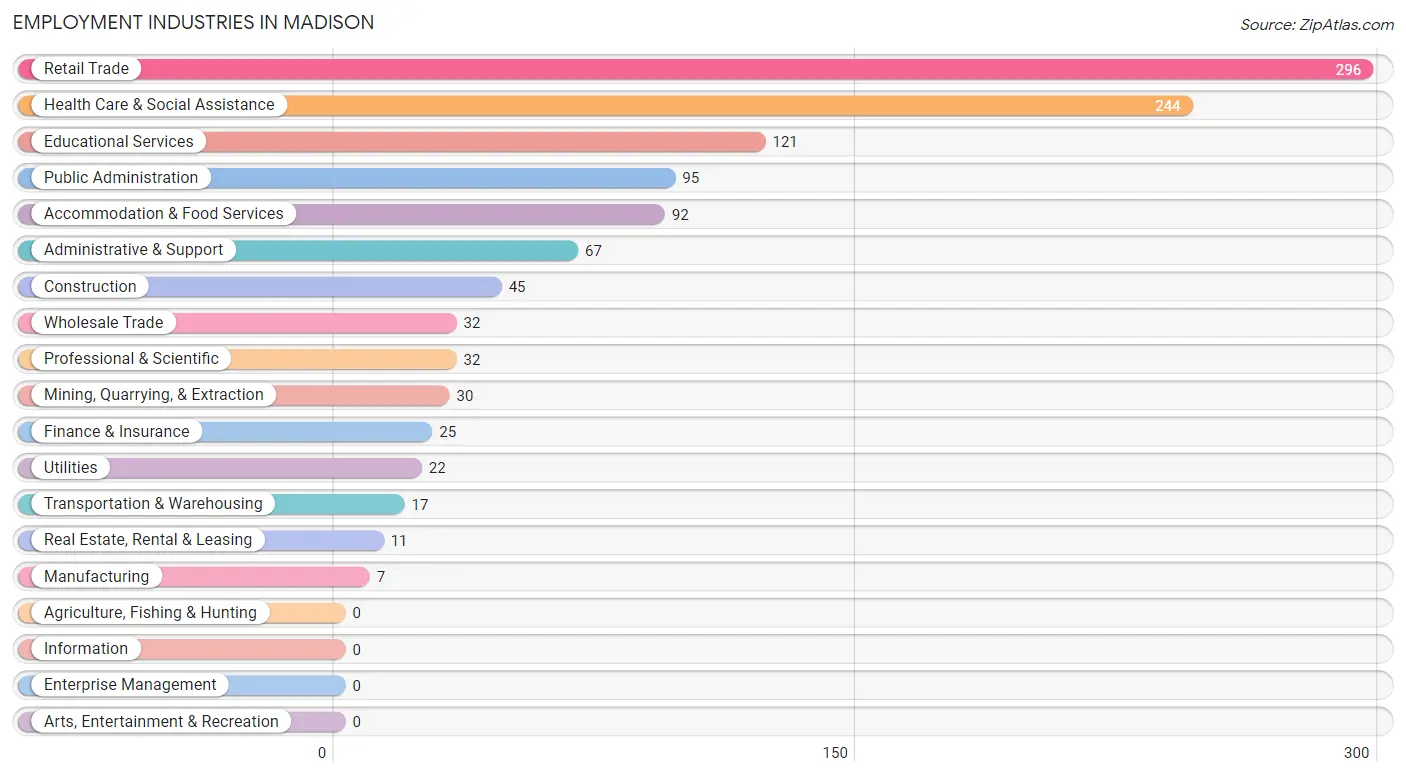
Employment Industries in Madison
The major employment industries in Madison include Retail Trade (296 | 25.7%), Health Care & Social Assistance (244 | 21.1%), Educational Services (121 | 10.5%), Public Administration (95 | 8.2%), and Accommodation & Food Services (92 | 8.0%).
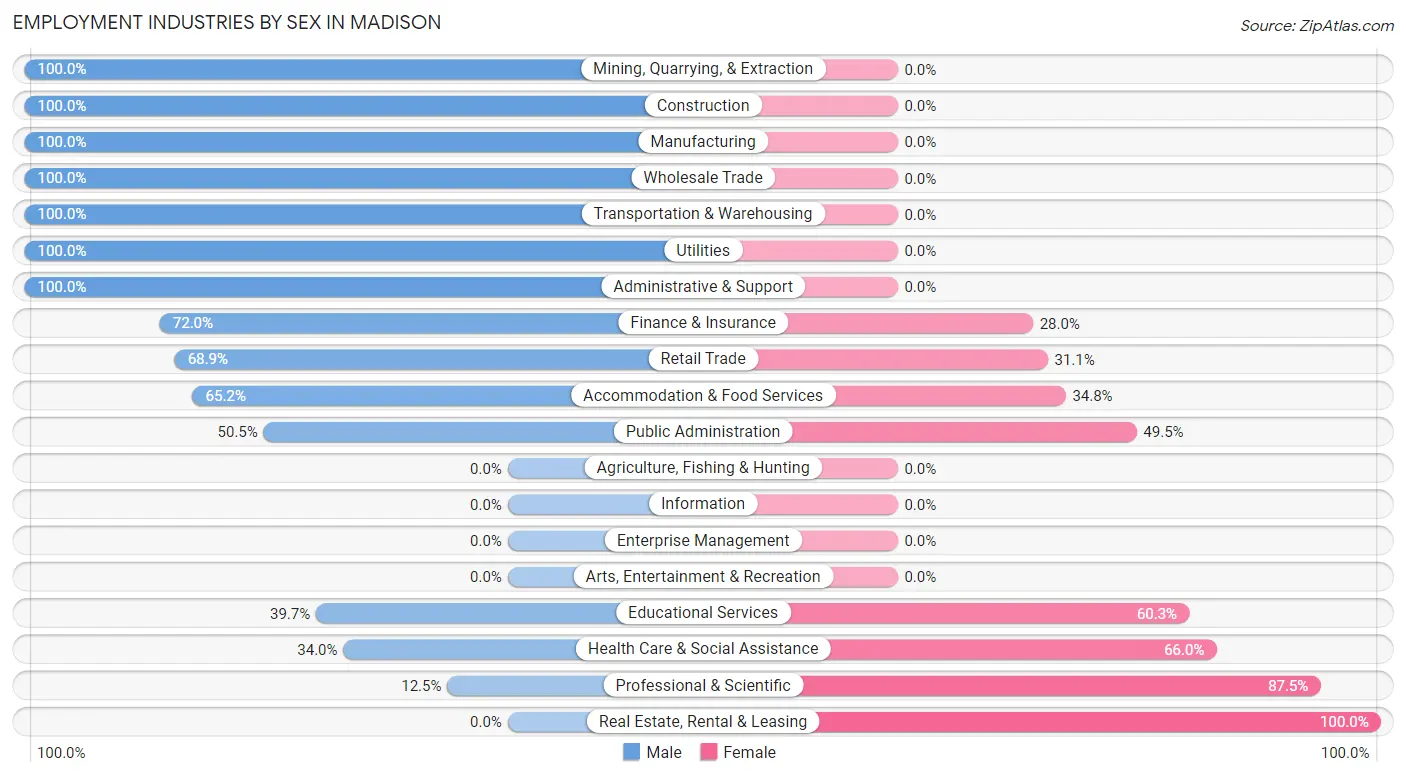
Employment Industries by Sex in Madison
The Madison industries that see more men than women are Mining, Quarrying, & Extraction (100.0%), Construction (100.0%), and Manufacturing (100.0%), whereas the industries that tend to have a higher number of women are Real Estate, Rental & Leasing (100.0%), Professional & Scientific (87.5%), and Health Care & Social Assistance (66.0%).
| Industry | Male | Female |
| Agriculture, Fishing & Hunting | 0 (0.0%) | 0 (0.0%) |
| Mining, Quarrying, & Extraction | 30 (100.0%) | 0 (0.0%) |
| Construction | 45 (100.0%) | 0 (0.0%) |
| Manufacturing | 7 (100.0%) | 0 (0.0%) |
| Wholesale Trade | 32 (100.0%) | 0 (0.0%) |
| Retail Trade | 204 (68.9%) | 92 (31.1%) |
| Transportation & Warehousing | 17 (100.0%) | 0 (0.0%) |
| Utilities | 22 (100.0%) | 0 (0.0%) |
| Information | 0 (0.0%) | 0 (0.0%) |
| Finance & Insurance | 18 (72.0%) | 7 (28.0%) |
| Real Estate, Rental & Leasing | 0 (0.0%) | 11 (100.0%) |
| Professional & Scientific | 4 (12.5%) | 28 (87.5%) |
| Enterprise Management | 0 (0.0%) | 0 (0.0%) |
| Administrative & Support | 67 (100.0%) | 0 (0.0%) |
| Educational Services | 48 (39.7%) | 73 (60.3%) |
| Health Care & Social Assistance | 83 (34.0%) | 161 (66.0%) |
| Arts, Entertainment & Recreation | 0 (0.0%) | 0 (0.0%) |
| Accommodation & Food Services | 60 (65.2%) | 32 (34.8%) |
| Public Administration | 48 (50.5%) | 47 (49.5%) |
| Total | 700 (60.7%) | 454 (39.3%) |
Education in Madison
School Enrollment in Madison
The most common levels of schooling among the 459 students in Madison are middle school (167 | 36.4%), elementary school (137 | 29.8%), and high school (54 | 11.8%).
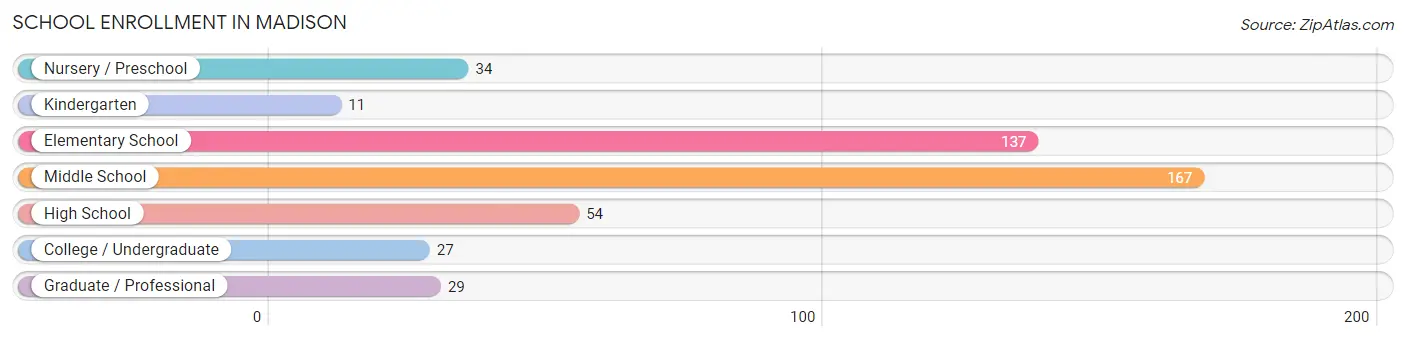
| School Level | # Students | % Students |
| Nursery / Preschool | 34 | 7.4% |
| Kindergarten | 11 | 2.4% |
| Elementary School | 137 | 29.8% |
| Middle School | 167 | 36.4% |
| High School | 54 | 11.8% |
| College / Undergraduate | 27 | 5.9% |
| Graduate / Professional | 29 | 6.3% |
| Total | 459 | 100.0% |
School Enrollment by Age by Funding Source in Madison
Out of a total of 459 students who are enrolled in schools in Madison, 37 (8.1%) attend a private institution, while the remaining 422 (91.9%) are enrolled in public schools. The age group of 3 to 4 year olds has the highest likelihood of being enrolled in private schools, with 14 (41.2% in the age bracket) enrolled. Conversely, the age group of 20 to 24 year olds has the lowest likelihood of being enrolled in a private school, with 23 (100.0% in the age bracket) attending a public institution.
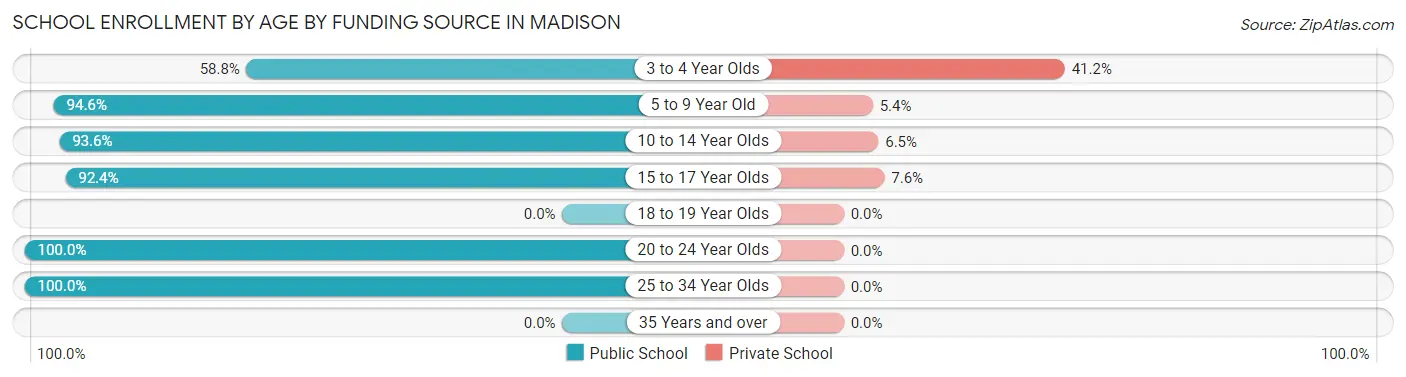
| Age Bracket | Public School | Private School |
| 3 to 4 Year Olds | 20 (58.8%) | 14 (41.2%) |
| 5 to 9 Year Old | 140 (94.6%) | 8 (5.4%) |
| 10 to 14 Year Olds | 145 (93.5%) | 10 (6.5%) |
| 15 to 17 Year Olds | 61 (92.4%) | 5 (7.6%) |
| 18 to 19 Year Olds | 0 (0.0%) | 0 (0.0%) |
| 20 to 24 Year Olds | 23 (100.0%) | 0 (0.0%) |
| 25 to 34 Year Olds | 33 (100.0%) | 0 (0.0%) |
| 35 Years and over | 0 (0.0%) | 0 (0.0%) |
| Total | 422 (91.9%) | 37 (8.1%) |
Educational Attainment by Field of Study in Madison
Education (159 | 37.3%), business (101 | 23.7%), science & technology (56 | 13.2%), liberal arts & history (21 | 4.9%), and literature & languages (20 | 4.7%) are the most common fields of study among 426 individuals in Madison who have obtained a bachelor's degree or higher.
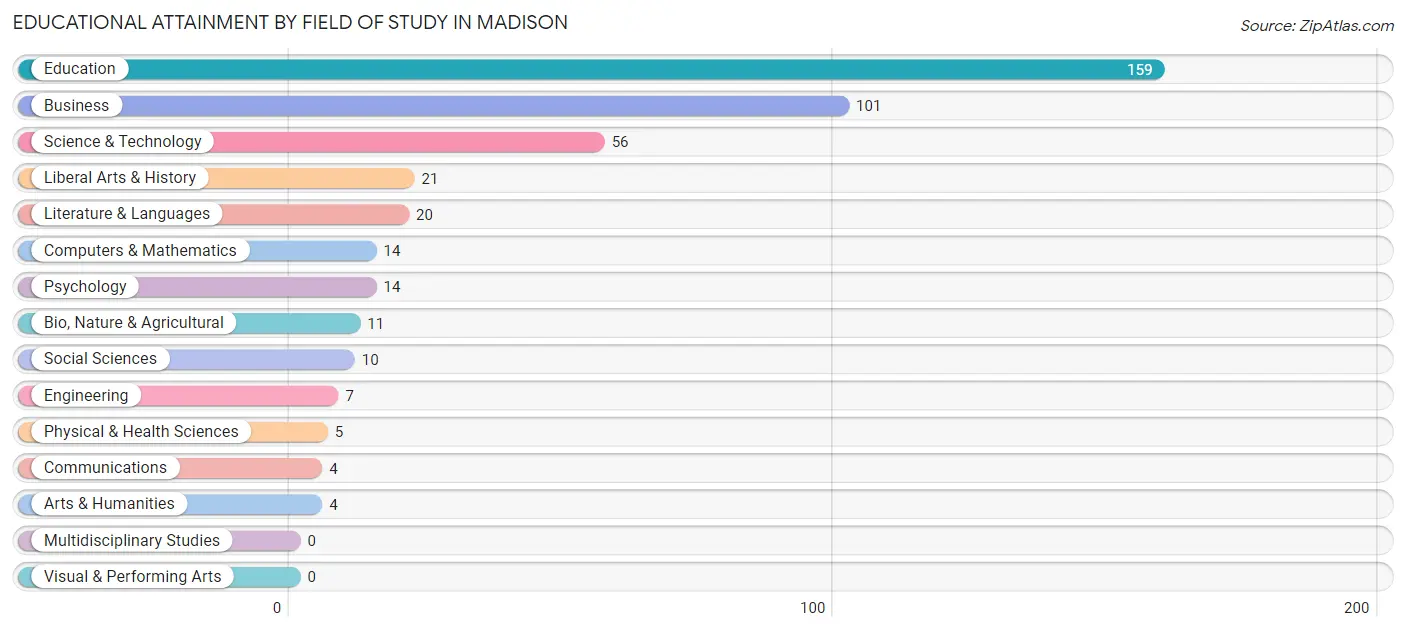
| Field of Study | # Graduates | % Graduates |
| Computers & Mathematics | 14 | 3.3% |
| Bio, Nature & Agricultural | 11 | 2.6% |
| Physical & Health Sciences | 5 | 1.2% |
| Psychology | 14 | 3.3% |
| Social Sciences | 10 | 2.4% |
| Engineering | 7 | 1.6% |
| Multidisciplinary Studies | 0 | 0.0% |
| Science & Technology | 56 | 13.2% |
| Business | 101 | 23.7% |
| Education | 159 | 37.3% |
| Literature & Languages | 20 | 4.7% |
| Liberal Arts & History | 21 | 4.9% |
| Visual & Performing Arts | 0 | 0.0% |
| Communications | 4 | 0.9% |
| Arts & Humanities | 4 | 0.9% |
| Total | 426 | 100.0% |
Transportation & Commute in Madison
Vehicle Availability by Sex in Madison
The most prevalent vehicle ownership categories in Madison are males with 2 vehicles (379, accounting for 54.1%) and females with 2 vehicles (171, making up 83.5%).
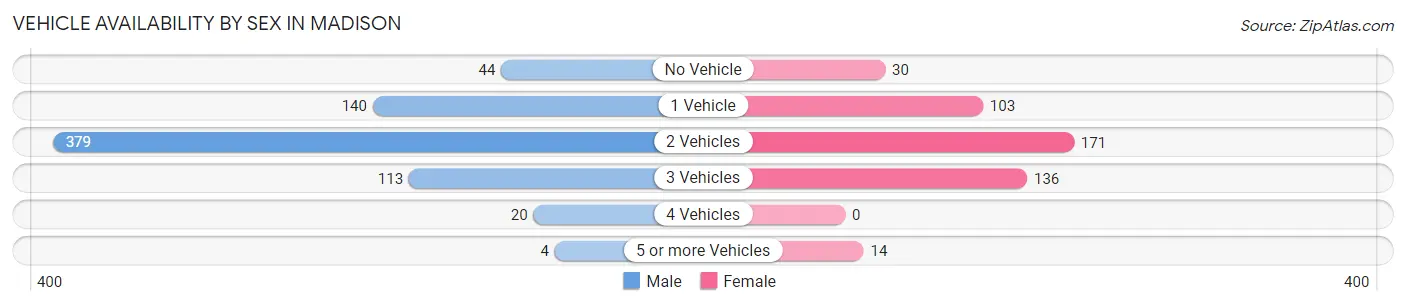
| Vehicles Available | Male | Female |
| No Vehicle | 44 (6.3%) | 30 (6.6%) |
| 1 Vehicle | 140 (20.0%) | 103 (22.7%) |
| 2 Vehicles | 379 (54.1%) | 171 (37.7%) |
| 3 Vehicles | 113 (16.1%) | 136 (30.0%) |
| 4 Vehicles | 20 (2.9%) | 0 (0.0%) |
| 5 or more Vehicles | 4 (0.6%) | 14 (3.1%) |
| Total | 700 (100.0%) | 454 (100.0%) |
Commute Time in Madison
The most frequently occuring commute durations in Madison are 5 to 9 minutes (536 commuters, 46.9%), 10 to 14 minutes (134 commuters, 11.7%), and 45 to 59 minutes (110 commuters, 9.6%).
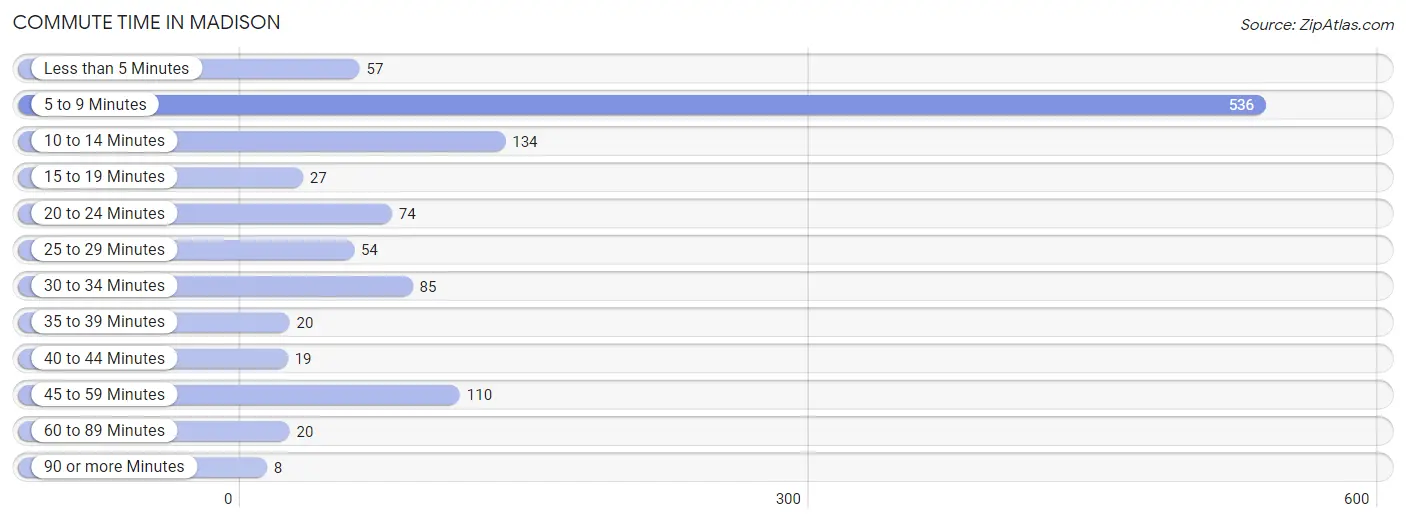
| Commute Time | # Commuters | % Commuters |
| Less than 5 Minutes | 57 | 5.0% |
| 5 to 9 Minutes | 536 | 46.9% |
| 10 to 14 Minutes | 134 | 11.7% |
| 15 to 19 Minutes | 27 | 2.4% |
| 20 to 24 Minutes | 74 | 6.5% |
| 25 to 29 Minutes | 54 | 4.7% |
| 30 to 34 Minutes | 85 | 7.4% |
| 35 to 39 Minutes | 20 | 1.8% |
| 40 to 44 Minutes | 19 | 1.7% |
| 45 to 59 Minutes | 110 | 9.6% |
| 60 to 89 Minutes | 20 | 1.8% |
| 90 or more Minutes | 8 | 0.7% |
Commute Time by Sex in Madison
The most common commute times in Madison are 5 to 9 minutes (334 commuters, 48.1%) for males and 5 to 9 minutes (202 commuters, 45.0%) for females.
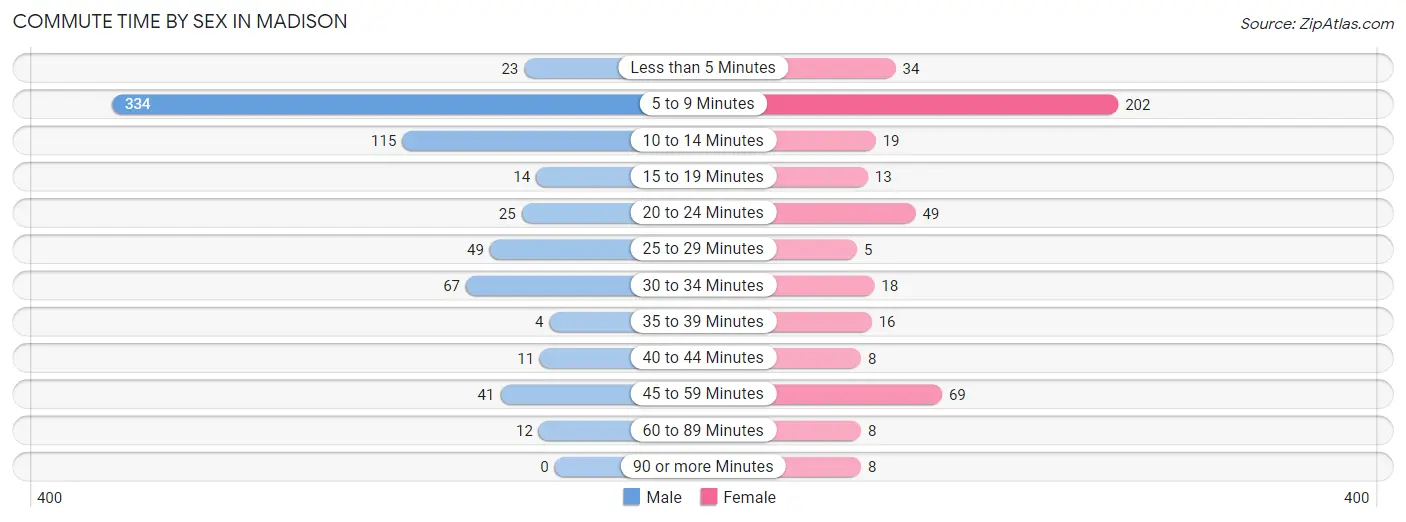
| Commute Time | Male | Female |
| Less than 5 Minutes | 23 (3.3%) | 34 (7.6%) |
| 5 to 9 Minutes | 334 (48.1%) | 202 (45.0%) |
| 10 to 14 Minutes | 115 (16.6%) | 19 (4.2%) |
| 15 to 19 Minutes | 14 (2.0%) | 13 (2.9%) |
| 20 to 24 Minutes | 25 (3.6%) | 49 (10.9%) |
| 25 to 29 Minutes | 49 (7.0%) | 5 (1.1%) |
| 30 to 34 Minutes | 67 (9.6%) | 18 (4.0%) |
| 35 to 39 Minutes | 4 (0.6%) | 16 (3.6%) |
| 40 to 44 Minutes | 11 (1.6%) | 8 (1.8%) |
| 45 to 59 Minutes | 41 (5.9%) | 69 (15.4%) |
| 60 to 89 Minutes | 12 (1.7%) | 8 (1.8%) |
| 90 or more Minutes | 0 (0.0%) | 8 (1.8%) |
Time of Departure to Work by Sex in Madison
The most frequent times of departure to work in Madison are 4:00 PM to 11:59 PM (212, 30.5%) for males and 7:00 AM to 7:29 AM (140, 31.2%) for females.
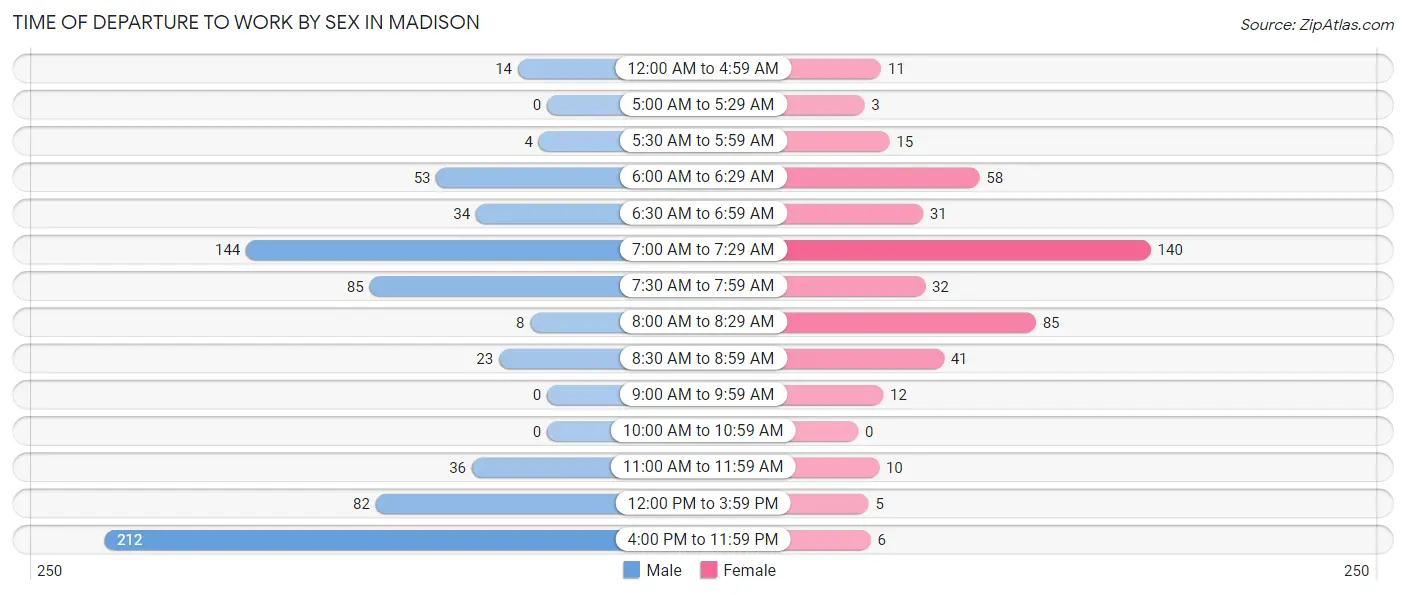
| Time of Departure | Male | Female |
| 12:00 AM to 4:59 AM | 14 (2.0%) | 11 (2.5%) |
| 5:00 AM to 5:29 AM | 0 (0.0%) | 3 (0.7%) |
| 5:30 AM to 5:59 AM | 4 (0.6%) | 15 (3.3%) |
| 6:00 AM to 6:29 AM | 53 (7.6%) | 58 (12.9%) |
| 6:30 AM to 6:59 AM | 34 (4.9%) | 31 (6.9%) |
| 7:00 AM to 7:29 AM | 144 (20.7%) | 140 (31.2%) |
| 7:30 AM to 7:59 AM | 85 (12.2%) | 32 (7.1%) |
| 8:00 AM to 8:29 AM | 8 (1.1%) | 85 (18.9%) |
| 8:30 AM to 8:59 AM | 23 (3.3%) | 41 (9.1%) |
| 9:00 AM to 9:59 AM | 0 (0.0%) | 12 (2.7%) |
| 10:00 AM to 10:59 AM | 0 (0.0%) | 0 (0.0%) |
| 11:00 AM to 11:59 AM | 36 (5.2%) | 10 (2.2%) |
| 12:00 PM to 3:59 PM | 82 (11.8%) | 5 (1.1%) |
| 4:00 PM to 11:59 PM | 212 (30.5%) | 6 (1.3%) |
| Total | 695 (100.0%) | 449 (100.0%) |
Housing Occupancy in Madison
Occupancy by Ownership in Madison
Of the total 1,014 dwellings in Madison, owner-occupied units account for 767 (75.6%), while renter-occupied units make up 247 (24.4%).
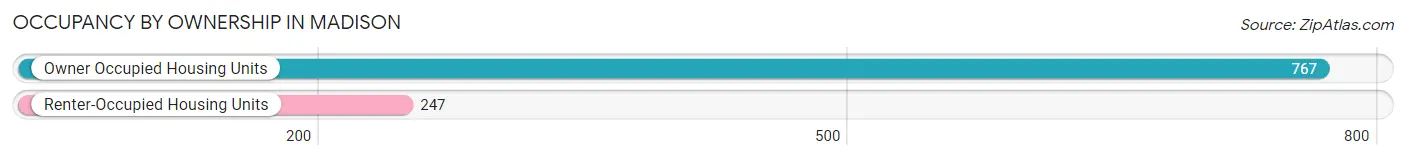
| Occupancy | # Housing Units | % Housing Units |
| Owner Occupied Housing Units | 767 | 75.6% |
| Renter-Occupied Housing Units | 247 | 24.4% |
| Total Occupied Housing Units | 1,014 | 100.0% |
Occupancy by Household Size in Madison
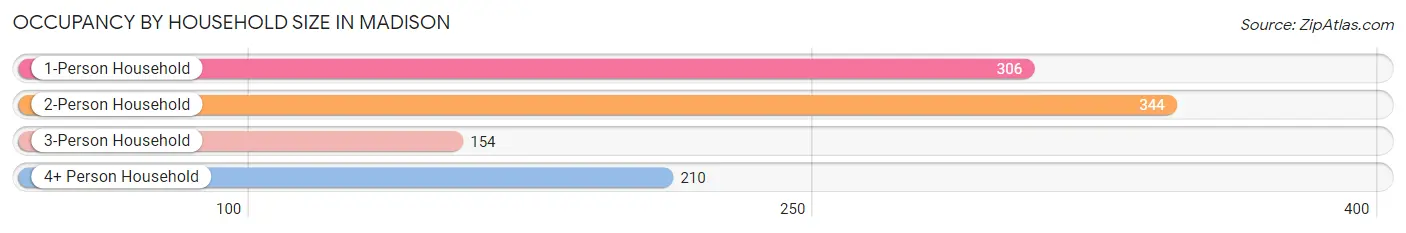
| Household Size | # Housing Units | % Housing Units |
| 1-Person Household | 306 | 30.2% |
| 2-Person Household | 344 | 33.9% |
| 3-Person Household | 154 | 15.2% |
| 4+ Person Household | 210 | 20.7% |
| Total Housing Units | 1,014 | 100.0% |
Occupancy by Ownership by Household Size in Madison
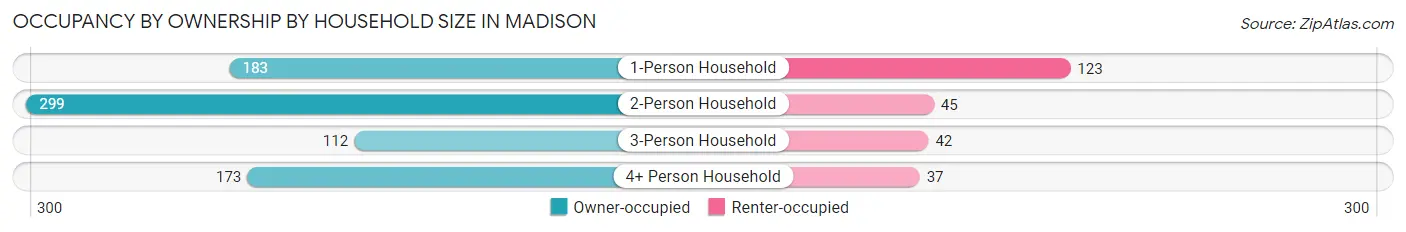
| Household Size | Owner-occupied | Renter-occupied |
| 1-Person Household | 183 (59.8%) | 123 (40.2%) |
| 2-Person Household | 299 (86.9%) | 45 (13.1%) |
| 3-Person Household | 112 (72.7%) | 42 (27.3%) |
| 4+ Person Household | 173 (82.4%) | 37 (17.6%) |
| Total Housing Units | 767 (75.6%) | 247 (24.4%) |
Occupancy by Educational Attainment in Madison
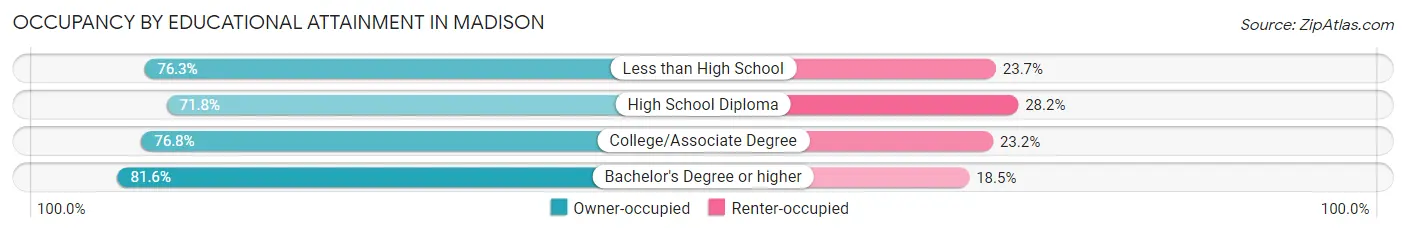
| Household Size | Owner-occupied | Renter-occupied |
| Less than High School | 45 (76.3%) | 14 (23.7%) |
| High School Diploma | 283 (71.8%) | 111 (28.2%) |
| College/Associate Degree | 302 (76.8%) | 91 (23.2%) |
| Bachelor's Degree or higher | 137 (81.6%) | 31 (18.4%) |
Occupancy by Age of Householder in Madison
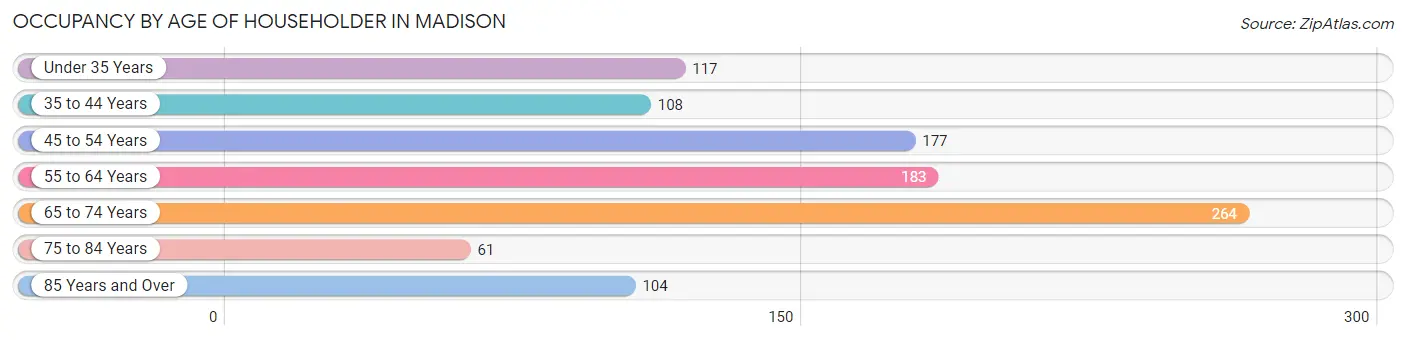
| Age Bracket | # Households | % Households |
| Under 35 Years | 117 | 11.5% |
| 35 to 44 Years | 108 | 10.6% |
| 45 to 54 Years | 177 | 17.5% |
| 55 to 64 Years | 183 | 18.0% |
| 65 to 74 Years | 264 | 26.0% |
| 75 to 84 Years | 61 | 6.0% |
| 85 Years and Over | 104 | 10.3% |
| Total | 1,014 | 100.0% |
Housing Finances in Madison
Median Income by Occupancy in Madison
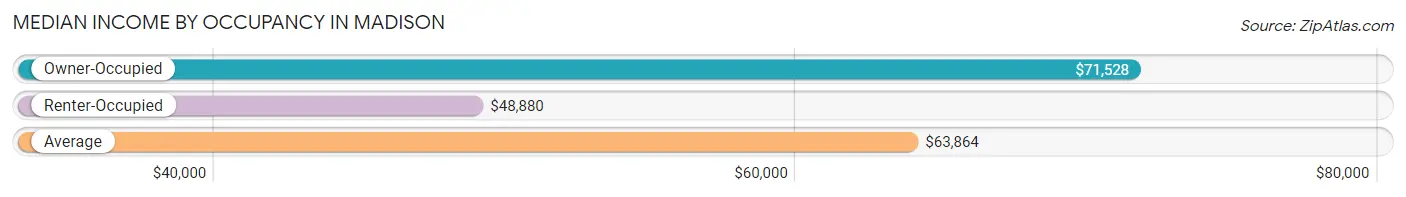
| Occupancy Type | # Households | Median Income |
| Owner-Occupied | 767 (75.6%) | $71,528 |
| Renter-Occupied | 247 (24.4%) | $48,880 |
| Average | 1,014 (100.0%) | $63,864 |
Occupancy by Householder Income Bracket in Madison

| Income Bracket | Owner-occupied | Renter-occupied |
| Less than $5,000 | 11 (1.4%) | 0 (0.0%) |
| $5,000 to $9,999 | 0 (0.0%) | 0 (0.0%) |
| $10,000 to $14,999 | 18 (2.4%) | 37 (15.0%) |
| $15,000 to $19,999 | 25 (3.3%) | 15 (6.1%) |
| $20,000 to $24,999 | 27 (3.5%) | 27 (10.9%) |
| $25,000 to $34,999 | 142 (18.5%) | 0 (0.0%) |
| $35,000 to $49,999 | 85 (11.1%) | 66 (26.7%) |
| $50,000 to $74,999 | 79 (10.3%) | 48 (19.4%) |
| $75,000 to $99,999 | 119 (15.5%) | 43 (17.4%) |
| $100,000 to $149,999 | 162 (21.1%) | 11 (4.4%) |
| $150,000 or more | 99 (12.9%) | 0 (0.0%) |
| Total | 767 (100.0%) | 247 (100.0%) |
Monthly Housing Cost Tiers in Madison
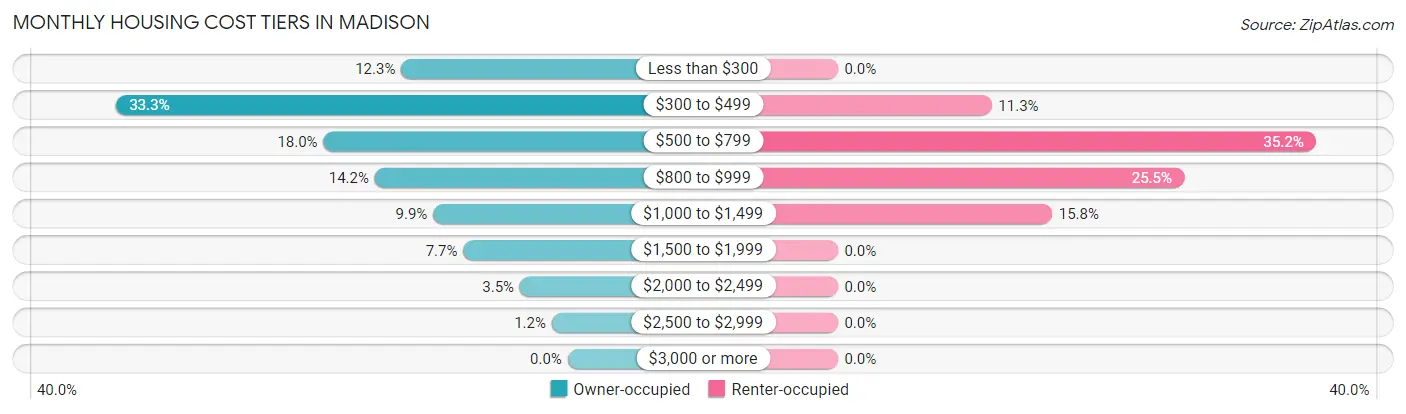
| Monthly Cost | Owner-occupied | Renter-occupied |
| Less than $300 | 94 (12.3%) | 0 (0.0%) |
| $300 to $499 | 255 (33.3%) | 28 (11.3%) |
| $500 to $799 | 138 (18.0%) | 87 (35.2%) |
| $800 to $999 | 109 (14.2%) | 63 (25.5%) |
| $1,000 to $1,499 | 76 (9.9%) | 39 (15.8%) |
| $1,500 to $1,999 | 59 (7.7%) | 0 (0.0%) |
| $2,000 to $2,499 | 27 (3.5%) | 0 (0.0%) |
| $2,500 to $2,999 | 9 (1.2%) | 0 (0.0%) |
| $3,000 or more | 0 (0.0%) | 0 (0.0%) |
| Total | 767 (100.0%) | 247 (100.0%) |
Physical Housing Characteristics in Madison
Housing Structures in Madison
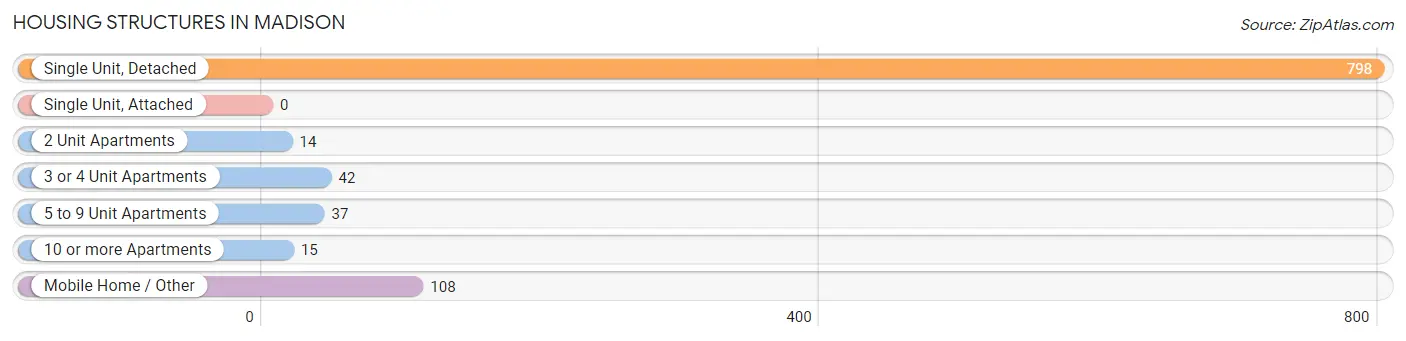
| Structure Type | # Housing Units | % Housing Units |
| Single Unit, Detached | 798 | 78.7% |
| Single Unit, Attached | 0 | 0.0% |
| 2 Unit Apartments | 14 | 1.4% |
| 3 or 4 Unit Apartments | 42 | 4.1% |
| 5 to 9 Unit Apartments | 37 | 3.6% |
| 10 or more Apartments | 15 | 1.5% |
| Mobile Home / Other | 108 | 10.6% |
| Total | 1,014 | 100.0% |
Housing Structures by Occupancy in Madison
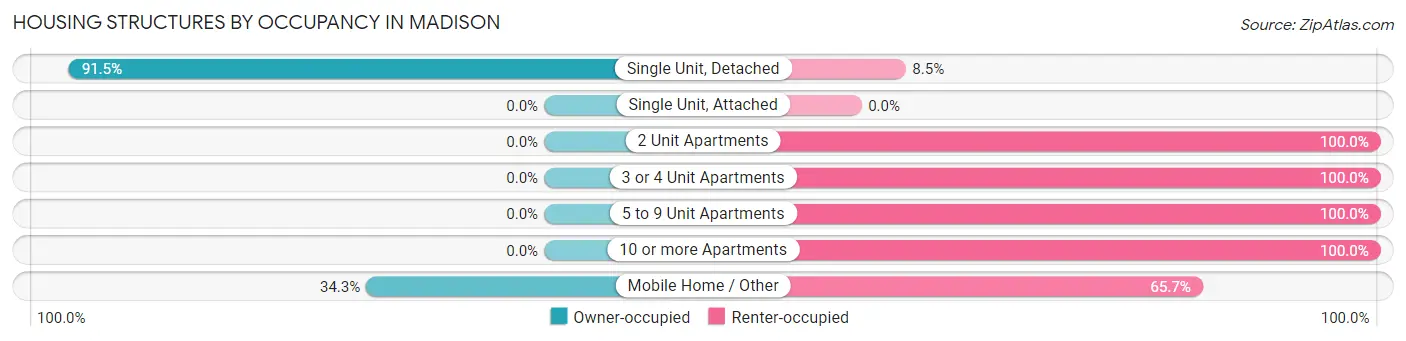
| Structure Type | Owner-occupied | Renter-occupied |
| Single Unit, Detached | 730 (91.5%) | 68 (8.5%) |
| Single Unit, Attached | 0 (0.0%) | 0 (0.0%) |
| 2 Unit Apartments | 0 (0.0%) | 14 (100.0%) |
| 3 or 4 Unit Apartments | 0 (0.0%) | 42 (100.0%) |
| 5 to 9 Unit Apartments | 0 (0.0%) | 37 (100.0%) |
| 10 or more Apartments | 0 (0.0%) | 15 (100.0%) |
| Mobile Home / Other | 37 (34.3%) | 71 (65.7%) |
| Total | 767 (75.6%) | 247 (24.4%) |
Housing Structures by Number of Rooms in Madison
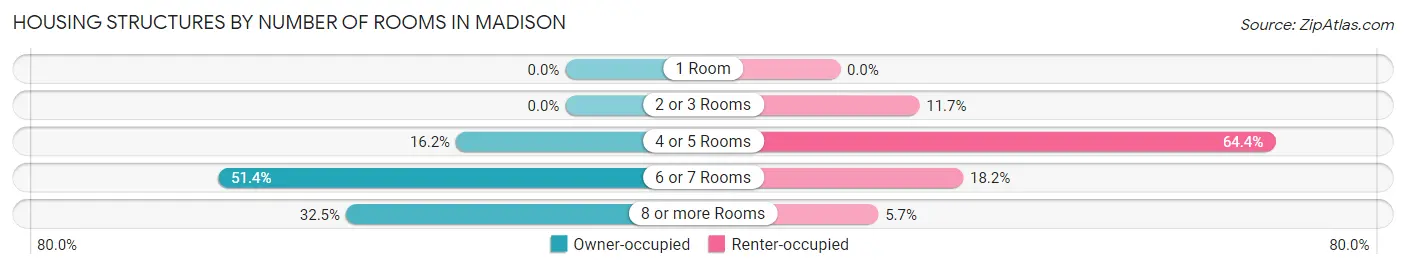
| Number of Rooms | Owner-occupied | Renter-occupied |
| 1 Room | 0 (0.0%) | 0 (0.0%) |
| 2 or 3 Rooms | 0 (0.0%) | 29 (11.7%) |
| 4 or 5 Rooms | 124 (16.2%) | 159 (64.4%) |
| 6 or 7 Rooms | 394 (51.4%) | 45 (18.2%) |
| 8 or more Rooms | 249 (32.5%) | 14 (5.7%) |
| Total | 767 (100.0%) | 247 (100.0%) |
Housing Structure by Heating Type in Madison
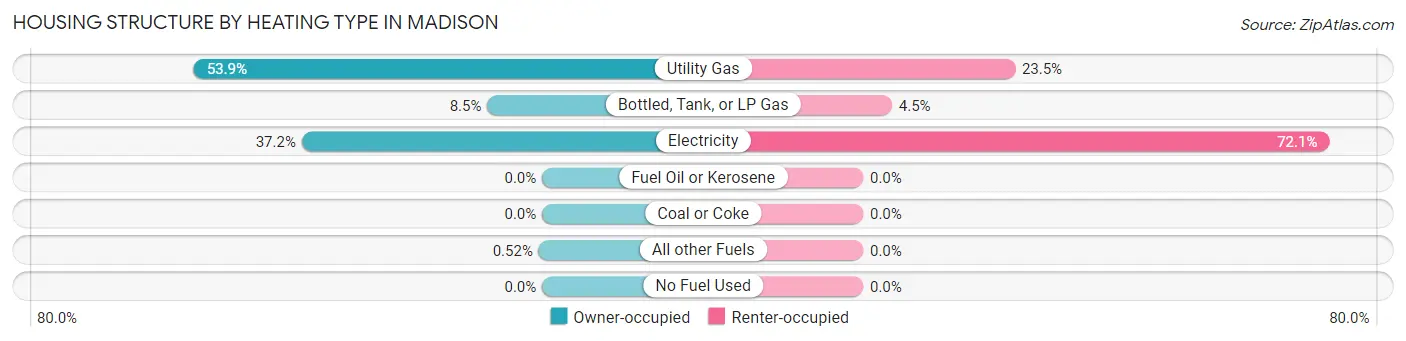
| Heating Type | Owner-occupied | Renter-occupied |
| Utility Gas | 413 (53.8%) | 58 (23.5%) |
| Bottled, Tank, or LP Gas | 65 (8.5%) | 11 (4.4%) |
| Electricity | 285 (37.2%) | 178 (72.1%) |
| Fuel Oil or Kerosene | 0 (0.0%) | 0 (0.0%) |
| Coal or Coke | 0 (0.0%) | 0 (0.0%) |
| All other Fuels | 4 (0.5%) | 0 (0.0%) |
| No Fuel Used | 0 (0.0%) | 0 (0.0%) |
| Total | 767 (100.0%) | 247 (100.0%) |
Household Vehicle Usage in Madison
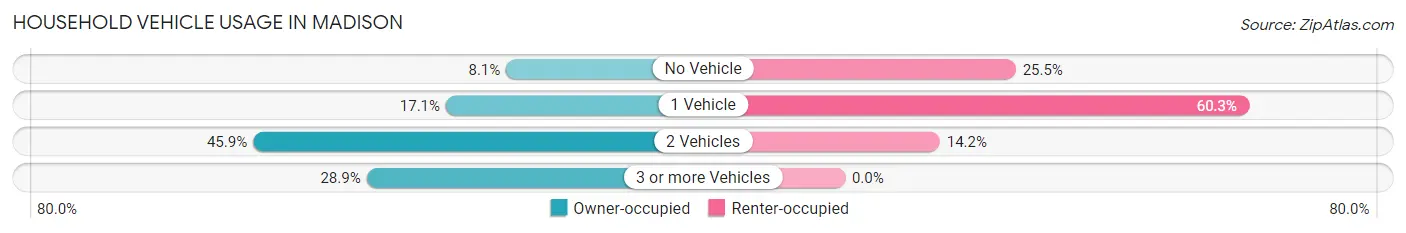
| Vehicles per Household | Owner-occupied | Renter-occupied |
| No Vehicle | 62 (8.1%) | 63 (25.5%) |
| 1 Vehicle | 131 (17.1%) | 149 (60.3%) |
| 2 Vehicles | 352 (45.9%) | 35 (14.2%) |
| 3 or more Vehicles | 222 (28.9%) | 0 (0.0%) |
| Total | 767 (100.0%) | 247 (100.0%) |
Real Estate & Mortgages in Madison
Real Estate and Mortgage Overview in Madison
| Characteristic | Without Mortgage | With Mortgage |
| Housing Units | 489 | 278 |
| Median Property Value | $122,100 | $119,100 |
| Median Household Income | $43,717 | $44 |
| Monthly Housing Costs | $423 | $0 |
| Real Estate Taxes | $671 | $48 |
Property Value by Mortgage Status in Madison
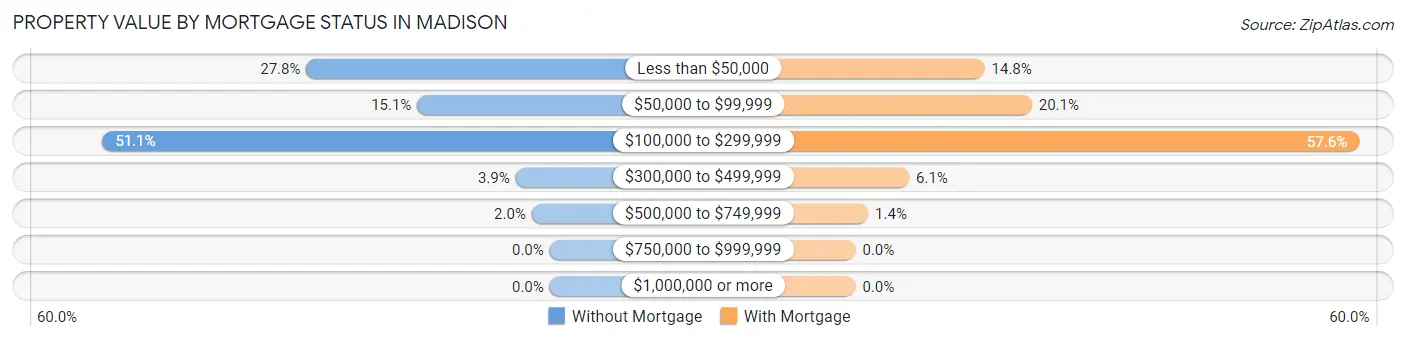
| Property Value | Without Mortgage | With Mortgage |
| Less than $50,000 | 136 (27.8%) | 41 (14.7%) |
| $50,000 to $99,999 | 74 (15.1%) | 56 (20.1%) |
| $100,000 to $299,999 | 250 (51.1%) | 160 (57.6%) |
| $300,000 to $499,999 | 19 (3.9%) | 17 (6.1%) |
| $500,000 to $749,999 | 10 (2.0%) | 4 (1.4%) |
| $750,000 to $999,999 | 0 (0.0%) | 0 (0.0%) |
| $1,000,000 or more | 0 (0.0%) | 0 (0.0%) |
| Total | 489 (100.0%) | 278 (100.0%) |
Household Income by Mortgage Status in Madison
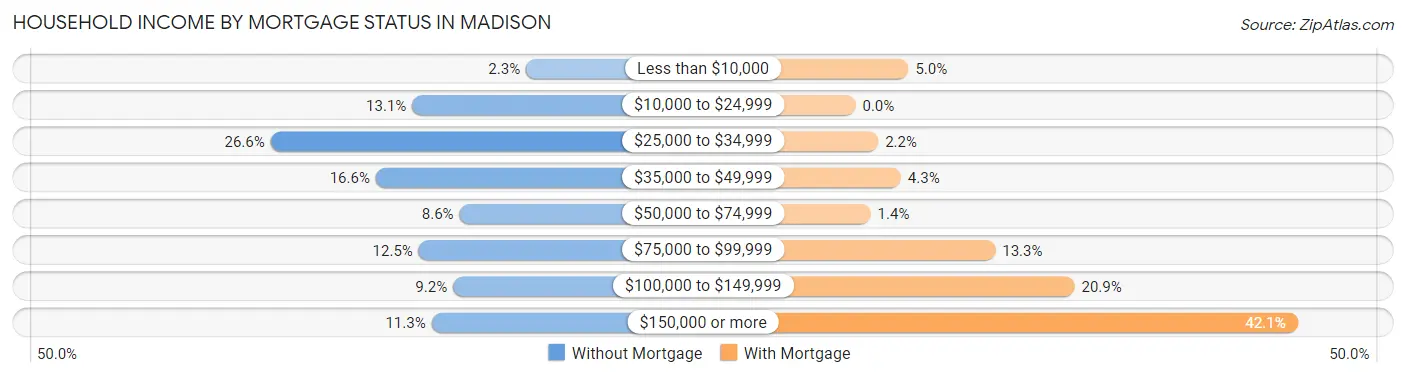
| Household Income | Without Mortgage | With Mortgage |
| Less than $10,000 | 11 (2.2%) | 14 (5.0%) |
| $10,000 to $24,999 | 64 (13.1%) | 0 (0.0%) |
| $25,000 to $34,999 | 130 (26.6%) | 6 (2.2%) |
| $35,000 to $49,999 | 81 (16.6%) | 12 (4.3%) |
| $50,000 to $74,999 | 42 (8.6%) | 4 (1.4%) |
| $75,000 to $99,999 | 61 (12.5%) | 37 (13.3%) |
| $100,000 to $149,999 | 45 (9.2%) | 58 (20.9%) |
| $150,000 or more | 55 (11.3%) | 117 (42.1%) |
| Total | 489 (100.0%) | 278 (100.0%) |
Property Value to Household Income Ratio in Madison
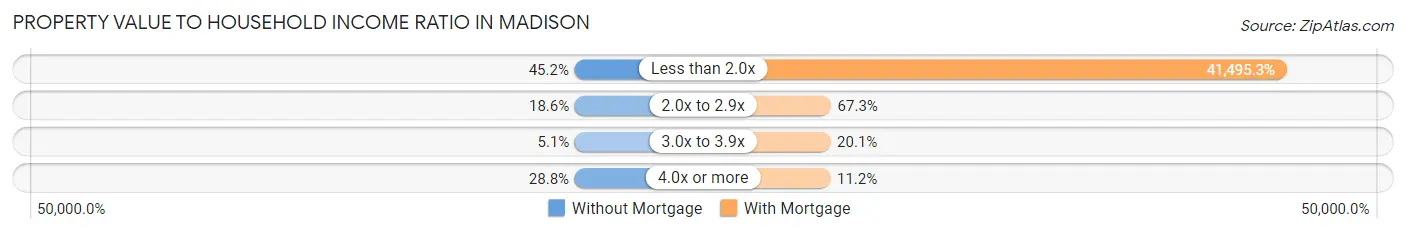
| Value-to-Income Ratio | Without Mortgage | With Mortgage |
| Less than 2.0x | 221 (45.2%) | 115,357 (41,495.3%) |
| 2.0x to 2.9x | 91 (18.6%) | 187 (67.3%) |
| 3.0x to 3.9x | 25 (5.1%) | 56 (20.1%) |
| 4.0x or more | 141 (28.8%) | 31 (11.2%) |
| Total | 489 (100.0%) | 278 (100.0%) |
Real Estate Taxes by Mortgage Status in Madison
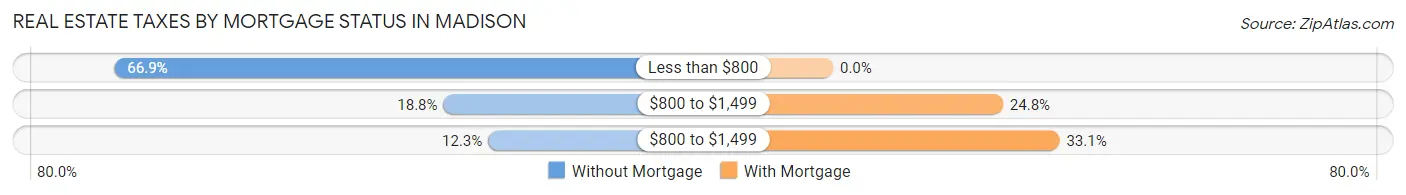
| Property Taxes | Without Mortgage | With Mortgage |
| Less than $800 | 327 (66.9%) | 0 (0.0%) |
| $800 to $1,499 | 92 (18.8%) | 69 (24.8%) |
| $800 to $1,499 | 60 (12.3%) | 92 (33.1%) |
| Total | 489 (100.0%) | 278 (100.0%) |
Health & Disability in Madison
Health Insurance Coverage by Age in Madison
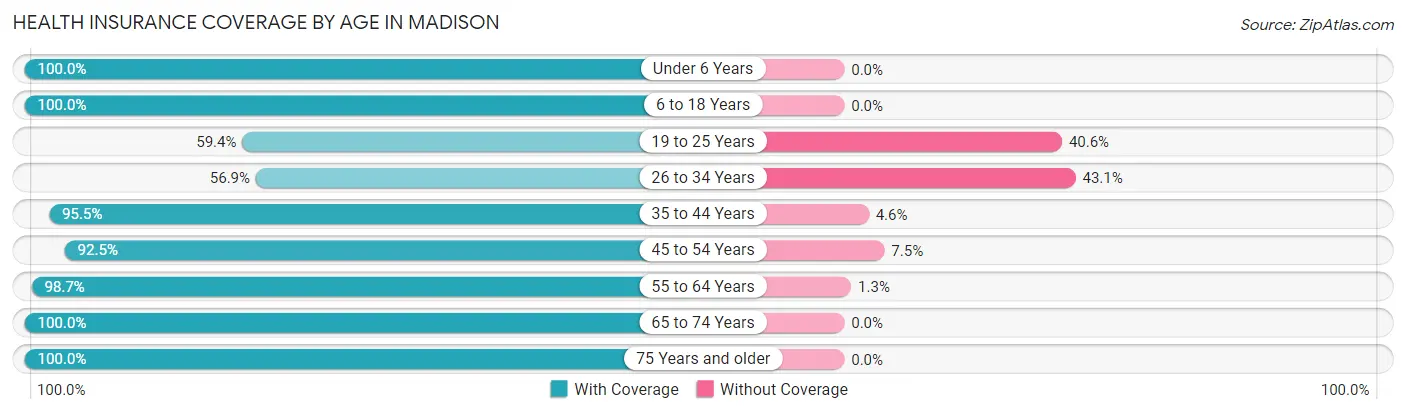
| Age Bracket | With Coverage | Without Coverage |
| Under 6 Years | 208 (100.0%) | 0 (0.0%) |
| 6 to 18 Years | 373 (100.0%) | 0 (0.0%) |
| 19 to 25 Years | 101 (59.4%) | 69 (40.6%) |
| 26 to 34 Years | 281 (56.9%) | 213 (43.1%) |
| 35 to 44 Years | 210 (95.5%) | 10 (4.5%) |
| 45 to 54 Years | 396 (92.5%) | 32 (7.5%) |
| 55 to 64 Years | 309 (98.7%) | 4 (1.3%) |
| 65 to 74 Years | 493 (100.0%) | 0 (0.0%) |
| 75 Years and older | 178 (100.0%) | 0 (0.0%) |
| Total | 2,549 (88.6%) | 328 (11.4%) |
Health Insurance Coverage by Citizenship Status in Madison
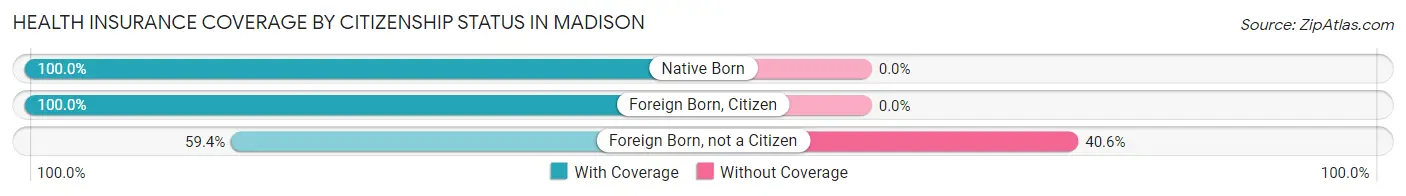
| Citizenship Status | With Coverage | Without Coverage |
| Native Born | 208 (100.0%) | 0 (0.0%) |
| Foreign Born, Citizen | 373 (100.0%) | 0 (0.0%) |
| Foreign Born, not a Citizen | 101 (59.4%) | 69 (40.6%) |
Health Insurance Coverage by Household Income in Madison
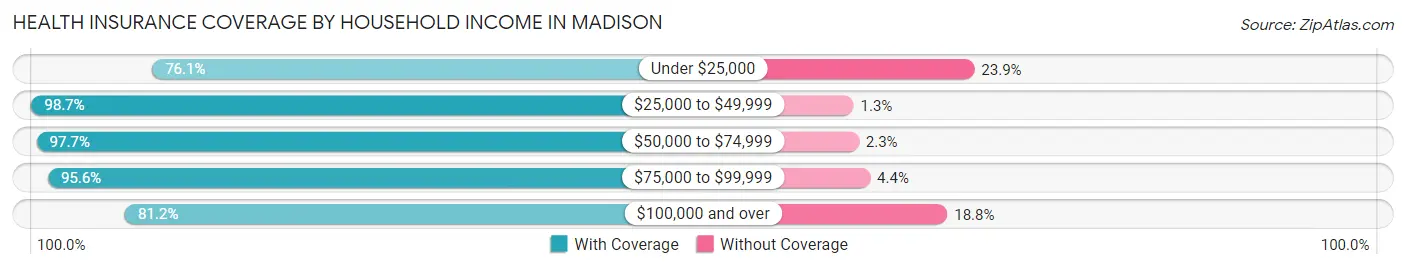
| Household Income | With Coverage | Without Coverage |
| Under $25,000 | 296 (76.1%) | 93 (23.9%) |
| $25,000 to $49,999 | 466 (98.7%) | 6 (1.3%) |
| $50,000 to $74,999 | 433 (97.7%) | 10 (2.3%) |
| $75,000 to $99,999 | 502 (95.6%) | 23 (4.4%) |
| $100,000 and over | 845 (81.2%) | 196 (18.8%) |
Public vs Private Health Insurance Coverage by Age in Madison
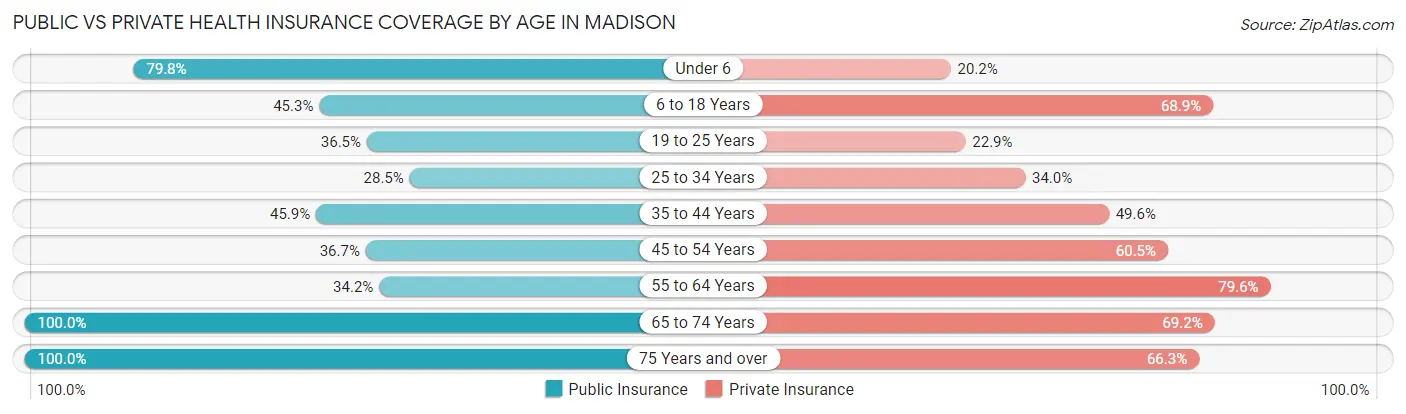
| Age Bracket | Public Insurance | Private Insurance |
| Under 6 | 166 (79.8%) | 42 (20.2%) |
| 6 to 18 Years | 169 (45.3%) | 257 (68.9%) |
| 19 to 25 Years | 62 (36.5%) | 39 (22.9%) |
| 25 to 34 Years | 141 (28.5%) | 168 (34.0%) |
| 35 to 44 Years | 101 (45.9%) | 109 (49.5%) |
| 45 to 54 Years | 157 (36.7%) | 259 (60.5%) |
| 55 to 64 Years | 107 (34.2%) | 249 (79.5%) |
| 65 to 74 Years | 493 (100.0%) | 341 (69.2%) |
| 75 Years and over | 178 (100.0%) | 118 (66.3%) |
| Total | 1,574 (54.7%) | 1,582 (55.0%) |
Disability Status by Sex by Age in Madison
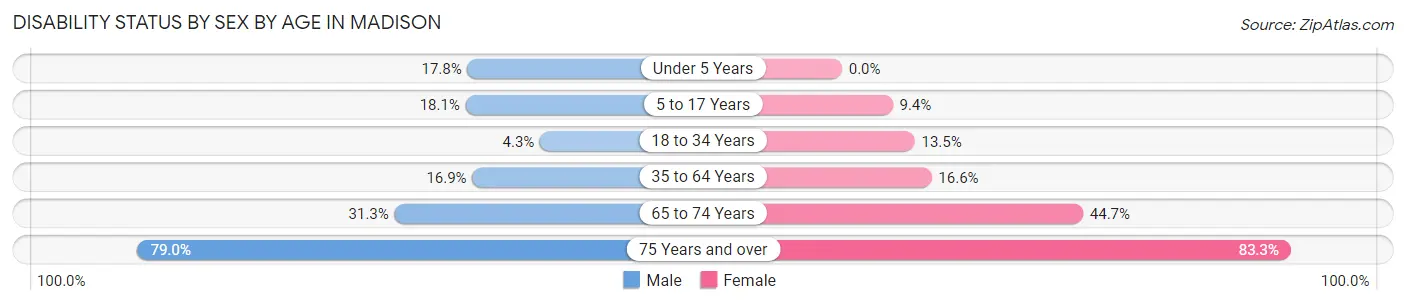
| Age Bracket | Male | Female |
| Under 5 Years | 16 (17.8%) | 0 (0.0%) |
| 5 to 17 Years | 35 (18.1%) | 18 (9.4%) |
| 18 to 34 Years | 19 (4.3%) | 30 (13.5%) |
| 35 to 64 Years | 84 (16.9%) | 77 (16.6%) |
| 65 to 74 Years | 83 (31.3%) | 102 (44.7%) |
| 75 Years and over | 98 (79.0%) | 45 (83.3%) |
Disability Class by Sex by Age in Madison
Disability Class: Hearing Difficulty
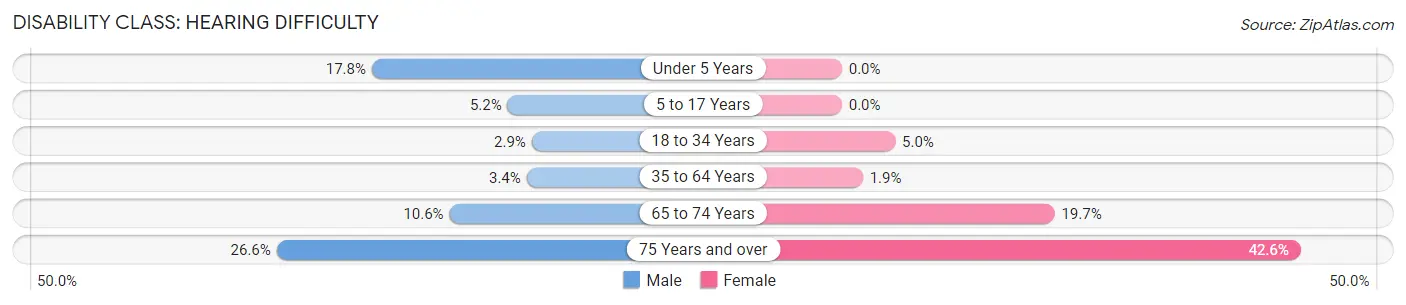
| Age Bracket | Male | Female |
| Under 5 Years | 16 (17.8%) | 0 (0.0%) |
| 5 to 17 Years | 10 (5.2%) | 0 (0.0%) |
| 18 to 34 Years | 13 (2.9%) | 11 (5.0%) |
| 35 to 64 Years | 17 (3.4%) | 9 (1.9%) |
| 65 to 74 Years | 28 (10.6%) | 45 (19.7%) |
| 75 Years and over | 33 (26.6%) | 23 (42.6%) |
Disability Class: Vision Difficulty
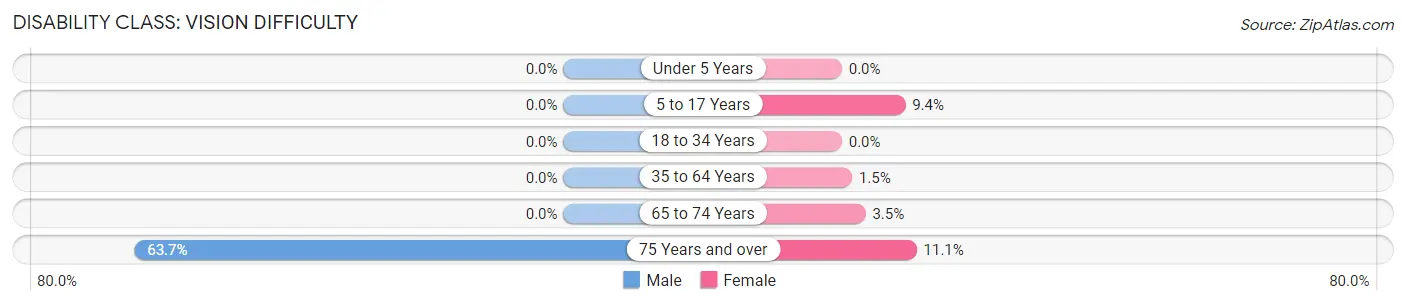
| Age Bracket | Male | Female |
| Under 5 Years | 0 (0.0%) | 0 (0.0%) |
| 5 to 17 Years | 0 (0.0%) | 18 (9.4%) |
| 18 to 34 Years | 0 (0.0%) | 0 (0.0%) |
| 35 to 64 Years | 0 (0.0%) | 7 (1.5%) |
| 65 to 74 Years | 0 (0.0%) | 8 (3.5%) |
| 75 Years and over | 79 (63.7%) | 6 (11.1%) |
Disability Class: Cognitive Difficulty
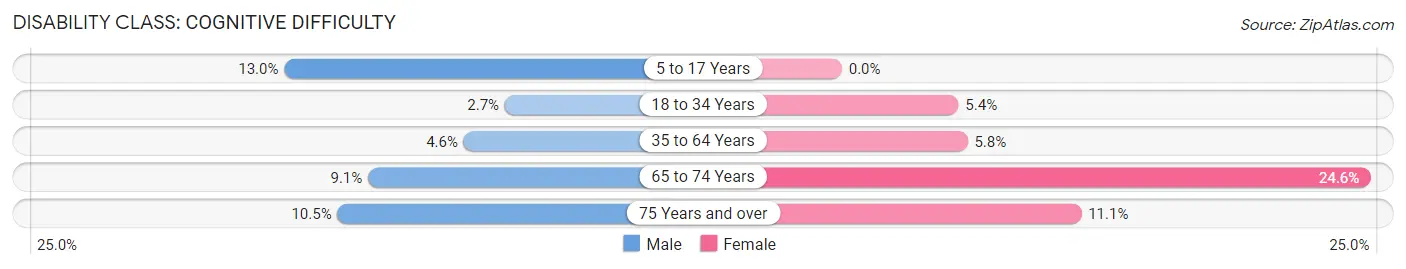
| Age Bracket | Male | Female |
| 5 to 17 Years | 25 (13.0%) | 0 (0.0%) |
| 18 to 34 Years | 12 (2.7%) | 12 (5.4%) |
| 35 to 64 Years | 23 (4.6%) | 27 (5.8%) |
| 65 to 74 Years | 24 (9.1%) | 56 (24.6%) |
| 75 Years and over | 13 (10.5%) | 6 (11.1%) |
Disability Class: Ambulatory Difficulty
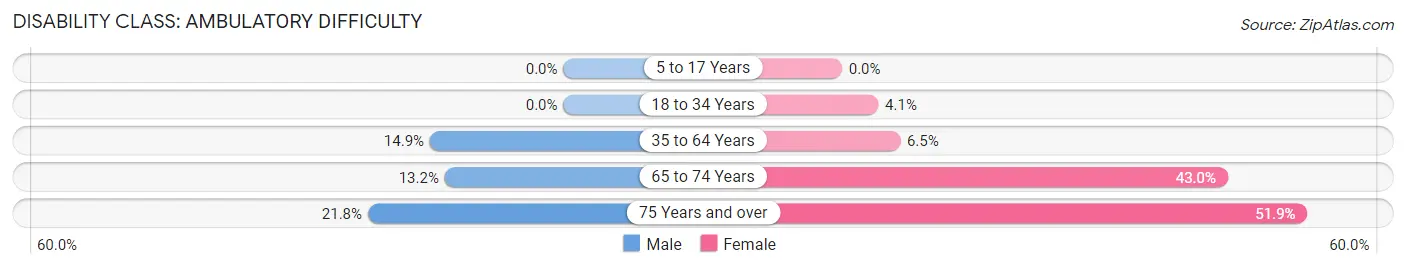
| Age Bracket | Male | Female |
| 5 to 17 Years | 0 (0.0%) | 0 (0.0%) |
| 18 to 34 Years | 0 (0.0%) | 9 (4.1%) |
| 35 to 64 Years | 74 (14.9%) | 30 (6.5%) |
| 65 to 74 Years | 35 (13.2%) | 98 (43.0%) |
| 75 Years and over | 27 (21.8%) | 28 (51.8%) |
Disability Class: Self-Care Difficulty
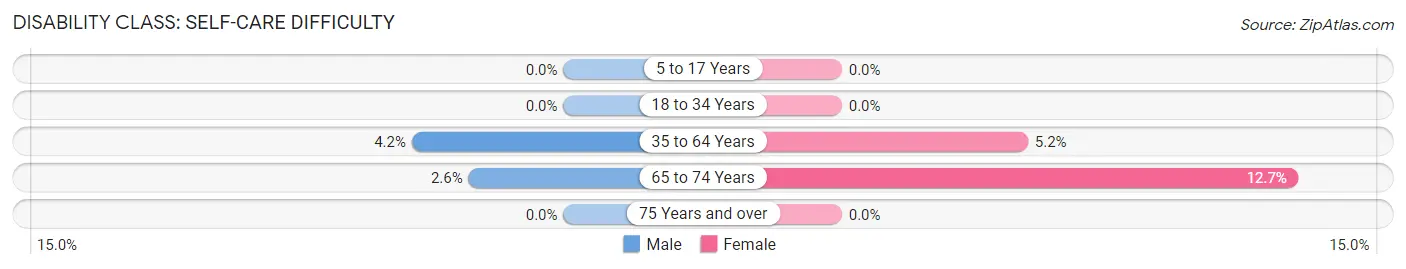
| Age Bracket | Male | Female |
| 5 to 17 Years | 0 (0.0%) | 0 (0.0%) |
| 18 to 34 Years | 0 (0.0%) | 0 (0.0%) |
| 35 to 64 Years | 21 (4.2%) | 24 (5.2%) |
| 65 to 74 Years | 7 (2.6%) | 29 (12.7%) |
| 75 Years and over | 0 (0.0%) | 0 (0.0%) |
Technology Access in Madison
Computing Device Access in Madison
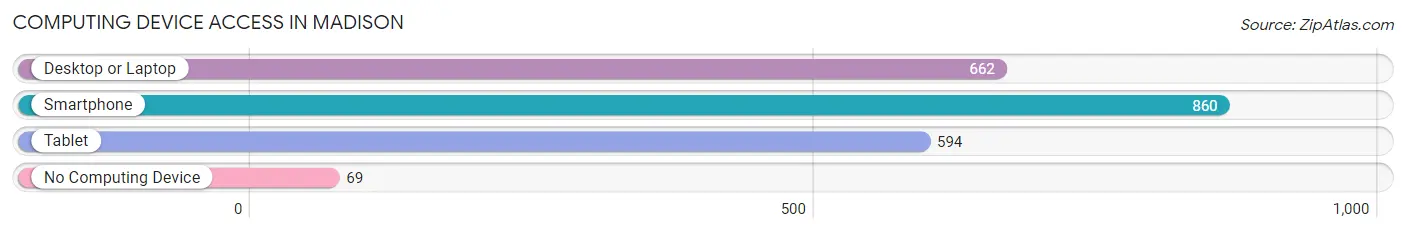
| Device Type | # Households | % Households |
| Desktop or Laptop | 662 | 65.3% |
| Smartphone | 860 | 84.8% |
| Tablet | 594 | 58.6% |
| No Computing Device | 69 | 6.8% |
| Total | 1,014 | 100.0% |
Internet Access in Madison
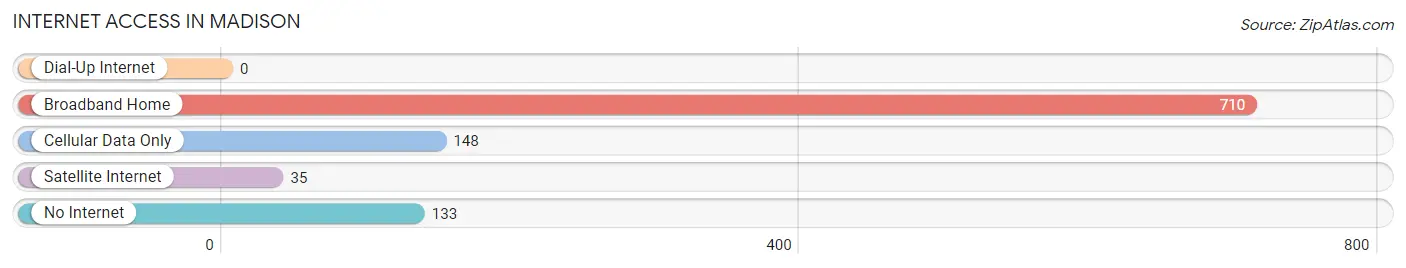
| Internet Type | # Households | % Households |
| Dial-Up Internet | 0 | 0.0% |
| Broadband Home | 710 | 70.0% |
| Cellular Data Only | 148 | 14.6% |
| Satellite Internet | 35 | 3.5% |
| No Internet | 133 | 13.1% |
| Total | 1,014 | 100.0% |
Madison Summary
Madison is a small town located in Boone County, West Virginia. It is situated on the banks of the Coal River, and is part of the Charleston metropolitan area. The town has a population of approximately 1,000 people, and is known for its rural charm and friendly atmosphere.
Geography
Madison is located in the Appalachian Mountains of West Virginia, and is situated on the banks of the Coal River. The town is surrounded by rolling hills and lush forests, and is home to a variety of wildlife. The town is located approximately 30 miles from Charleston, the state capital.
The town is located at an elevation of 1,000 feet, and has a humid subtropical climate. Summers are hot and humid, with temperatures reaching into the 90s, while winters are cold and snowy, with temperatures dropping into the teens.
Economy
The economy of Madison is largely based on agriculture and tourism. The town is home to several farms, which produce a variety of crops, including corn, soybeans, and hay. The town is also home to several small businesses, including restaurants, shops, and a local winery.
Tourism is an important part of the local economy, as the town is home to several attractions, including the Coal River Valley Historical Museum, the Coal River Valley Railroad, and the Coal River Valley Wildlife Refuge. The town also hosts several festivals throughout the year, including the Coal River Valley Festival and the Madison County Fair.
Demographics
As of the 2010 census, the population of Madison was 1,000. The racial makeup of the town was 97.2% White, 0.7% African American, 0.3% Native American, 0.2% Asian, 0.1% Pacific Islander, 0.2% from other races, and 1.3% from two or more races. Hispanic or Latino of any race were 0.7% of the population.
The median income for a household in Madison was $30,000, and the median income for a family was $35,000. The per capita income for the town was $15,000. About 15.7% of families and 18.2% of the population were below the poverty line, including 25.3% of those under age 18 and 8.3% of those age 65 or over.
History
Madison was founded in 1820 by a group of settlers from Virginia. The town was named after James Madison, the fourth President of the United States. The town quickly grew, and by the mid-1800s, it was a thriving community.
In the late 1800s, the town was home to several coal mines, and the population continued to grow. The town was also home to several churches, schools, and businesses.
In the early 1900s, the town was devastated by a flood, and many of the buildings were destroyed. The town was rebuilt, and the population continued to grow.
In the late 1900s, the town began to decline, as the coal industry declined and the population began to move away. Today, Madison is a small, rural town, and is known for its rural charm and friendly atmosphere.
Common Questions
What is Per Capita Income in Madison?
Per Capita income in Madison is $27,649.
What is the Median Family Income in Madison?
Median Family Income in Madison is $83,819.
What is the Median Household income in Madison?
Median Household Income in Madison is $63,864.
What is Inequality or Gini Index in Madison?
Inequality or Gini Index in Madison is 0.38.
What is the Total Population of Madison?
Total Population of Madison is 2,880.
What is the Total Male Population of Madison?
Total Male Population of Madison is 1,613.
What is the Total Female Population of Madison?
Total Female Population of Madison is 1,267.
What is the Ratio of Males per 100 Females in Madison?
There are 127.31 Males per 100 Females in Madison.
What is the Ratio of Females per 100 Males in Madison?
There are 78.55 Females per 100 Males in Madison.
What is the Median Population Age in Madison?
Median Population Age in Madison is 44.4 Years.
What is the Average Family Size in Madison
Average Family Size in Madison is 3.7 People.
What is the Average Household Size in Madison
Average Household Size in Madison is 2.8 People.
How Large is the Labor Force in Madison?
There are 1,289 People in the Labor Forcein in Madison.
What is the Percentage of People in the Labor Force in Madison?
55.8% of People are in the Labor Force in Madison.
What is the Unemployment Rate in Madison?
Unemployment Rate in Madison is 10.5%.