Zip Codes with the Highest Percentage of Hispanic or Latino Population in Huntington, WV
RELATED REPORTS & OPTIONS
Hispanic or Latino
Huntington
Compare Zip Codes
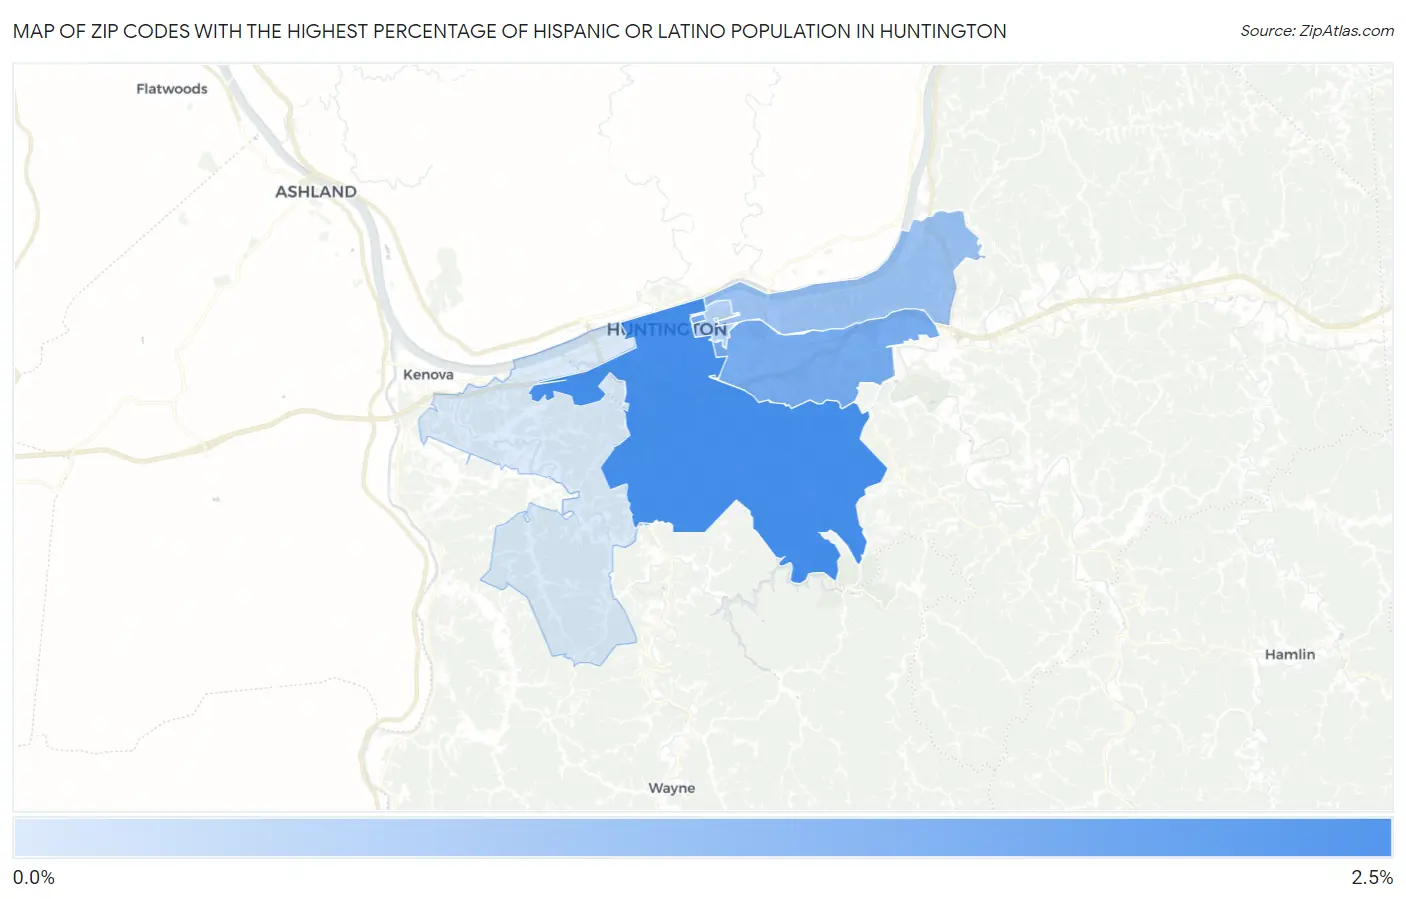
Map of Zip Codes with the Highest Percentage of Hispanic or Latino Population in Huntington
0.18%
2.1%
Zip Codes with the Highest Percentage of Hispanic or Latino Population in Huntington, WV
| Zip Code | Hispanic or Latino | vs State | vs National | |
| 1. | 25701 | 2.1% | 1.8%(+0.269)#96 | 18.7%(-16.5)#20,741 |
| 2. | 25705 | 1.5% | 1.8%(-0.356)#138 | 18.7%(-17.2)#22,620 |
| 3. | 25755 | 1.5% | 1.8%(-0.377)#139 | 18.7%(-17.2)#22,701 |
| 4. | 25702 | 1.0% | 1.8%(-0.795)#173 | 18.7%(-17.6)#23,974 |
| 5. | 25703 | 0.71% | 1.8%(-1.12)#192 | 18.7%(-17.9)#25,039 |
| 6. | 25704 | 0.18% | 1.8%(-1.66)#246 | 18.7%(-18.5)#26,740 |
1
Common Questions
What are the Top 5 Zip Codes with the Highest Percentage of Hispanic or Latino Population in Huntington, WV?
Top 5 Zip Codes with the Highest Percentage of Hispanic or Latino Population in Huntington, WV are:
What zip code has the Highest Percentage of Hispanic or Latino Population in Huntington, WV?
25701 has the Highest Percentage of Hispanic or Latino Population in Huntington, WV with 2.1%.
What is the Percentage of Hispanic or Latino Population in Huntington, WV?
Percentage of Hispanic or Latino Population in Huntington is 1.7%.
What is the Percentage of Hispanic or Latino Population in West Virginia?
Percentage of Hispanic or Latino Population in West Virginia is 1.8%.
What is the Percentage of Hispanic or Latino Population in the United States?
Percentage of Hispanic or Latino Population in the United States is 18.7%.