Zip Codes with the Highest Percentage of Population Employed in Agriculture, Fishing & Hunting in La Crosse, WI
RELATED REPORTS & OPTIONS
Agriculture, Fishing & Hunting
La Crosse
Compare Zip Codes
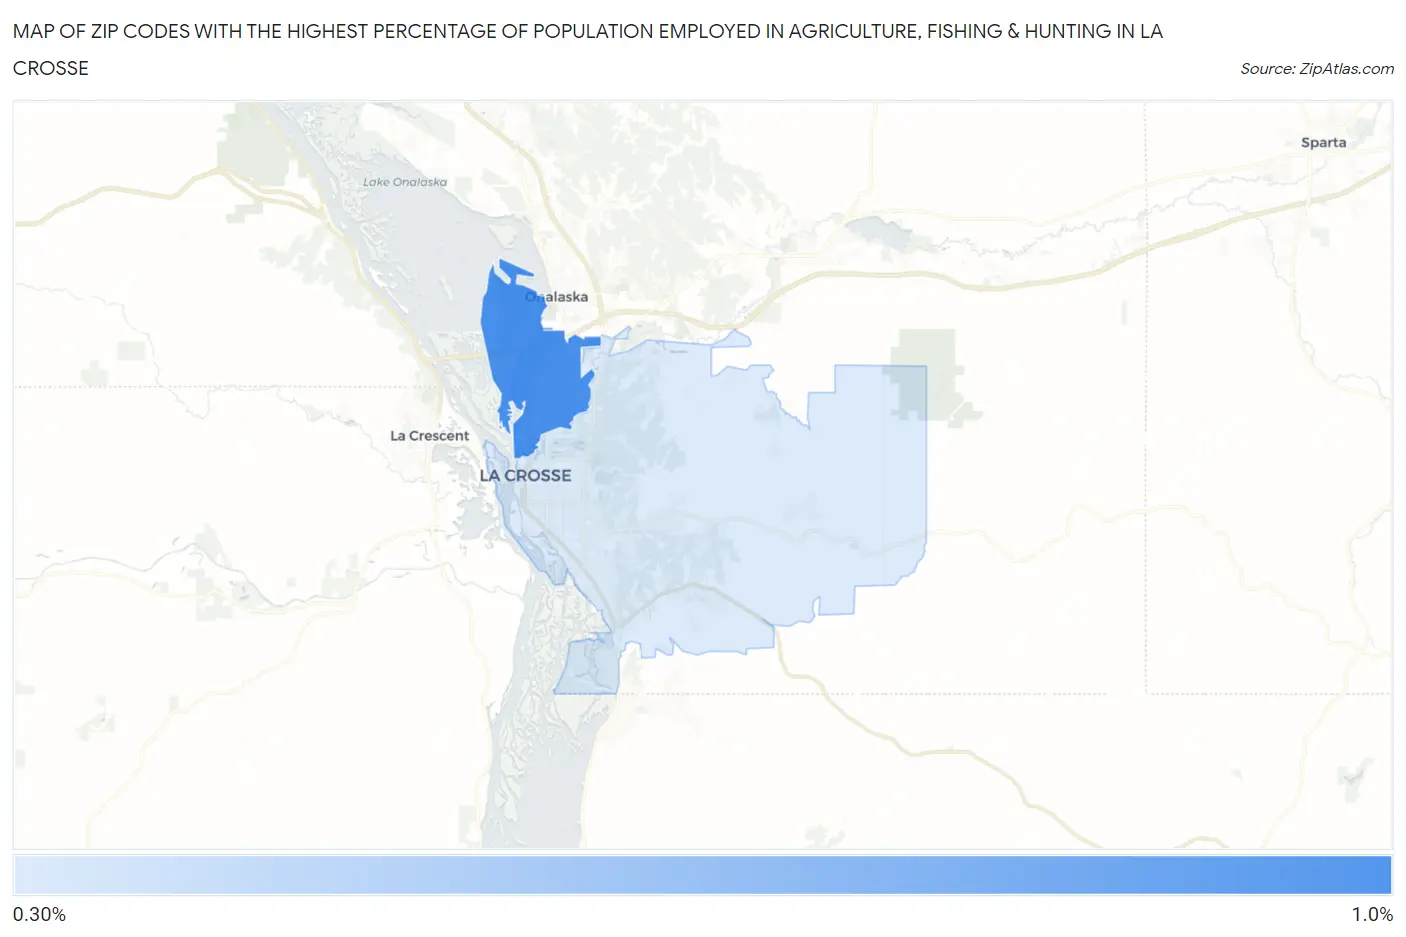
Map of Zip Codes with the Highest Percentage of Population Employed in Agriculture, Fishing & Hunting in La Crosse
0.0%
1.0%
Zip Codes with the Highest Percentage of Population Employed in Agriculture, Fishing & Hunting in La Crosse, WI
| Zip Code | % Employed | vs State | vs National | |
| 1. | 54603 | 0.86% | 2.0%(-1.11)#588 | 1.2%(-0.337)#16,910 |
| 2. | 54601 | 0.34% | 2.0%(-1.64)#667 | 1.2%(-0.862)#20,775 |
1
Common Questions
What are the Top Zip Codes with the Highest Percentage of Population Employed in Agriculture, Fishing & Hunting in La Crosse, WI?
Top Zip Codes with the Highest Percentage of Population Employed in Agriculture, Fishing & Hunting in La Crosse, WI are:
What zip code has the Highest Percentage of Population Employed in Agriculture, Fishing & Hunting in La Crosse, WI?
54603 has the Highest Percentage of Population Employed in Agriculture, Fishing & Hunting in La Crosse, WI with 0.86%.
What is the Percentage of Population Employed in Agriculture, Fishing & Hunting in La Crosse, WI?
Percentage of Population Employed in Agriculture, Fishing & Hunting in La Crosse is 0.29%.
What is the Percentage of Population Employed in Agriculture, Fishing & Hunting in Wisconsin?
Percentage of Population Employed in Agriculture, Fishing & Hunting in Wisconsin is 2.0%.
What is the Percentage of Population Employed in Agriculture, Fishing & Hunting in the United States?
Percentage of Population Employed in Agriculture, Fishing & Hunting in the United States is 1.2%.