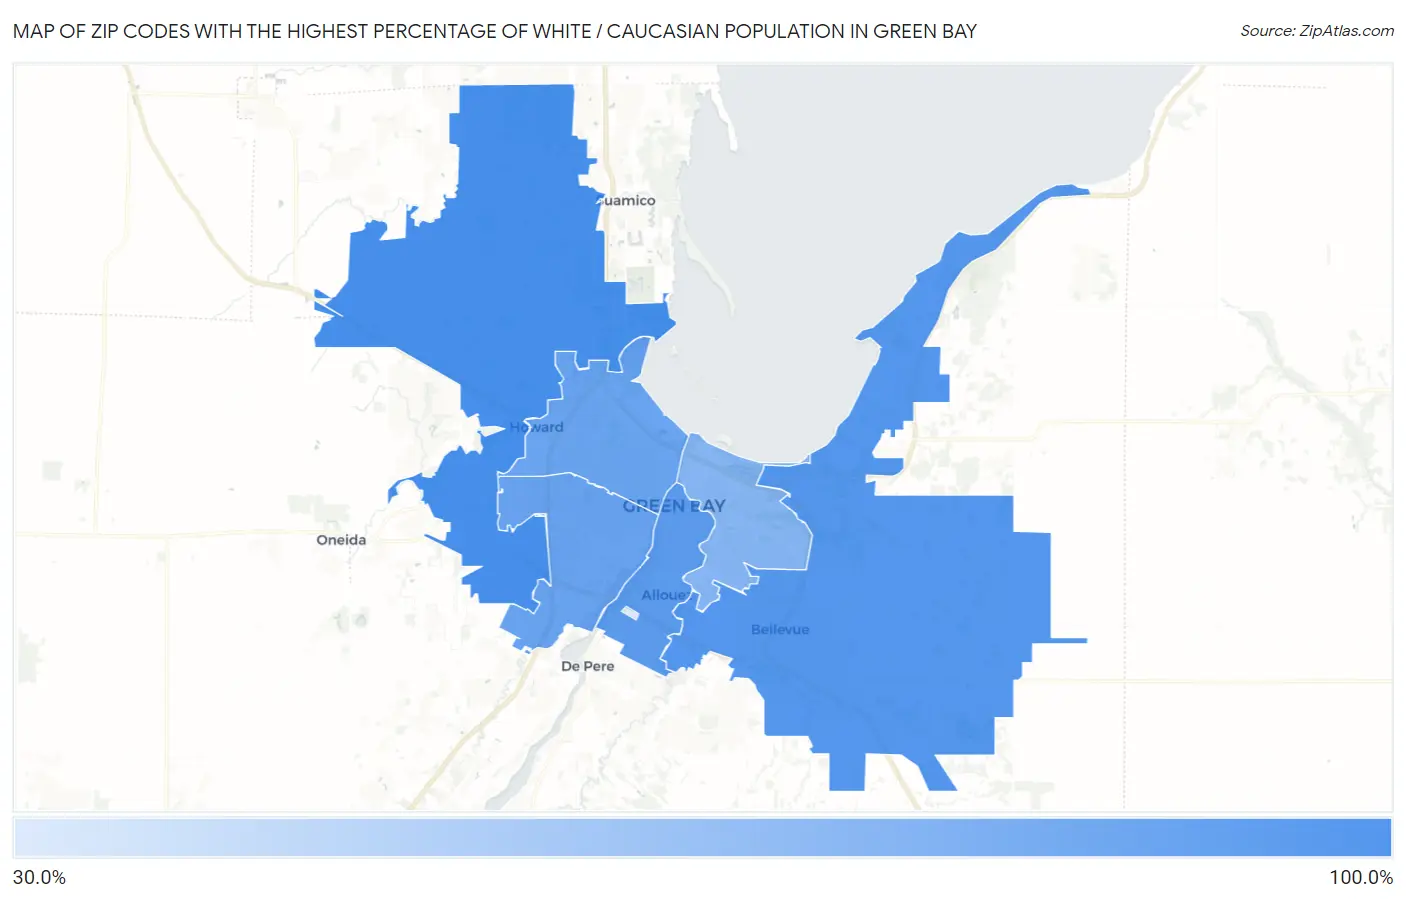
Zip Codes with the Highest Percentage of White / Caucasian Population in Green Bay, WI
RELATED REPORTS & OPTIONS
White / Caucasian
Green Bay
Compare Zip Codes
Map of Zip Codes with the Highest Percentage of White / Caucasian Population in Green Bay
32.8%
90.4%
Zip Codes with the Highest Percentage of White / Caucasian Population in Green Bay, WI
| Zip Code | White / Caucasian | vs State | vs National | |
| 1. | 54313 | 90.4% | 82.5%(+7.86)#547 | 65.9%(+24.5)#14,579 |
| 2. | 54311 | 84.2% | 82.5%(+1.71)#666 | 65.9%(+18.4)#18,813 |
| 3. | 54301 | 82.3% | 82.5%(-0.240)#685 | 65.9%(+16.4)#19,863 |
| 4. | 54304 | 76.3% | 82.5%(-6.25)#724 | 65.9%(+10.4)#22,556 |
| 5. | 54303 | 75.2% | 82.5%(-7.30)#727 | 65.9%(+9.36)#22,989 |
| 6. | 54302 | 64.0% | 82.5%(-18.5)#750 | 65.9%(-1.84)#26,386 |
| 7. | 54307 | 32.8% | 82.5%(-49.7)#768 | 65.9%(-33.0)#31,239 |
1
Common Questions
What are the Top 5 Zip Codes with the Highest Percentage of White / Caucasian Population in Green Bay, WI?
Top 5 Zip Codes with the Highest Percentage of White / Caucasian Population in Green Bay, WI are:
What zip code has the Highest Percentage of White / Caucasian Population in Green Bay, WI?
54313 has the Highest Percentage of White / Caucasian Population in Green Bay, WI with 90.4%.
What is the Percentage of White / Caucasian Population in Green Bay, WI?
Percentage of White / Caucasian Population in Green Bay is 72.3%.
What is the Percentage of White / Caucasian Population in Wisconsin?
Percentage of White / Caucasian Population in Wisconsin is 82.5%.
What is the Percentage of White / Caucasian Population in the United States?
Percentage of White / Caucasian Population in the United States is 65.9%.