Zip Codes with the Highest Percentage of Federal Government Employees in Green Bay, WI

RELATED REPORTS & OPTIONS

Federal Government Employees
Population
Families and Households
Female Fertility
Female Fertility (Unmarried)
Race (Community Size)
Race (Percentage)
Ancestry (Community Size)
AfghanAfricanAmericanArabArmenianAustrianBangladeshiBelgianBhutaneseBlackfeetBritishBulgarianBurmeseCanadianCentral AmericanCentral American IndianCherokeeChippewaChoctawColombianCroatianCubanCzechCzechoslovakianDanishDominicanDutchEastern EuropeanEnglishEthiopianEuropeanFinnishFrenchFrench American IndianFrench CanadianGermanGreekGuatemalanHaitianHonduranHungarianIndian (Asian)IndonesianIrishIroquoisItalianJamaicanKoreanLaotianLatvianLebaneseLithuanianLuxembourgerMalaysianMenomineeMexicanMexican American IndianNative HawaiianNavajoNicaraguanNorthern EuropeanNorwegianOttawaPakistaniPennsylvania GermanPeruvianPolishPortuguesePotawatomiPuerto RicanRomanianRussianSalvadoranScandinavianScotch-IrishScottishSiouxSlavicSlovakSomaliSouth AmericanSpaniardSpanishSri LankanSubsaharan AfricanSwedishSwissSyrianThaiUkrainianVenezuelanWelshYugoslavian
Ancestry (Percentage)
AfghanAfricanAmericanArabArmenianAustrianBangladeshiBelgianBhutaneseBlackfeetBritishBulgarianBurmeseCanadianCentral AmericanCentral American IndianCherokeeChippewaChoctawColombianCroatianCubanCzechCzechoslovakianDanishDominicanDutchEastern EuropeanEnglishEthiopianEuropeanFinnishFrenchFrench American IndianFrench CanadianGermanGreekGuatemalanHaitianHonduranHungarianIndian (Asian)IndonesianIrishIroquoisItalianJamaicanKoreanLaotianLatvianLebaneseLithuanianLuxembourgerMalaysianMenomineeMexicanMexican American IndianNative HawaiianNavajoNicaraguanNorthern EuropeanNorwegianOttawaPakistaniPennsylvania GermanPeruvianPolishPortuguesePotawatomiPuerto RicanRomanianRussianSalvadoranScandinavianScotch-IrishScottishSiouxSlavicSlovakSomaliSouth AmericanSpaniardSpanishSri LankanSubsaharan AfricanSwedishSwissSyrianThaiUkrainianVenezuelanWelshYugoslavian
Immigrant Origin (Total)
Immigrant Origin (Percentage)
Income
Income (Families)
Income (Households)
Poverty
Poverty (Families)
Unemployment
Employment Occupations
Employment Industries
Employer Class
Commute Time
Commute Means
School Enrollment
Education by Degree Field
Occupancy
Finances
Physical Characteristics
Green Bay
Compare Zip Codes
Comparison Subject

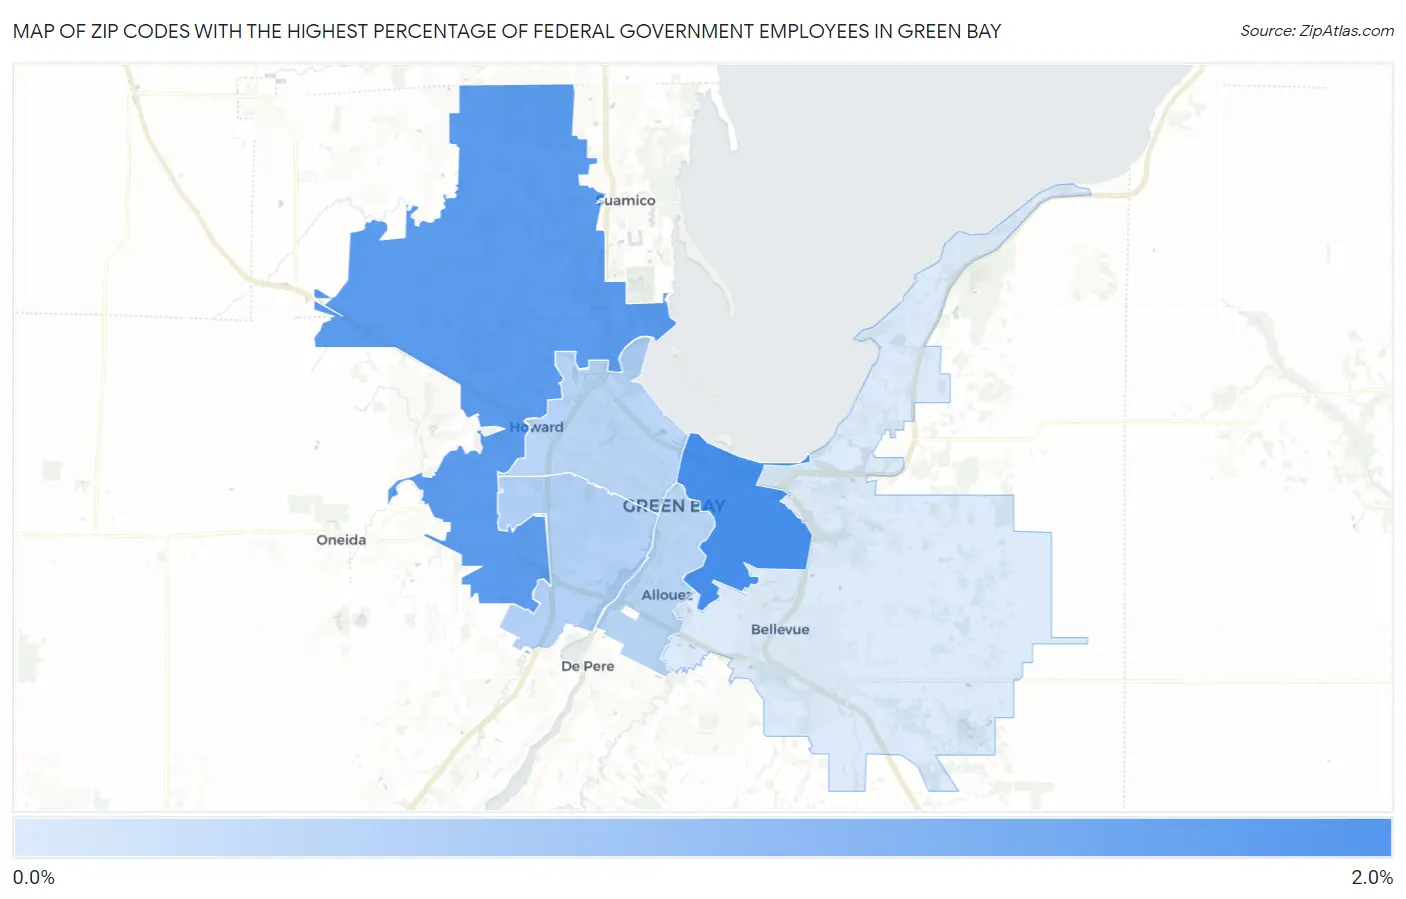
Map of Zip Codes with the Highest Percentage of Federal Government Employees in Green Bay

0.0%
2.0%
Zip Codes with the Highest Percentage of Federal Government Employees in Green Bay Map

Zip Codes with the Highest Percentage of Federal Government Employees in Green Bay, WI

Zip Code % Federal Government Employees vs State vs National
1.543021.9%1.5%(+0.379)#2263.4%(-1.46)#14,189
2.543131.8%1.5%(+0.221)#2613.4%(-1.62)#15,218
3.543041.1%1.5%(-0.458)#4293.4%(-2.30)#20,129
4.543011.0%1.5%(-0.508)#4433.4%(-2.35)#20,515
5.543031.0%1.5%(-0.523)#4493.4%(-2.37)#20,627
6.543110.75%1.5%(-0.781)#5303.4%(-2.62)#22,431

Common Questions

What are the Top 5 Zip Codes with the Highest Percentage of Federal Government Employees in Green Bay, WI?
Top 5 Zip Codes with the Highest Percentage of Federal Government Employees in Green Bay, WI are:
#1
1.9%
#2
1.8%
#3
1.1%
#4
1.0%
#5
1.0%
What zip code has the Highest Percentage of Federal Government Employees in Green Bay, WI?
54302 has the Highest Percentage of Federal Government Employees in Green Bay, WI with 1.9%.
What is the Percentage of Federal Government Employees in Green Bay, WI?
Percentage of Federal Government Employees in Green Bay is 1.1%.
What is the Percentage of Federal Government Employees in Wisconsin?
Percentage of Federal Government Employees in Wisconsin is 1.5%.
What is the Percentage of Federal Government Employees in the United States?
Percentage of Federal Government Employees in the United States is 3.4%.