Edgerton, WI Map & Demographics
Edgerton Map
Edgerton Overview
$35,262
PER CAPITA INCOME
$96,402
AVG FAMILY INCOME
$80,255
AVG HOUSEHOLD INCOME
31.3%
WAGE / INCOME GAP [ % ]
68.7¢/ $1
WAGE / INCOME GAP [ $ ]
0.37
INEQUALITY / GINI INDEX
5,878
TOTAL POPULATION
3,085
MALE POPULATION
2,793
FEMALE POPULATION
110.45
MALES / 100 FEMALES
90.53
FEMALES / 100 MALES
36.0
MEDIAN AGE
3.2
AVG FAMILY SIZE
2.6
AVG HOUSEHOLD SIZE
3,188
LABOR FORCE [ PEOPLE ]
69.1%
PERCENT IN LABOR FORCE
4.7%
UNEMPLOYMENT RATE
Edgerton Zip Codes
Edgerton Area Codes
Income in Edgerton
Income Overview in Edgerton
Per Capita Income in Edgerton is $35,262, while median incomes of families and households are $96,402 and $80,255 respectively.
| Characteristic | Number | Measure |
| Per Capita Income | 5,878 | $35,262 |
| Median Family Income | 1,426 | $96,402 |
| Mean Family Income | 1,426 | $103,704 |
| Median Household Income | 2,257 | $80,255 |
| Mean Household Income | 2,257 | $90,388 |
| Income Deficit | 1,426 | $0 |
| Wage / Income Gap (%) | 5,878 | 31.29% |
| Wage / Income Gap ($) | 5,878 | 68.71¢ per $1 |
| Gini / Inequality Index | 5,878 | 0.37 |
Earnings by Sex in Edgerton
Average Earnings in Edgerton are $46,094, $55,000 for men and $37,788 for women, a difference of 31.3%.
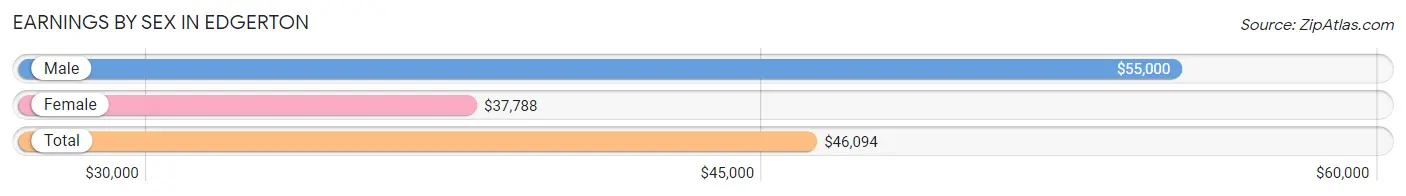
| Sex | Number | Average Earnings |
| Male | 1,800 (53.9%) | $55,000 |
| Female | 1,539 (46.1%) | $37,788 |
| Total | 3,339 (100.0%) | $46,094 |
Earnings by Sex by Income Bracket in Edgerton
The most common earnings brackets in Edgerton are $55,000 to $64,999 for men (337 | 18.7%) and $2,499 or less for women (160 | 10.4%).
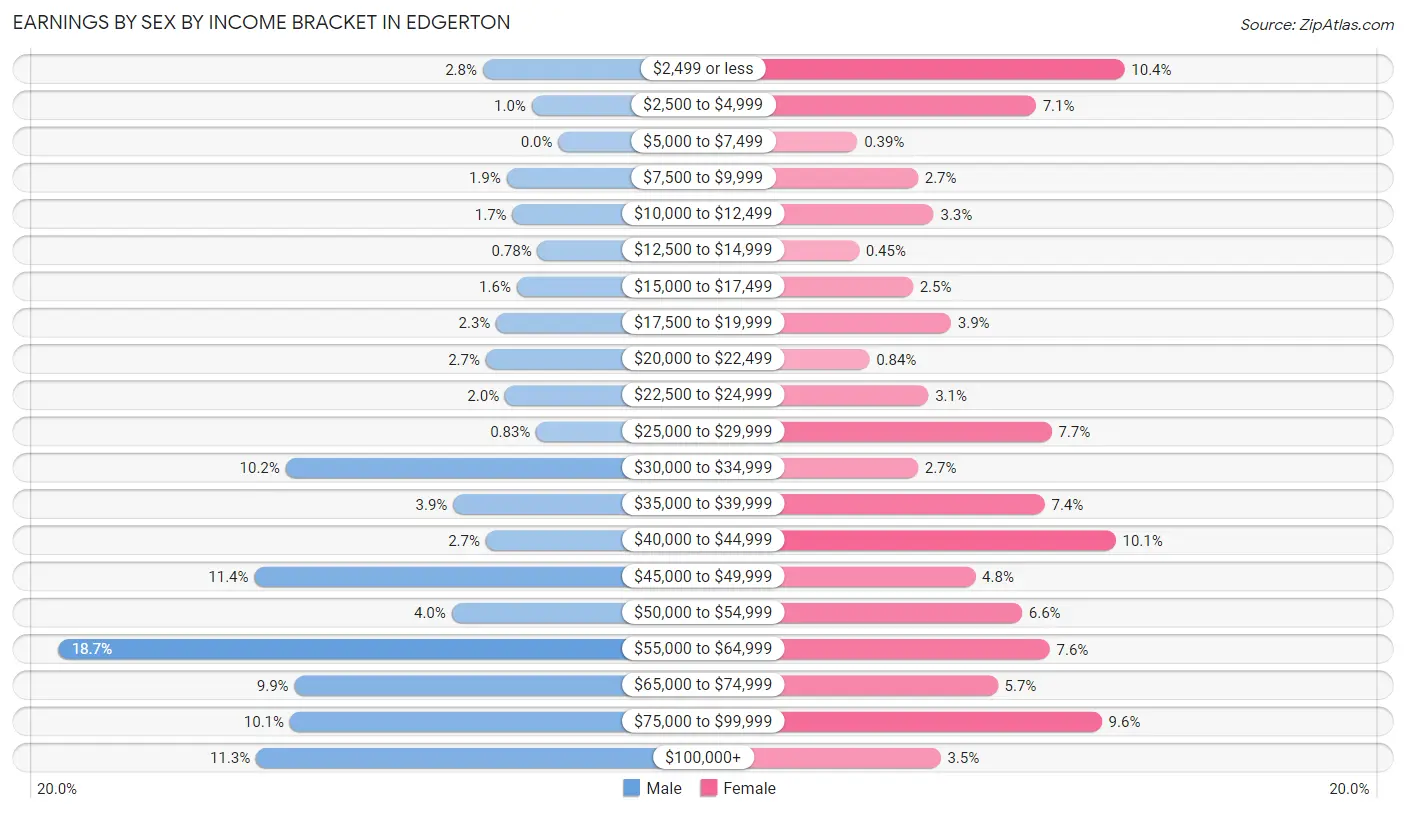
| Income | Male | Female |
| $2,499 or less | 51 (2.8%) | 160 (10.4%) |
| $2,500 to $4,999 | 18 (1.0%) | 109 (7.1%) |
| $5,000 to $7,499 | 0 (0.0%) | 6 (0.4%) |
| $7,500 to $9,999 | 35 (1.9%) | 41 (2.7%) |
| $10,000 to $12,499 | 31 (1.7%) | 50 (3.3%) |
| $12,500 to $14,999 | 14 (0.8%) | 7 (0.4%) |
| $15,000 to $17,499 | 28 (1.6%) | 38 (2.5%) |
| $17,500 to $19,999 | 42 (2.3%) | 60 (3.9%) |
| $20,000 to $22,499 | 49 (2.7%) | 13 (0.8%) |
| $22,500 to $24,999 | 36 (2.0%) | 47 (3.0%) |
| $25,000 to $29,999 | 15 (0.8%) | 118 (7.7%) |
| $30,000 to $34,999 | 184 (10.2%) | 41 (2.7%) |
| $35,000 to $39,999 | 71 (3.9%) | 114 (7.4%) |
| $40,000 to $44,999 | 49 (2.7%) | 155 (10.1%) |
| $45,000 to $49,999 | 205 (11.4%) | 74 (4.8%) |
| $50,000 to $54,999 | 72 (4.0%) | 101 (6.6%) |
| $55,000 to $64,999 | 337 (18.7%) | 117 (7.6%) |
| $65,000 to $74,999 | 178 (9.9%) | 87 (5.7%) |
| $75,000 to $99,999 | 181 (10.1%) | 147 (9.6%) |
| $100,000+ | 204 (11.3%) | 54 (3.5%) |
| Total | 1,800 (100.0%) | 1,539 (100.0%) |
Earnings by Sex by Educational Attainment in Edgerton
Average earnings in Edgerton are $60,483 for men and $43,016 for women, a difference of 28.9%. Men with an educational attainment of graduate degree enjoy the highest average annual earnings of $138,385, while those with high school diploma education earn the least with $46,667. Women with an educational attainment of graduate degree earn the most with the average annual earnings of $69,821, while those with high school diploma education have the smallest earnings of $38,026.
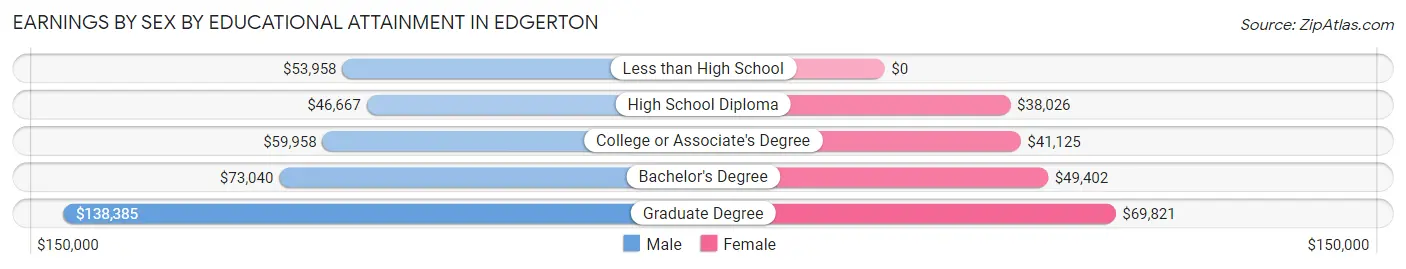
| Educational Attainment | Male Income | Female Income |
| Less than High School | $53,958 | $0 |
| High School Diploma | $46,667 | $38,026 |
| College or Associate's Degree | $59,958 | $41,125 |
| Bachelor's Degree | $73,040 | $49,402 |
| Graduate Degree | $138,385 | $69,821 |
| Total | $60,483 | $43,016 |
Family Income in Edgerton
Family Income Brackets in Edgerton
According to the Edgerton family income data, there are 509 families falling into the $100,000 to $149,999 income range, which is the most common income bracket and makes up 35.7% of all families.
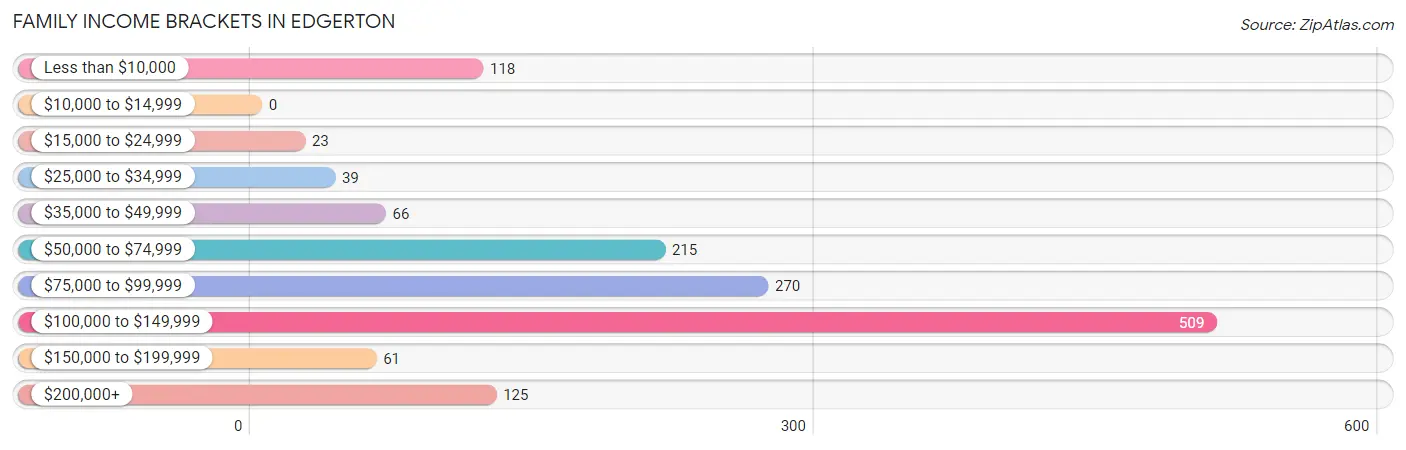
| Income Bracket | # Families | % Families |
| Less than $10,000 | 118 | 8.3% |
| $10,000 to $14,999 | 0 | 0.0% |
| $15,000 to $24,999 | 23 | 1.6% |
| $25,000 to $34,999 | 39 | 2.7% |
| $35,000 to $49,999 | 66 | 4.6% |
| $50,000 to $74,999 | 215 | 15.1% |
| $75,000 to $99,999 | 270 | 18.9% |
| $100,000 to $149,999 | 509 | 35.7% |
| $150,000 to $199,999 | 61 | 4.3% |
| $200,000+ | 125 | 8.8% |
Family Income by Famaliy Size in Edgerton
5-person families (59 | 4.1%) account for the highest median family income in Edgerton with $137,750 per family, while 2-person families (546 | 38.3%) have the highest median income of $43,958 per family member.
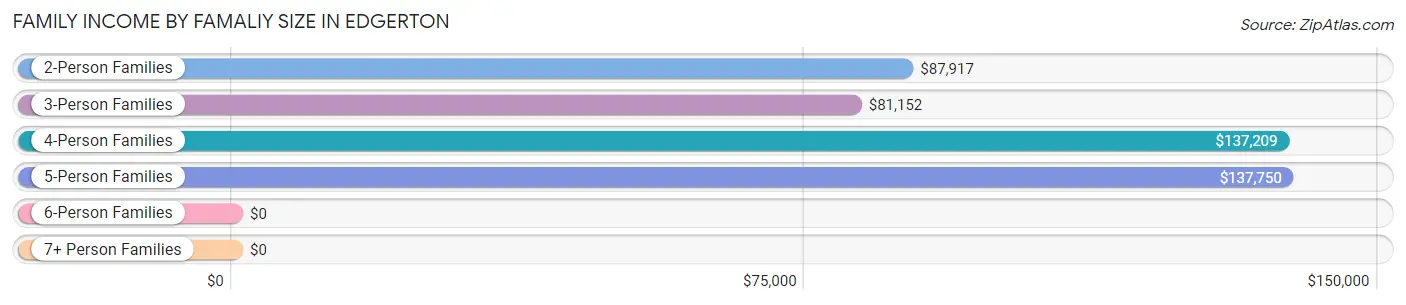
| Income Bracket | # Families | Median Income |
| 2-Person Families | 546 (38.3%) | $87,917 |
| 3-Person Families | 399 (28.0%) | $81,152 |
| 4-Person Families | 383 (26.9%) | $137,209 |
| 5-Person Families | 59 (4.1%) | $137,750 |
| 6-Person Families | 27 (1.9%) | $0 |
| 7+ Person Families | 12 (0.8%) | $0 |
| Total | 1,426 (100.0%) | $96,402 |
Family Income by Number of Earners in Edgerton
The median family income in Edgerton is $96,402, with families comprising 3+ earners (234) having the highest median family income of $135,870, while families with no earners (123) have the lowest median family income of $65,481, accounting for 16.4% and 8.6% of families, respectively.
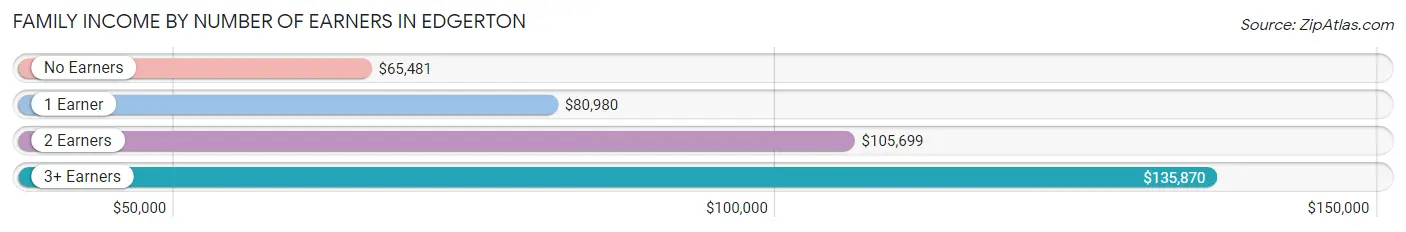
| Number of Earners | # Families | Median Income |
| No Earners | 123 (8.6%) | $65,481 |
| 1 Earner | 336 (23.6%) | $80,980 |
| 2 Earners | 733 (51.4%) | $105,699 |
| 3+ Earners | 234 (16.4%) | $135,870 |
| Total | 1,426 (100.0%) | $96,402 |
Household Income in Edgerton
Household Income Brackets in Edgerton
With 576 households falling in the category, the $100,000 to $149,999 income range is the most frequent in Edgerton, accounting for 25.5% of all households. In contrast, only 20 households (0.9%) fall into the less than $10,000 income bracket, making it the least populous group.
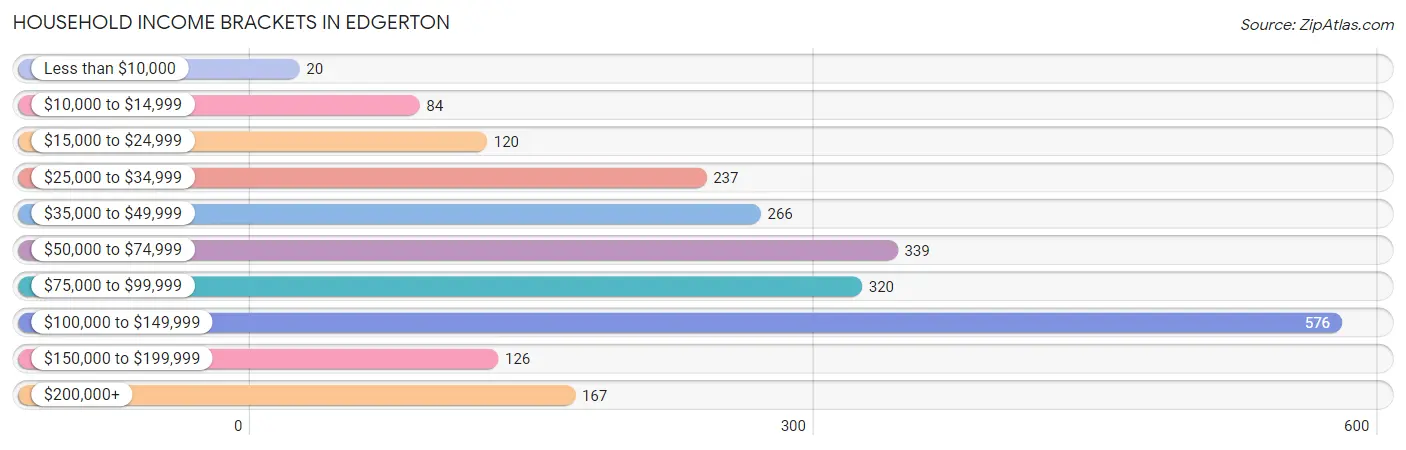
| Income Bracket | # Households | % Households |
| Less than $10,000 | 20 | 0.9% |
| $10,000 to $14,999 | 84 | 3.7% |
| $15,000 to $24,999 | 120 | 5.3% |
| $25,000 to $34,999 | 237 | 10.5% |
| $35,000 to $49,999 | 266 | 11.8% |
| $50,000 to $74,999 | 339 | 15.0% |
| $75,000 to $99,999 | 320 | 14.2% |
| $100,000 to $149,999 | 576 | 25.5% |
| $150,000 to $199,999 | 126 | 5.6% |
| $200,000+ | 167 | 7.4% |
Household Income by Householder Age in Edgerton
The median household income in Edgerton is $80,255, with the highest median household income of $109,655 found in the 45 to 64 years age bracket for the primary householder. A total of 788 households (34.9%) fall into this category. Meanwhile, the 65+ years age bracket for the primary householder has the lowest median household income of $29,911, with 608 households (26.9%) in this group.
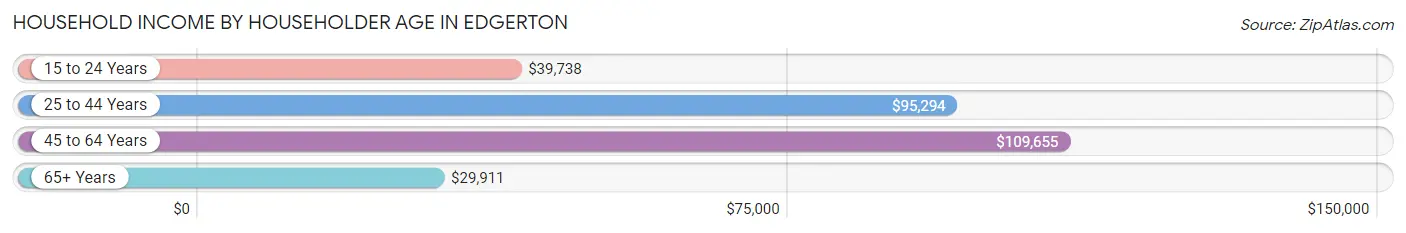
| Income Bracket | # Households | Median Income |
| 15 to 24 Years | 147 (6.5%) | $39,738 |
| 25 to 44 Years | 714 (31.6%) | $95,294 |
| 45 to 64 Years | 788 (34.9%) | $109,655 |
| 65+ Years | 608 (26.9%) | $29,911 |
| Total | 2,257 (100.0%) | $80,255 |
Poverty in Edgerton
Income Below Poverty by Sex and Age in Edgerton
With 4.9% poverty level for males and 13.7% for females among the residents of Edgerton, 15 year old males and 18 to 24 year old females are the most vulnerable to poverty, with 27 males (65.8%) and 135 females (54.2%) in their respective age groups living below the poverty level.
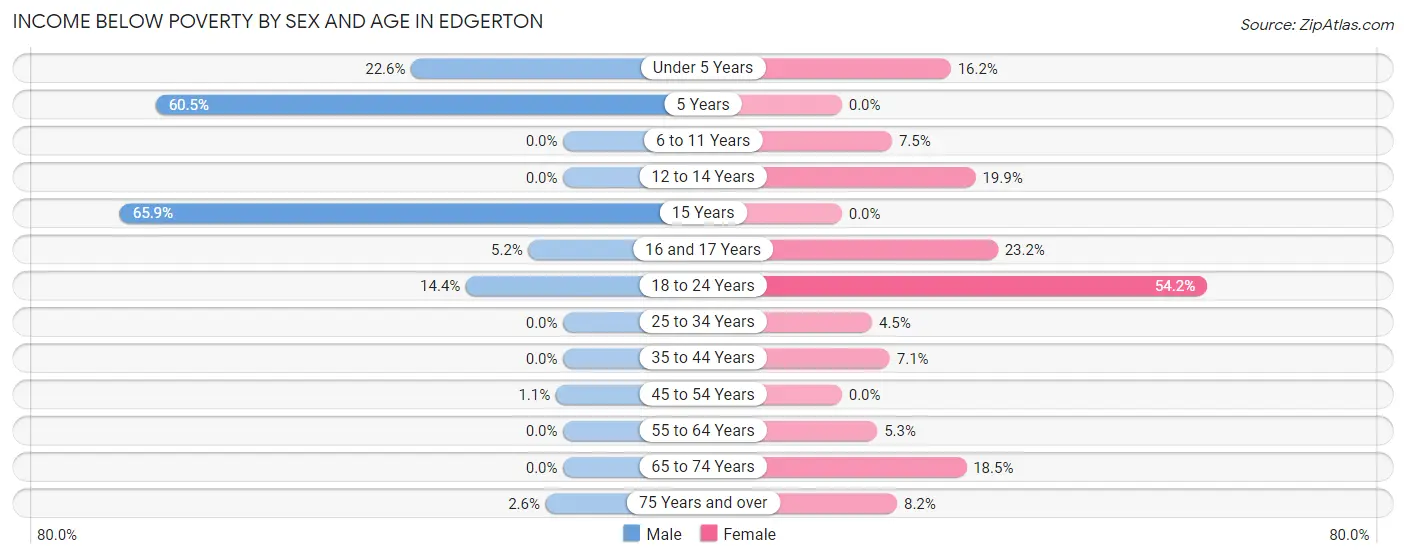
| Age Bracket | Male | Female |
| Under 5 Years | 42 (22.6%) | 27 (16.2%) |
| 5 Years | 23 (60.5%) | 0 (0.0%) |
| 6 to 11 Years | 0 (0.0%) | 14 (7.4%) |
| 12 to 14 Years | 0 (0.0%) | 26 (19.9%) |
| 15 Years | 27 (65.8%) | 0 (0.0%) |
| 16 and 17 Years | 5 (5.1%) | 50 (23.2%) |
| 18 to 24 Years | 42 (14.4%) | 135 (54.2%) |
| 25 to 34 Years | 0 (0.0%) | 16 (4.5%) |
| 35 to 44 Years | 0 (0.0%) | 22 (7.1%) |
| 45 to 54 Years | 4 (1.1%) | 0 (0.0%) |
| 55 to 64 Years | 0 (0.0%) | 16 (5.3%) |
| 65 to 74 Years | 0 (0.0%) | 56 (18.5%) |
| 75 Years and over | 4 (2.6%) | 15 (8.2%) |
| Total | 147 (4.9%) | 377 (13.7%) |
Income Above Poverty by Sex and Age in Edgerton
According to the poverty statistics in Edgerton, males aged 6 to 11 years and females aged 5 years are the age groups that are most secure financially, with 100.0% of males and 100.0% of females in these age groups living above the poverty line.
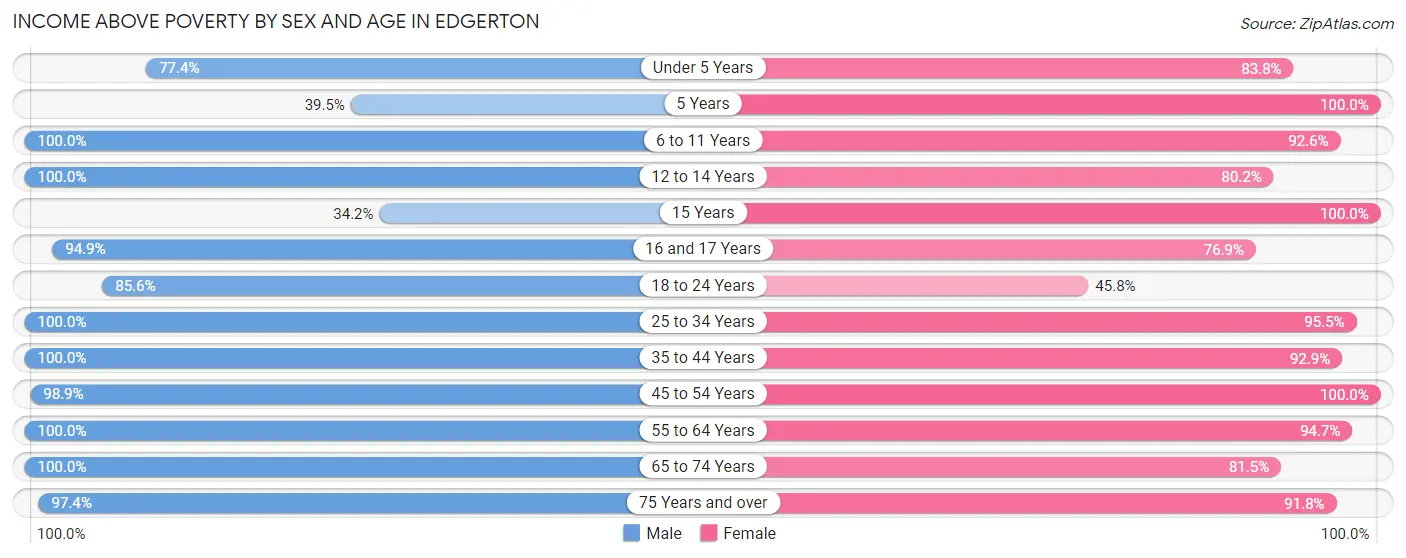
| Age Bracket | Male | Female |
| Under 5 Years | 144 (77.4%) | 140 (83.8%) |
| 5 Years | 15 (39.5%) | 10 (100.0%) |
| 6 to 11 Years | 291 (100.0%) | 174 (92.5%) |
| 12 to 14 Years | 162 (100.0%) | 105 (80.1%) |
| 15 Years | 14 (34.2%) | 8 (100.0%) |
| 16 and 17 Years | 92 (94.9%) | 166 (76.8%) |
| 18 to 24 Years | 249 (85.6%) | 114 (45.8%) |
| 25 to 34 Years | 442 (100.0%) | 340 (95.5%) |
| 35 to 44 Years | 436 (100.0%) | 286 (92.9%) |
| 45 to 54 Years | 365 (98.9%) | 330 (100.0%) |
| 55 to 64 Years | 275 (100.0%) | 288 (94.7%) |
| 65 to 74 Years | 249 (100.0%) | 247 (81.5%) |
| 75 Years and over | 149 (97.4%) | 168 (91.8%) |
| Total | 2,883 (95.2%) | 2,376 (86.3%) |
Income Below Poverty Among Married-Couple Families in Edgerton
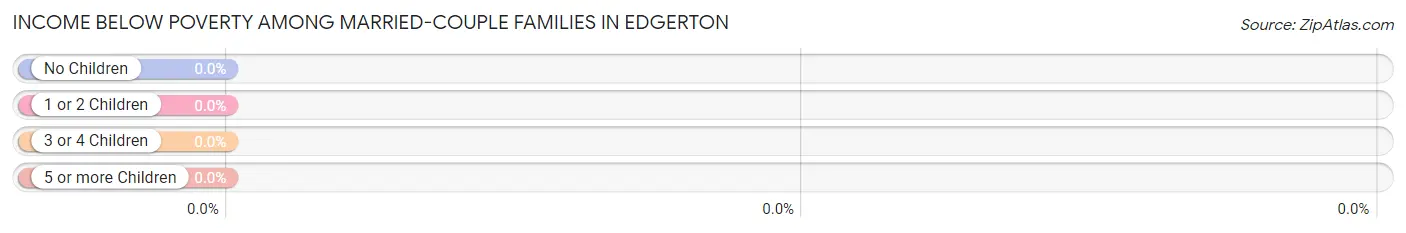
| Children | Above Poverty | Below Poverty |
| No Children | 527 (100.0%) | 0 (0.0%) |
| 1 or 2 Children | 412 (100.0%) | 0 (0.0%) |
| 3 or 4 Children | 55 (100.0%) | 0 (0.0%) |
| 5 or more Children | 0 (0.0%) | 0 (0.0%) |
| Total | 994 (100.0%) | 0 (0.0%) |
Income Below Poverty Among Single-Parent Households in Edgerton
According to the poverty data in Edgerton, 14.4% or 22 single-father households and 42.3% or 118 single-mother households are living below the poverty line. Among single-father households, those with no children have the highest poverty rate, with 4 households (22.2%) experiencing poverty. Likewise, among single-mother households, those with 3 or 4 children have the highest poverty rate, with 29 households (100.0%) falling below the poverty line.
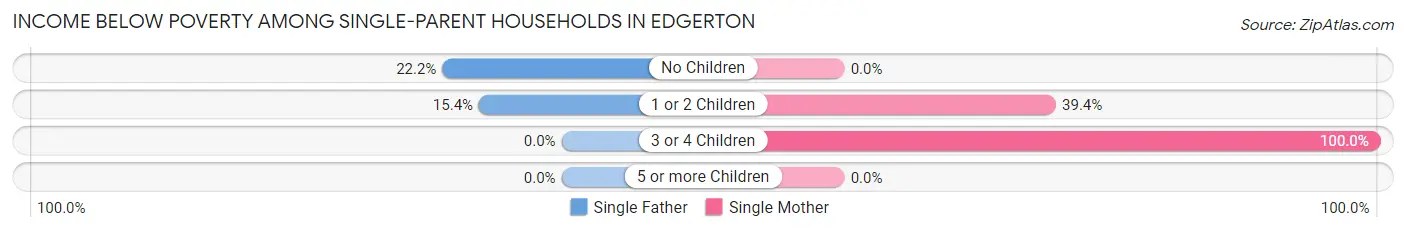
| Children | Single Father | Single Mother |
| No Children | 4 (22.2%) | 0 (0.0%) |
| 1 or 2 Children | 18 (15.4%) | 89 (39.4%) |
| 3 or 4 Children | 0 (0.0%) | 29 (100.0%) |
| 5 or more Children | 0 (0.0%) | 0 (0.0%) |
| Total | 22 (14.4%) | 118 (42.3%) |
Income Below Poverty Among Married-Couple vs Single-Parent Households in Edgerton
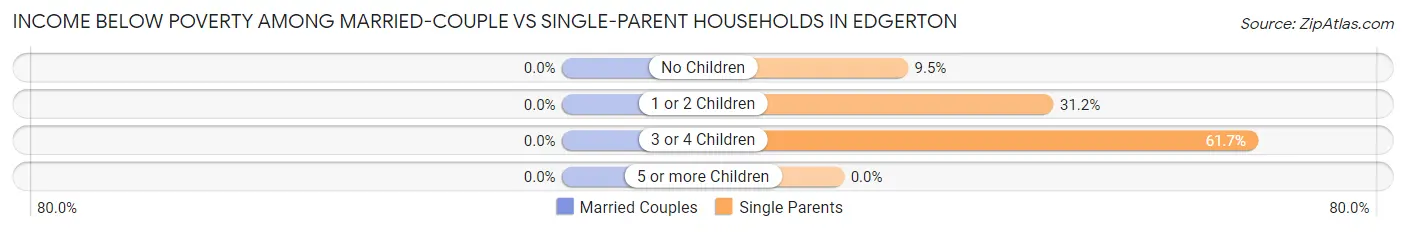
| Children | Married-Couple Families | Single-Parent Households |
| No Children | 0 (0.0%) | 4 (9.5%) |
| 1 or 2 Children | 0 (0.0%) | 107 (31.2%) |
| 3 or 4 Children | 0 (0.0%) | 29 (61.7%) |
| 5 or more Children | 0 (0.0%) | 0 (0.0%) |
| Total | 0 (0.0%) | 140 (32.4%) |
Race in Edgerton
The most populous races in Edgerton are White / Caucasian (4,985 | 84.8%), Hispanic or Latino (651 | 11.1%), and Some other Race (474 | 8.1%).
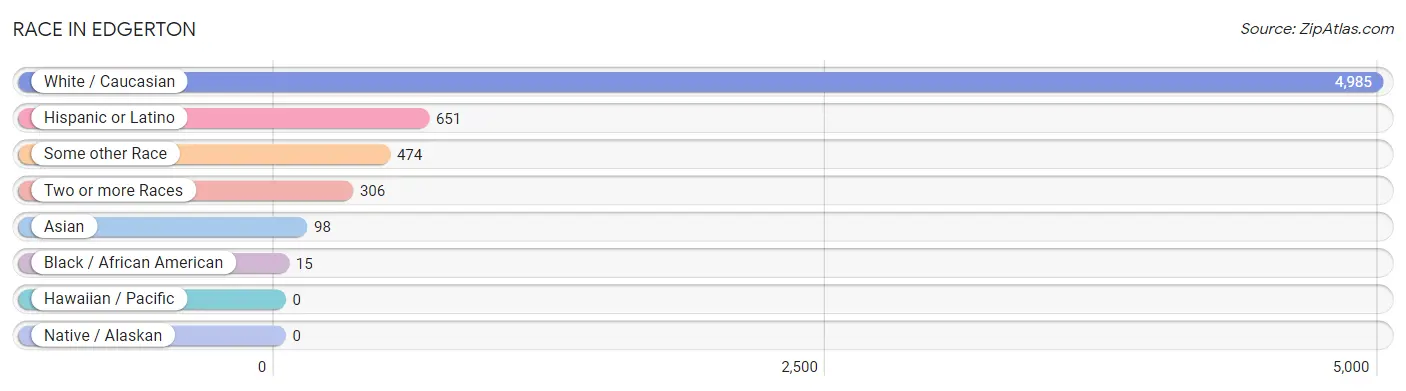
| Race | # Population | % Population |
| Asian | 98 | 1.7% |
| Black / African American | 15 | 0.3% |
| Hawaiian / Pacific | 0 | 0.0% |
| Hispanic or Latino | 651 | 11.1% |
| Native / Alaskan | 0 | 0.0% |
| White / Caucasian | 4,985 | 84.8% |
| Two or more Races | 306 | 5.2% |
| Some other Race | 474 | 8.1% |
| Total | 5,878 | 100.0% |
Ancestry in Edgerton
The most populous ancestries reported in Edgerton are German (1,978 | 33.7%), Norwegian (1,107 | 18.8%), Irish (804 | 13.7%), English (692 | 11.8%), and Mexican (598 | 10.2%), together accounting for 88.1% of all Edgerton residents.
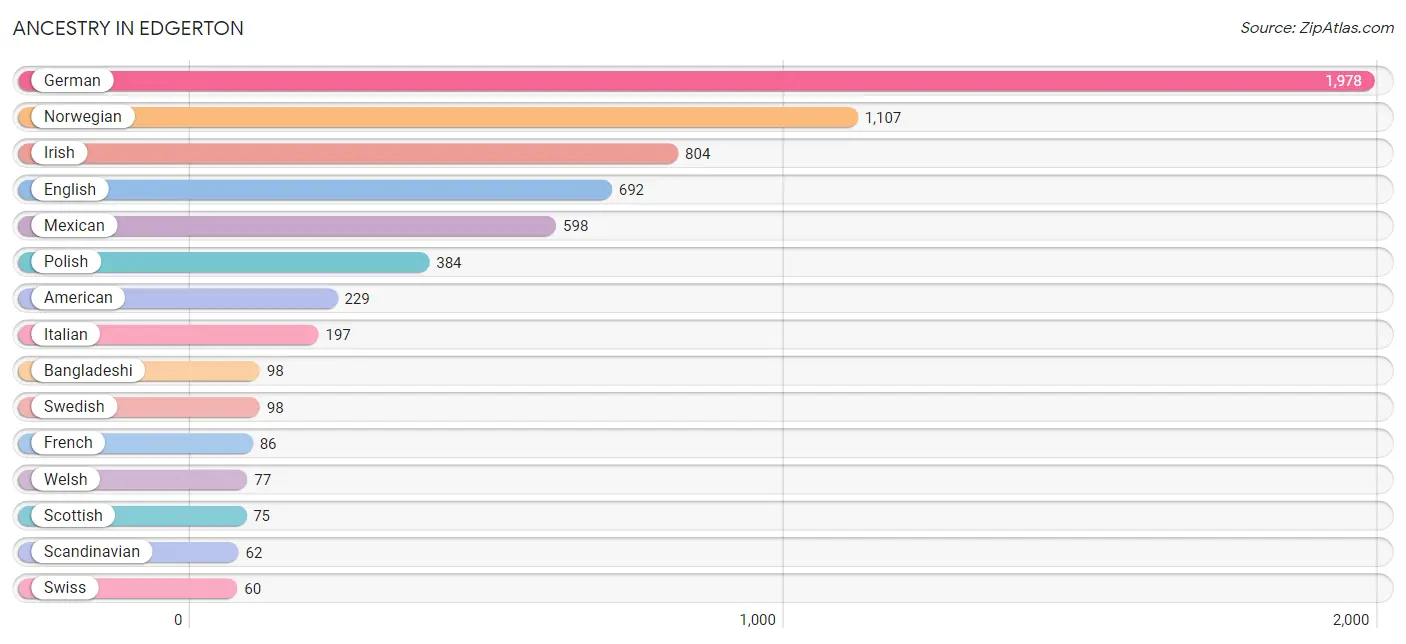
| Ancestry | # Population | % Population |
| American | 229 | 3.9% |
| Arab | 15 | 0.3% |
| Armenian | 8 | 0.1% |
| Austrian | 17 | 0.3% |
| Bangladeshi | 98 | 1.7% |
| Cherokee | 14 | 0.2% |
| Czech | 31 | 0.5% |
| Danish | 28 | 0.5% |
| Dutch | 57 | 1.0% |
| Eastern European | 8 | 0.1% |
| Egyptian | 15 | 0.3% |
| English | 692 | 11.8% |
| European | 25 | 0.4% |
| Finnish | 18 | 0.3% |
| French | 86 | 1.5% |
| German | 1,978 | 33.7% |
| Greek | 26 | 0.4% |
| Hungarian | 9 | 0.2% |
| Irish | 804 | 13.7% |
| Iroquois | 16 | 0.3% |
| Italian | 197 | 3.4% |
| Lithuanian | 20 | 0.3% |
| Mexican | 598 | 10.2% |
| Northern European | 16 | 0.3% |
| Norwegian | 1,107 | 18.8% |
| Polish | 384 | 6.5% |
| Puerto Rican | 37 | 0.6% |
| Russian | 9 | 0.2% |
| Scandinavian | 62 | 1.1% |
| Scotch-Irish | 24 | 0.4% |
| Scottish | 75 | 1.3% |
| Serbian | 12 | 0.2% |
| Slavic | 17 | 0.3% |
| Swedish | 98 | 1.7% |
| Swiss | 60 | 1.0% |
| Welsh | 77 | 1.3% | View All 36 Rows |
Immigrants in Edgerton
The most numerous immigrant groups reported in Edgerton came from Central America (301 | 5.1%), Latin America (301 | 5.1%), Mexico (301 | 5.1%), Africa (15 | 0.3%), and Egypt (15 | 0.3%), together accounting for 15.9% of all Edgerton residents.
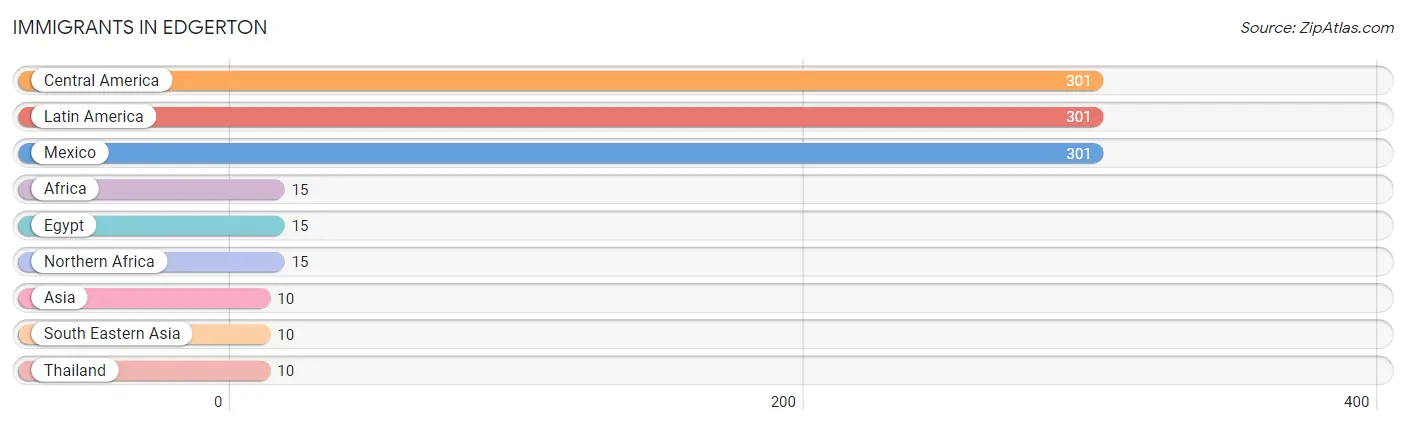
| Immigration Origin | # Population | % Population |
| Africa | 15 | 0.3% |
| Asia | 10 | 0.2% |
| Central America | 301 | 5.1% |
| Egypt | 15 | 0.3% |
| Latin America | 301 | 5.1% |
| Mexico | 301 | 5.1% |
| Northern Africa | 15 | 0.3% |
| South Eastern Asia | 10 | 0.2% |
| Thailand | 10 | 0.2% | View All 9 Rows |
Sex and Age in Edgerton
Sex and Age in Edgerton
The most populous age groups in Edgerton are 10 to 14 Years (336 | 10.9%) for men and 65 to 69 Years (288 | 10.3%) for women.
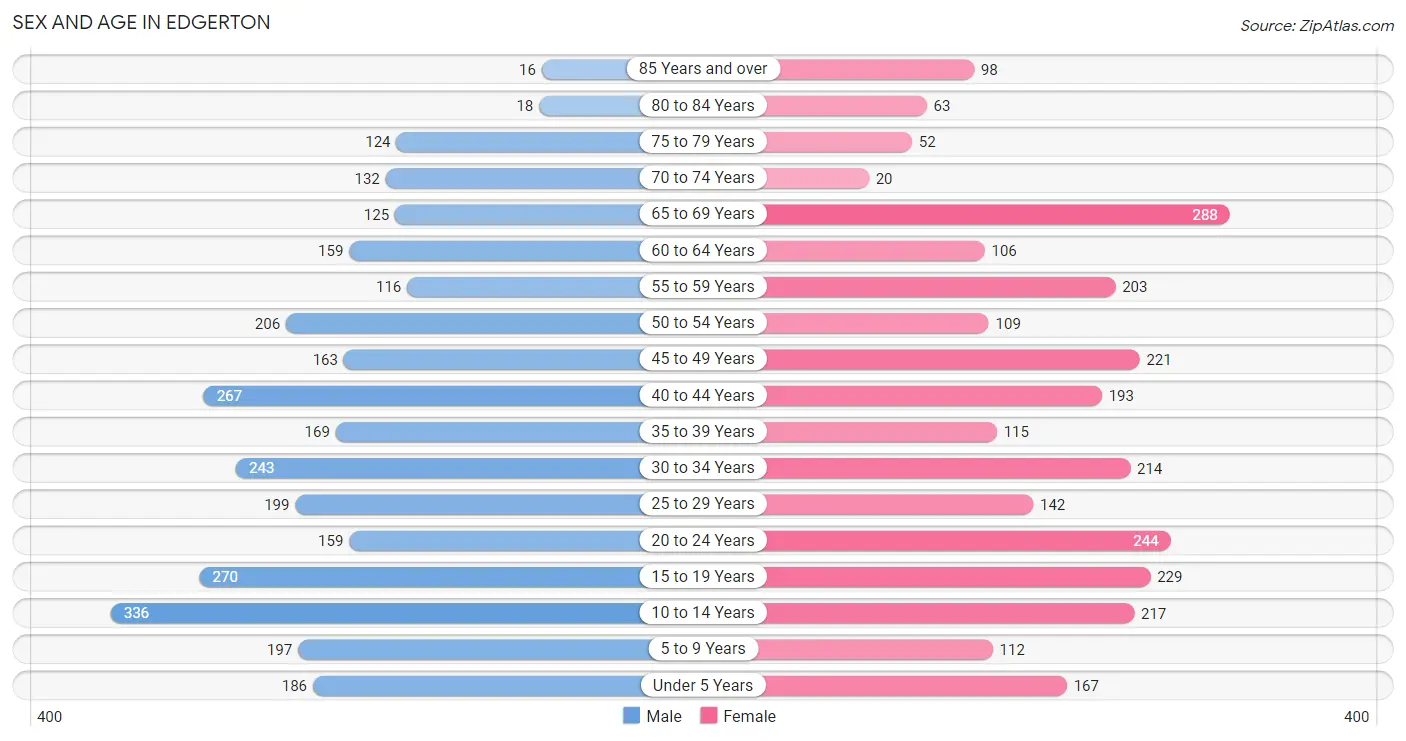
| Age Bracket | Male | Female |
| Under 5 Years | 186 (6.0%) | 167 (6.0%) |
| 5 to 9 Years | 197 (6.4%) | 112 (4.0%) |
| 10 to 14 Years | 336 (10.9%) | 217 (7.8%) |
| 15 to 19 Years | 270 (8.7%) | 229 (8.2%) |
| 20 to 24 Years | 159 (5.1%) | 244 (8.7%) |
| 25 to 29 Years | 199 (6.5%) | 142 (5.1%) |
| 30 to 34 Years | 243 (7.9%) | 214 (7.7%) |
| 35 to 39 Years | 169 (5.5%) | 115 (4.1%) |
| 40 to 44 Years | 267 (8.6%) | 193 (6.9%) |
| 45 to 49 Years | 163 (5.3%) | 221 (7.9%) |
| 50 to 54 Years | 206 (6.7%) | 109 (3.9%) |
| 55 to 59 Years | 116 (3.8%) | 203 (7.3%) |
| 60 to 64 Years | 159 (5.1%) | 106 (3.8%) |
| 65 to 69 Years | 125 (4.1%) | 288 (10.3%) |
| 70 to 74 Years | 132 (4.3%) | 20 (0.7%) |
| 75 to 79 Years | 124 (4.0%) | 52 (1.9%) |
| 80 to 84 Years | 18 (0.6%) | 63 (2.3%) |
| 85 Years and over | 16 (0.5%) | 98 (3.5%) |
| Total | 3,085 (100.0%) | 2,793 (100.0%) |
Families and Households in Edgerton
Median Family Size in Edgerton
The median family size in Edgerton is 3.16 persons per family, with married-couple families (994 | 69.7%) accounting for the largest median family size of 3.27 persons per family. On the other hand, single male/father families (153 | 10.7%) represent the smallest median family size with 2.81 persons per family.
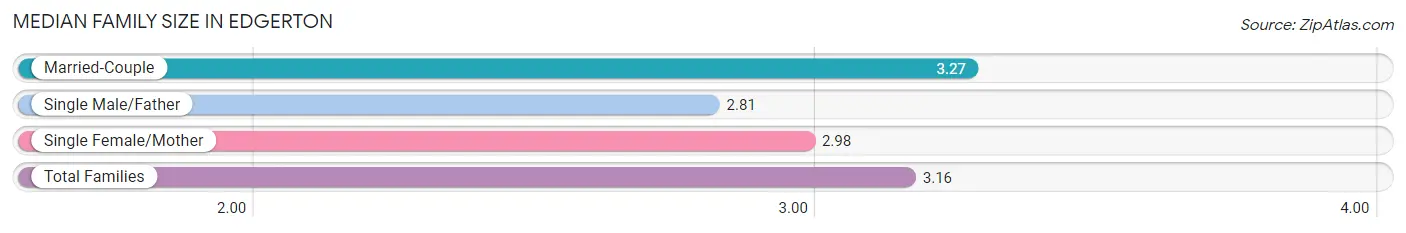
| Family Type | # Families | Family Size |
| Married-Couple | 994 (69.7%) | 3.27 |
| Single Male/Father | 153 (10.7%) | 2.81 |
| Single Female/Mother | 279 (19.6%) | 2.98 |
| Total Families | 1,426 (100.0%) | 3.16 |
Median Household Size in Edgerton
The median household size in Edgerton is 2.58 persons per household, with single female/mother households (279 | 12.4%) accounting for the largest median household size of 3.6 persons per household. non-family households (831 | 36.8%) represent the smallest median household size with 1.31 persons per household.
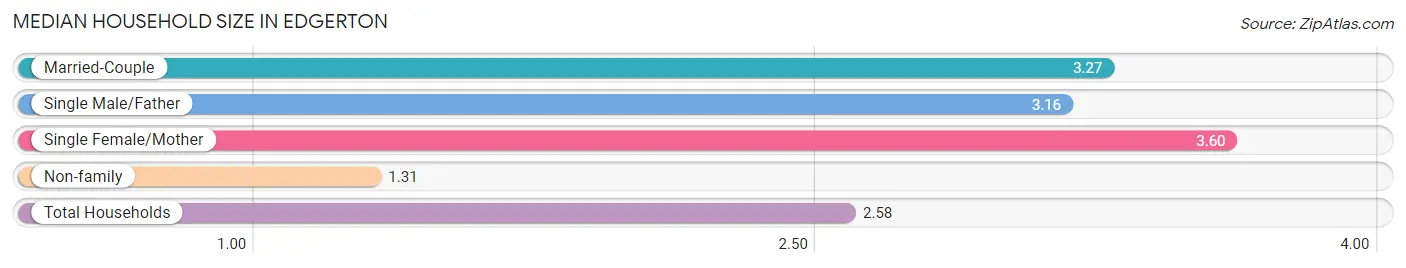
| Household Type | # Households | Household Size |
| Married-Couple | 994 (44.0%) | 3.27 |
| Single Male/Father | 153 (6.8%) | 3.16 |
| Single Female/Mother | 279 (12.4%) | 3.60 |
| Non-family | 831 (36.8%) | 1.31 |
| Total Households | 2,257 (100.0%) | 2.58 |
Household Size by Marriage Status in Edgerton
Out of a total of 2,257 households in Edgerton, 1,426 (63.2%) are family households, while 831 (36.8%) are nonfamily households. The most numerous type of family households are 4-person households, comprising 454, and the most common type of nonfamily households are 1-person households, comprising 628.
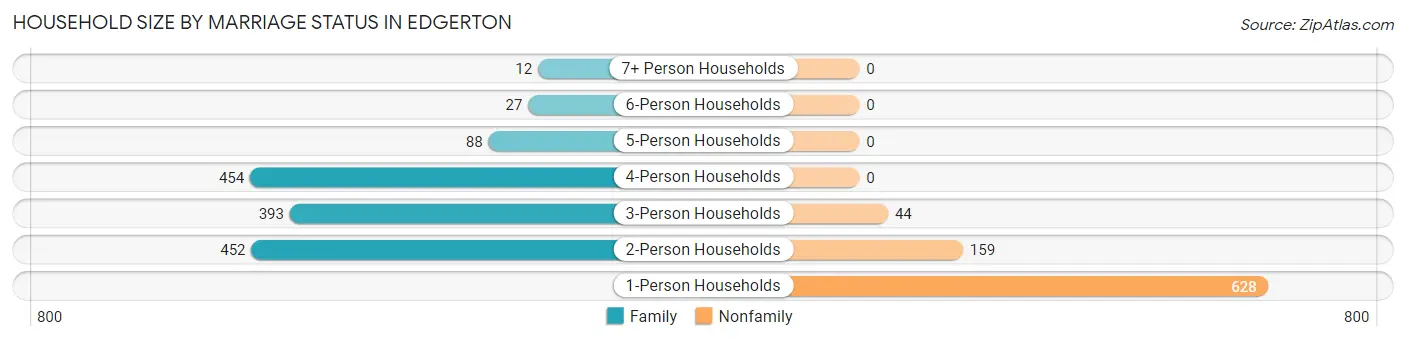
| Household Size | Family Households | Nonfamily Households |
| 1-Person Households | - | 628 (27.8%) |
| 2-Person Households | 452 (20.0%) | 159 (7.0%) |
| 3-Person Households | 393 (17.4%) | 44 (1.9%) |
| 4-Person Households | 454 (20.1%) | 0 (0.0%) |
| 5-Person Households | 88 (3.9%) | 0 (0.0%) |
| 6-Person Households | 27 (1.2%) | 0 (0.0%) |
| 7+ Person Households | 12 (0.5%) | 0 (0.0%) |
| Total | 1,426 (63.2%) | 831 (36.8%) |
Female Fertility in Edgerton
Fertility by Age in Edgerton
Average fertility rate in Edgerton is 75.0 births per 1,000 women. Women in the age bracket of 20 to 34 years have the highest fertility rate with 177.0 births per 1,000 women. Women in the age bracket of 20 to 34 years acount for 100.0% of all women with births.
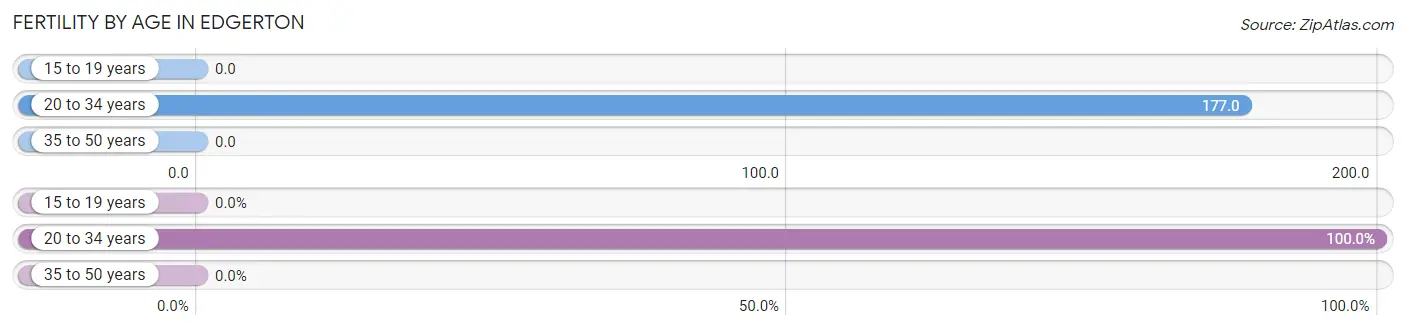
| Age Bracket | Women with Births | Births / 1,000 Women |
| 15 to 19 years | 0 (0.0%) | 0.0 |
| 20 to 34 years | 106 (100.0%) | 177.0 |
| 35 to 50 years | 0 (0.0%) | 0.0 |
| Total | 106 (100.0%) | 75.0 |
Fertility by Age by Marriage Status in Edgerton
72.6% of women with births (106) in Edgerton are married. The highest percentage of unmarried women with births falls into 20 to 34 years age bracket with 27.4% of them unmarried at the time of birth, while the lowest percentage of unmarried women with births belong to 20 to 34 years age bracket with 27.4% of them unmarried.
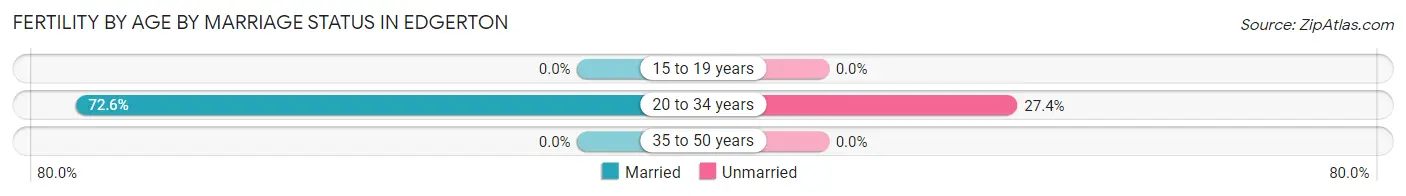
| Age Bracket | Married | Unmarried |
| 15 to 19 years | 0 (0.0%) | 0 (0.0%) |
| 20 to 34 years | 77 (72.6%) | 29 (27.4%) |
| 35 to 50 years | 0 (0.0%) | 0 (0.0%) |
| Total | 77 (72.6%) | 29 (27.4%) |
Fertility by Education in Edgerton
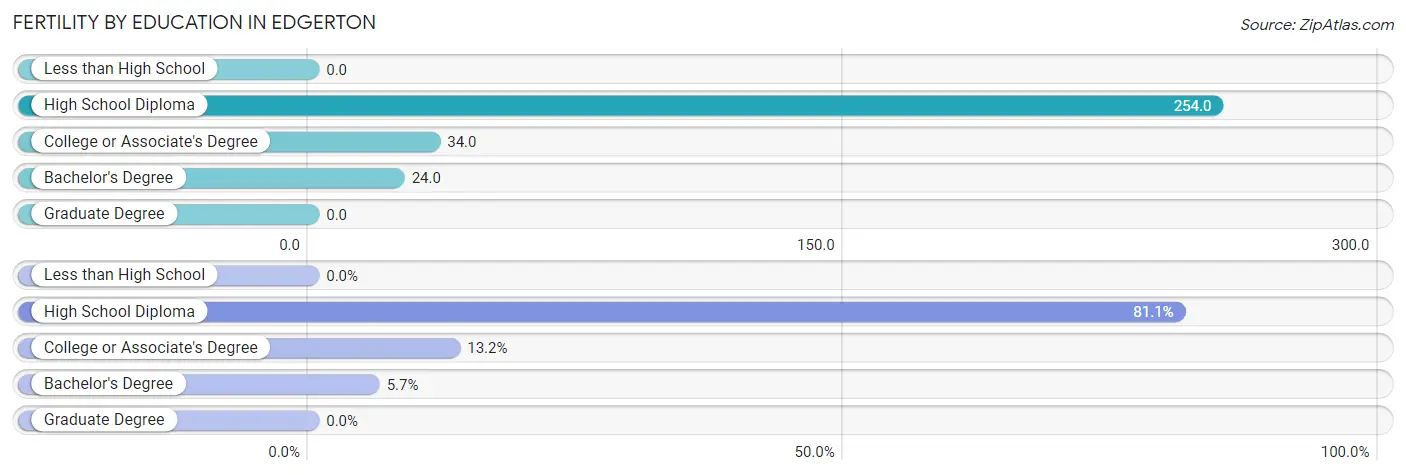
| Educational Attainment | Women with Births | Births / 1,000 Women |
| Less than High School | 0 (0.0%) | 0.0 |
| High School Diploma | 86 (81.1%) | 254.0 |
| College or Associate's Degree | 14 (13.2%) | 34.0 |
| Bachelor's Degree | 6 (5.7%) | 24.0 |
| Graduate Degree | 0 (0.0%) | 0.0 |
| Total | 106 (100.0%) | 75.0 |
Fertility by Education by Marriage Status in Edgerton
27.4% of women with births in Edgerton are unmarried. Women with the educational attainment of college or associate's degree are most likely to be married with 100.0% of them married at childbirth, while women with the educational attainment of high school diploma are least likely to be married with 33.7% of them unmarried at childbirth.
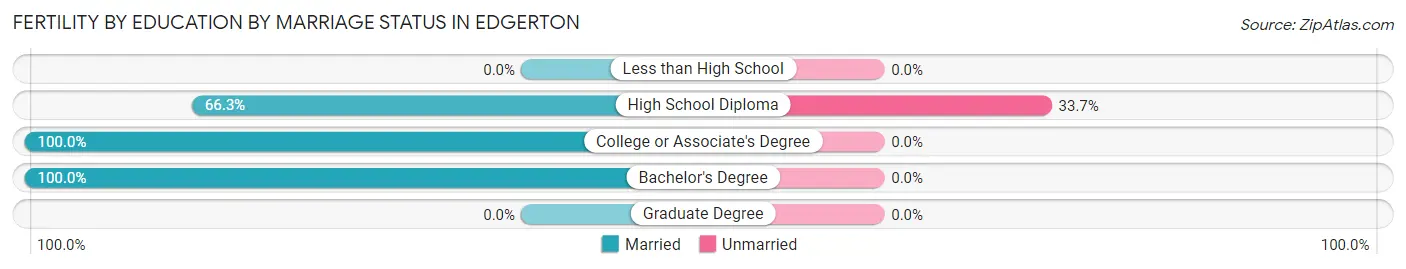
| Educational Attainment | Married | Unmarried |
| Less than High School | 0 (0.0%) | 0 (0.0%) |
| High School Diploma | 57 (66.3%) | 29 (33.7%) |
| College or Associate's Degree | 14 (100.0%) | 0 (0.0%) |
| Bachelor's Degree | 6 (100.0%) | 0 (0.0%) |
| Graduate Degree | 0 (0.0%) | 0 (0.0%) |
| Total | 77 (72.6%) | 29 (27.4%) |
Employment Characteristics in Edgerton
Employment by Class of Employer in Edgerton
Among the 2,894 employed individuals in Edgerton, private company employees (2,150 | 74.3%), not-for-profit organizations (279 | 9.6%), and local government employees (157 | 5.4%) make up the most common classes of employment.
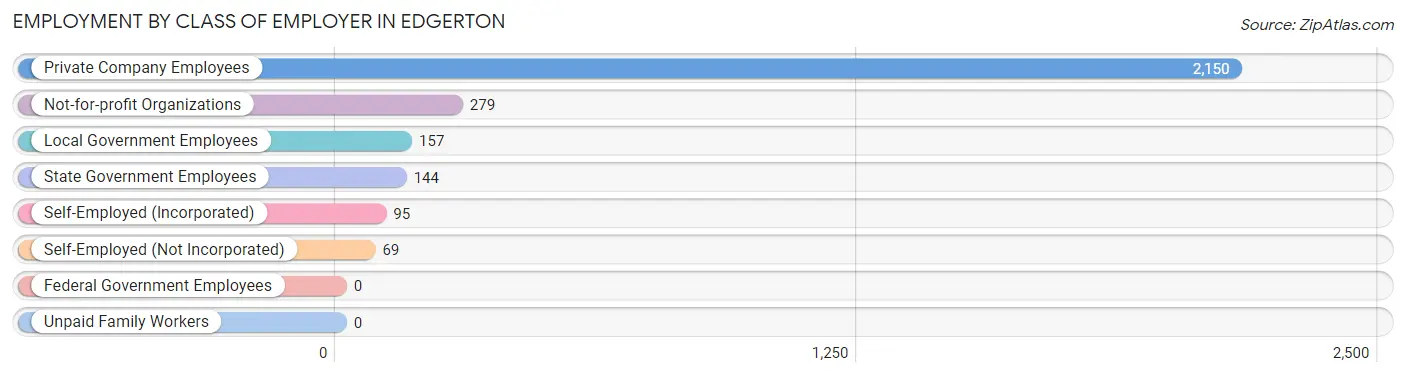
| Employer Class | # Employees | % Employees |
| Private Company Employees | 2,150 | 74.3% |
| Self-Employed (Incorporated) | 95 | 3.3% |
| Self-Employed (Not Incorporated) | 69 | 2.4% |
| Not-for-profit Organizations | 279 | 9.6% |
| Local Government Employees | 157 | 5.4% |
| State Government Employees | 144 | 5.0% |
| Federal Government Employees | 0 | 0.0% |
| Unpaid Family Workers | 0 | 0.0% |
| Total | 2,894 | 100.0% |
Employment Status by Age in Edgerton
According to the labor force statistics for Edgerton, out of the total population over 16 years of age (4,614), 69.1% or 3,188 individuals are in the labor force, with 4.7% or 150 of them unemployed. The age group with the highest labor force participation rate is 30 to 34 years, with 100.0% or 457 individuals in the labor force. Within the labor force, the 20 to 24 years age range has the highest percentage of unemployed individuals, with 24.8% or 80 of them being unemployed.
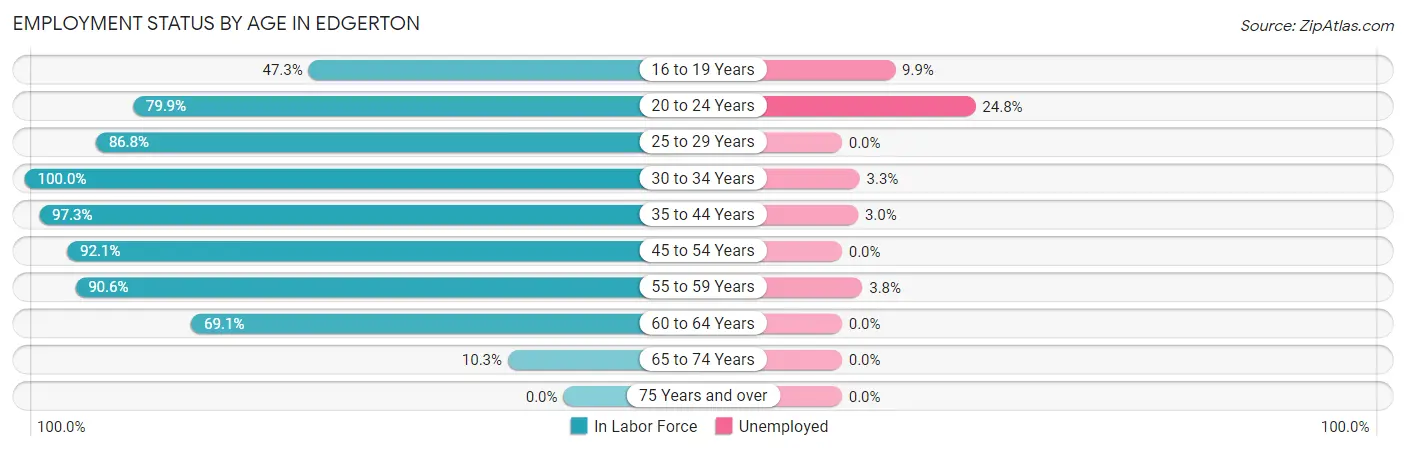
| Age Bracket | In Labor Force | Unemployed |
| 16 to 19 Years | 213 (47.3%) | 21 (9.9%) |
| 20 to 24 Years | 322 (79.9%) | 80 (24.8%) |
| 25 to 29 Years | 296 (86.8%) | 0 (0.0%) |
| 30 to 34 Years | 457 (100.0%) | 15 (3.3%) |
| 35 to 44 Years | 724 (97.3%) | 22 (3.0%) |
| 45 to 54 Years | 644 (92.1%) | 0 (0.0%) |
| 55 to 59 Years | 289 (90.6%) | 11 (3.8%) |
| 60 to 64 Years | 183 (69.1%) | 0 (0.0%) |
| 65 to 74 Years | 58 (10.3%) | 0 (0.0%) |
| 75 Years and over | 0 (0.0%) | 0 (0.0%) |
| Total | 3,188 (69.1%) | 150 (4.7%) |
Employment Status by Educational Attainment in Edgerton
According to labor force statistics for Edgerton, 91.8% of individuals (2,593) out of the total population between 25 and 64 years of age (2,825) are in the labor force, with 1.9% or 49 of them being unemployed. The group with the highest labor force participation rate are those with the educational attainment of high school diploma, with 93.4% or 713 individuals in the labor force. Within the labor force, individuals with college / associate degree education have the highest percentage of unemployment, with 2.4% or 22 of them being unemployed.
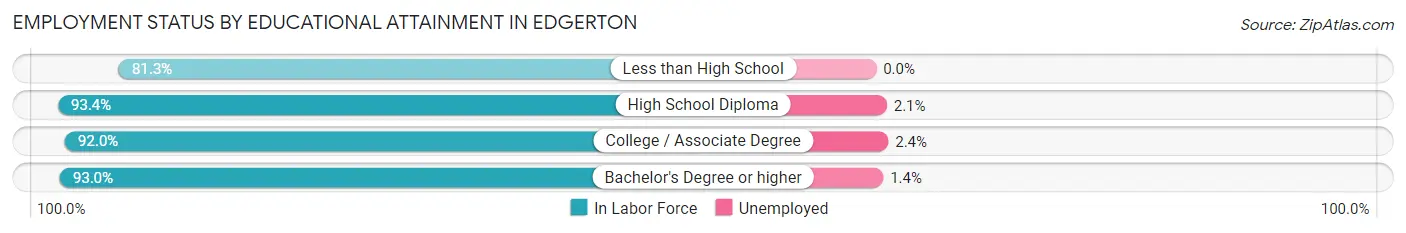
| Educational Attainment | In Labor Force | Unemployed |
| Less than High School | 195 (81.3%) | 0 (0.0%) |
| High School Diploma | 713 (93.4%) | 16 (2.1%) |
| College / Associate Degree | 900 (92.0%) | 23 (2.4%) |
| Bachelor's Degree or higher | 785 (93.0%) | 12 (1.4%) |
| Total | 2,593 (91.8%) | 54 (1.9%) |
Employment Occupations by Sex in Edgerton
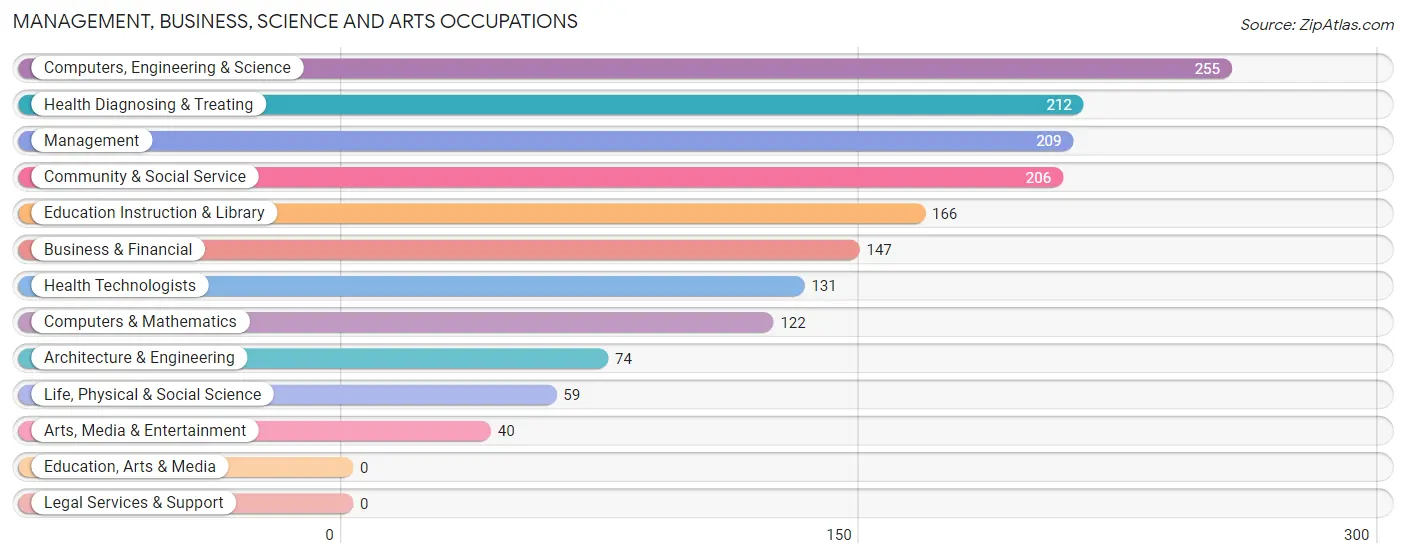
Management, Business, Science and Arts Occupations
The most common Management, Business, Science and Arts occupations in Edgerton are Computers, Engineering & Science (255 | 8.4%), Health Diagnosing & Treating (212 | 7.0%), Management (209 | 6.9%), Community & Social Service (206 | 6.8%), and Education Instruction & Library (166 | 5.5%).
Management, Business, Science and Arts Occupations by Sex
Within the Management, Business, Science and Arts occupations in Edgerton, the most male-oriented occupations are Architecture & Engineering (100.0%), Computers & Mathematics (85.3%), and Computers, Engineering & Science (79.2%), while the most female-oriented occupations are Arts, Media & Entertainment (100.0%), Health Diagnosing & Treating (100.0%), and Health Technologists (100.0%).
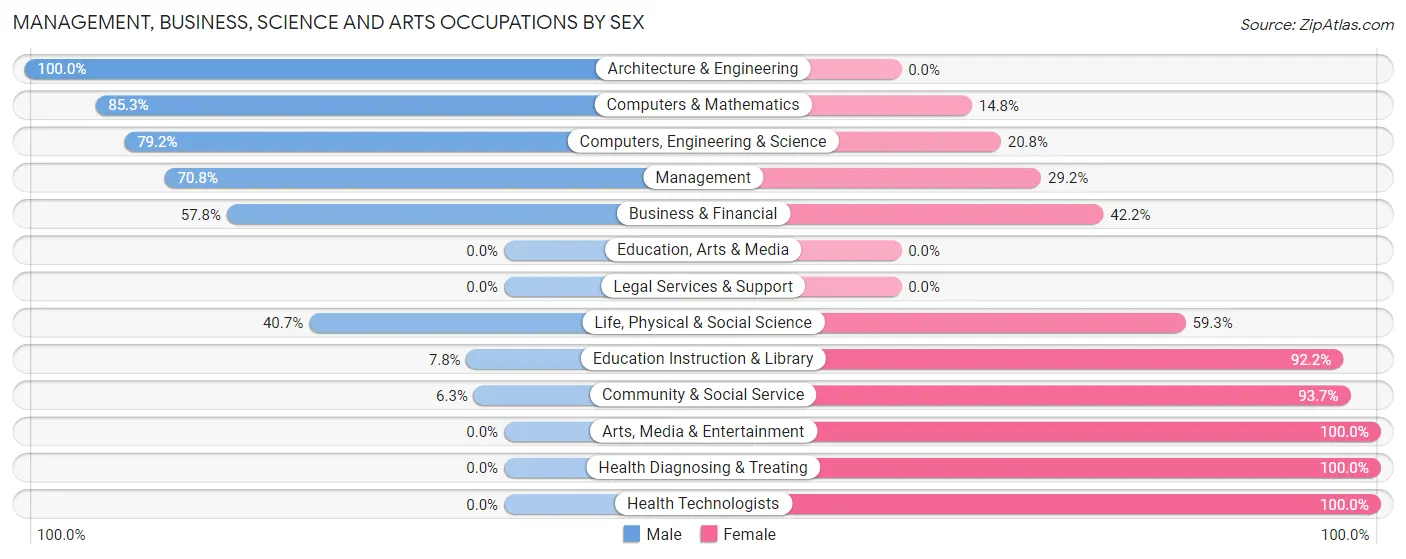
| Occupation | Male | Female |
| Management | 148 (70.8%) | 61 (29.2%) |
| Business & Financial | 85 (57.8%) | 62 (42.2%) |
| Computers, Engineering & Science | 202 (79.2%) | 53 (20.8%) |
| Computers & Mathematics | 104 (85.3%) | 18 (14.7%) |
| Architecture & Engineering | 74 (100.0%) | 0 (0.0%) |
| Life, Physical & Social Science | 24 (40.7%) | 35 (59.3%) |
| Community & Social Service | 13 (6.3%) | 193 (93.7%) |
| Education, Arts & Media | 0 (0.0%) | 0 (0.0%) |
| Legal Services & Support | 0 (0.0%) | 0 (0.0%) |
| Education Instruction & Library | 13 (7.8%) | 153 (92.2%) |
| Arts, Media & Entertainment | 0 (0.0%) | 40 (100.0%) |
| Health Diagnosing & Treating | 0 (0.0%) | 212 (100.0%) |
| Health Technologists | 0 (0.0%) | 131 (100.0%) |
| Total (Category) | 448 (43.5%) | 581 (56.5%) |
| Total (Overall) | 1,675 (55.1%) | 1,362 (44.9%) |
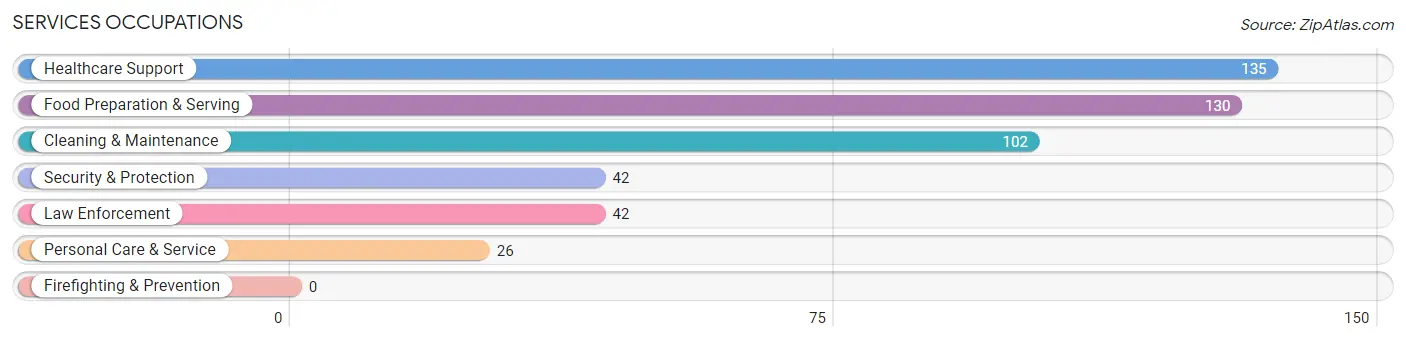
Services Occupations
The most common Services occupations in Edgerton are Healthcare Support (135 | 4.4%), Food Preparation & Serving (130 | 4.3%), Cleaning & Maintenance (102 | 3.4%), Security & Protection (42 | 1.4%), and Law Enforcement (42 | 1.4%).
Services Occupations by Sex
Within the Services occupations in Edgerton, the most male-oriented occupations are Security & Protection (100.0%), Law Enforcement (100.0%), and Cleaning & Maintenance (54.9%), while the most female-oriented occupations are Healthcare Support (100.0%), Personal Care & Service (100.0%), and Food Preparation & Serving (47.7%).
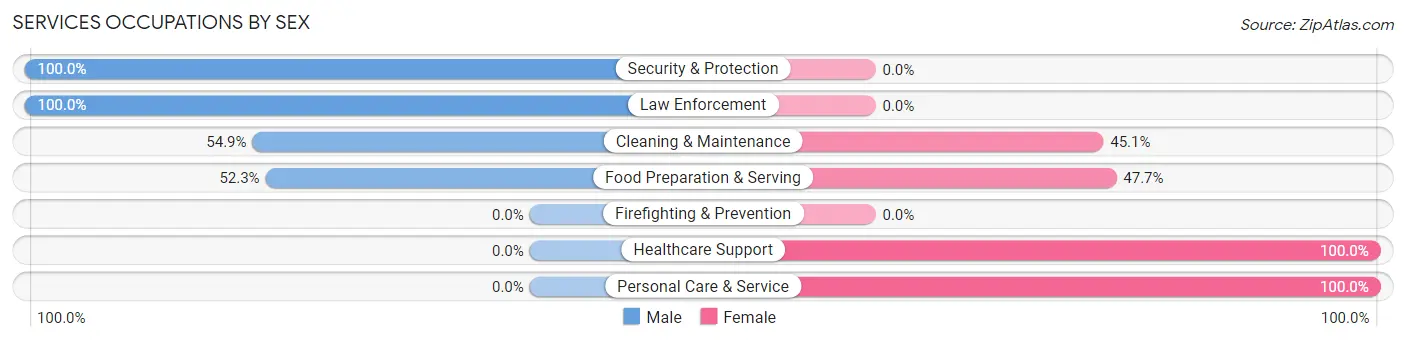
| Occupation | Male | Female |
| Healthcare Support | 0 (0.0%) | 135 (100.0%) |
| Security & Protection | 42 (100.0%) | 0 (0.0%) |
| Firefighting & Prevention | 0 (0.0%) | 0 (0.0%) |
| Law Enforcement | 42 (100.0%) | 0 (0.0%) |
| Food Preparation & Serving | 68 (52.3%) | 62 (47.7%) |
| Cleaning & Maintenance | 56 (54.9%) | 46 (45.1%) |
| Personal Care & Service | 0 (0.0%) | 26 (100.0%) |
| Total (Category) | 166 (38.2%) | 269 (61.8%) |
| Total (Overall) | 1,675 (55.1%) | 1,362 (44.9%) |
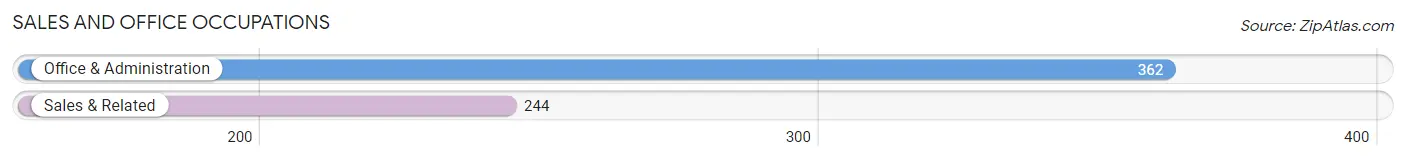
Sales and Office Occupations
The most common Sales and Office occupations in Edgerton are Office & Administration (362 | 11.9%), and Sales & Related (244 | 8.0%).
Sales and Office Occupations by Sex
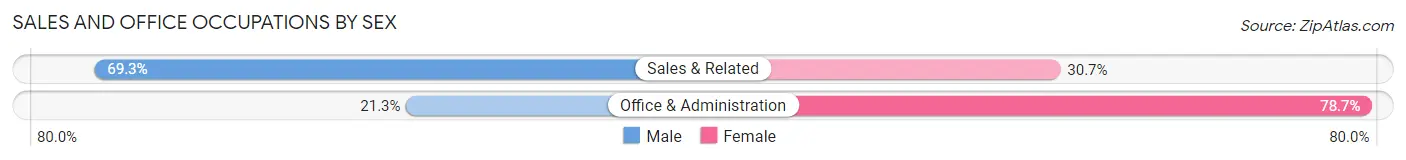
| Occupation | Male | Female |
| Sales & Related | 169 (69.3%) | 75 (30.7%) |
| Office & Administration | 77 (21.3%) | 285 (78.7%) |
| Total (Category) | 246 (40.6%) | 360 (59.4%) |
| Total (Overall) | 1,675 (55.1%) | 1,362 (44.9%) |
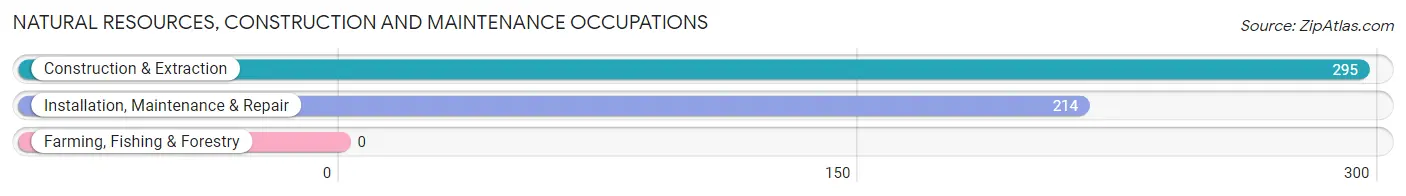
Natural Resources, Construction and Maintenance Occupations
The most common Natural Resources, Construction and Maintenance occupations in Edgerton are Construction & Extraction (295 | 9.7%), and Installation, Maintenance & Repair (214 | 7.0%).
Natural Resources, Construction and Maintenance Occupations by Sex
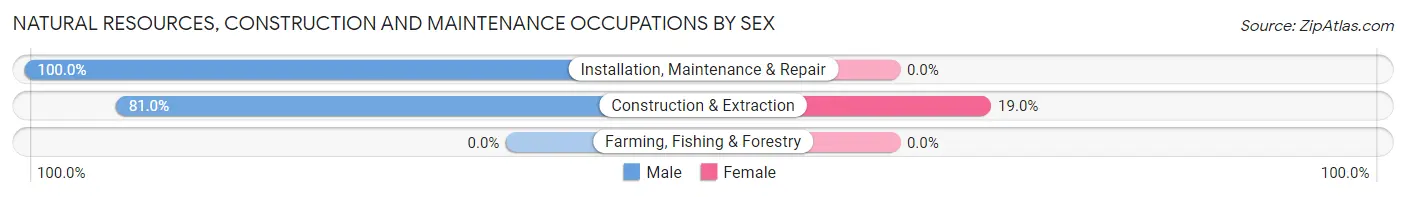
| Occupation | Male | Female |
| Farming, Fishing & Forestry | 0 (0.0%) | 0 (0.0%) |
| Construction & Extraction | 239 (81.0%) | 56 (19.0%) |
| Installation, Maintenance & Repair | 214 (100.0%) | 0 (0.0%) |
| Total (Category) | 453 (89.0%) | 56 (11.0%) |
| Total (Overall) | 1,675 (55.1%) | 1,362 (44.9%) |
Production, Transportation and Moving Occupations
The most common Production, Transportation and Moving occupations in Edgerton are Production (304 | 10.0%), Material Moving (89 | 2.9%), and Transportation (65 | 2.1%).
Production, Transportation and Moving Occupations by Sex
| Occupation | Male | Female |
| Production | 234 (77.0%) | 70 (23.0%) |
| Transportation | 65 (100.0%) | 0 (0.0%) |
| Material Moving | 63 (70.8%) | 26 (29.2%) |
| Total (Category) | 362 (79.0%) | 96 (21.0%) |
| Total (Overall) | 1,675 (55.1%) | 1,362 (44.9%) |
Employment Industries by Sex in Edgerton
Employment Industries in Edgerton
The major employment industries in Edgerton include Health Care & Social Assistance (573 | 18.9%), Manufacturing (533 | 17.5%), Construction (329 | 10.8%), Retail Trade (320 | 10.5%), and Educational Services (263 | 8.7%).
Employment Industries by Sex in Edgerton
The Edgerton industries that see more men than women are Agriculture, Fishing & Hunting (100.0%), Transportation & Warehousing (100.0%), and Utilities (100.0%), whereas the industries that tend to have a higher number of women are Arts, Entertainment & Recreation (100.0%), Health Care & Social Assistance (89.5%), and Educational Services (89.0%).
| Industry | Male | Female |
| Agriculture, Fishing & Hunting | 26 (100.0%) | 0 (0.0%) |
| Mining, Quarrying, & Extraction | 0 (0.0%) | 0 (0.0%) |
| Construction | 273 (83.0%) | 56 (17.0%) |
| Manufacturing | 372 (69.8%) | 161 (30.2%) |
| Wholesale Trade | 135 (87.7%) | 19 (12.3%) |
| Retail Trade | 180 (56.2%) | 140 (43.8%) |
| Transportation & Warehousing | 16 (100.0%) | 0 (0.0%) |
| Utilities | 30 (100.0%) | 0 (0.0%) |
| Information | 10 (50.0%) | 10 (50.0%) |
| Finance & Insurance | 40 (48.2%) | 43 (51.8%) |
| Real Estate, Rental & Leasing | 0 (0.0%) | 0 (0.0%) |
| Professional & Scientific | 172 (90.0%) | 19 (10.0%) |
| Enterprise Management | 0 (0.0%) | 0 (0.0%) |
| Administrative & Support | 27 (40.9%) | 39 (59.1%) |
| Educational Services | 29 (11.0%) | 234 (89.0%) |
| Health Care & Social Assistance | 60 (10.5%) | 513 (89.5%) |
| Arts, Entertainment & Recreation | 0 (0.0%) | 10 (100.0%) |
| Accommodation & Food Services | 112 (63.6%) | 64 (36.4%) |
| Public Administration | 66 (69.5%) | 29 (30.5%) |
| Total | 1,675 (55.1%) | 1,362 (44.9%) |
Education in Edgerton
School Enrollment in Edgerton
The most common levels of schooling among the 1,630 students in Edgerton are middle school (479 | 29.4%), high school (439 | 26.9%), and elementary school (295 | 18.1%).
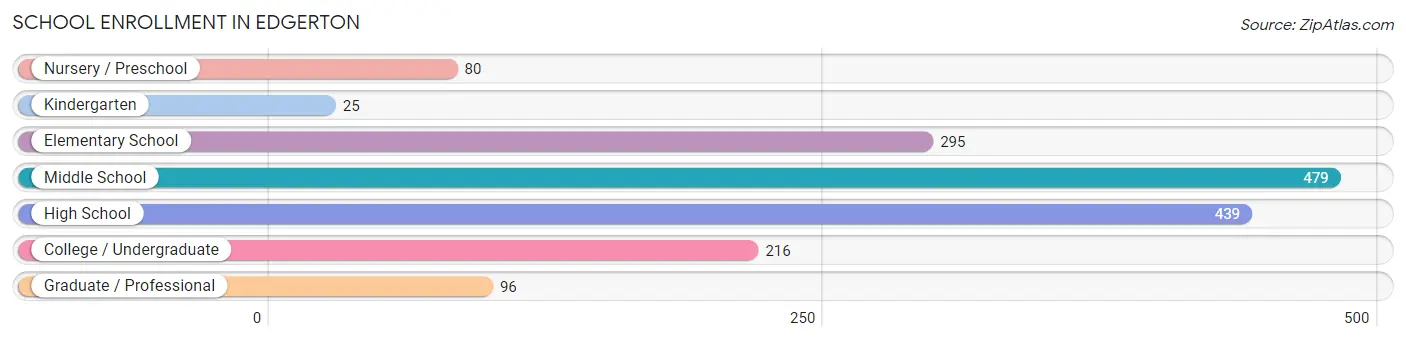
| School Level | # Students | % Students |
| Nursery / Preschool | 80 | 4.9% |
| Kindergarten | 25 | 1.5% |
| Elementary School | 295 | 18.1% |
| Middle School | 479 | 29.4% |
| High School | 439 | 26.9% |
| College / Undergraduate | 216 | 13.3% |
| Graduate / Professional | 96 | 5.9% |
| Total | 1,630 | 100.0% |
School Enrollment by Age by Funding Source in Edgerton
Out of a total of 1,630 students who are enrolled in schools in Edgerton, 39 (2.4%) attend a private institution, while the remaining 1,591 (97.6%) are enrolled in public schools. The age group of 10 to 14 year olds has the highest likelihood of being enrolled in private schools, with 39 (7.0% in the age bracket) enrolled. Conversely, the age group of 3 to 4 year olds has the lowest likelihood of being enrolled in a private school, with 57 (100.0% in the age bracket) attending a public institution.
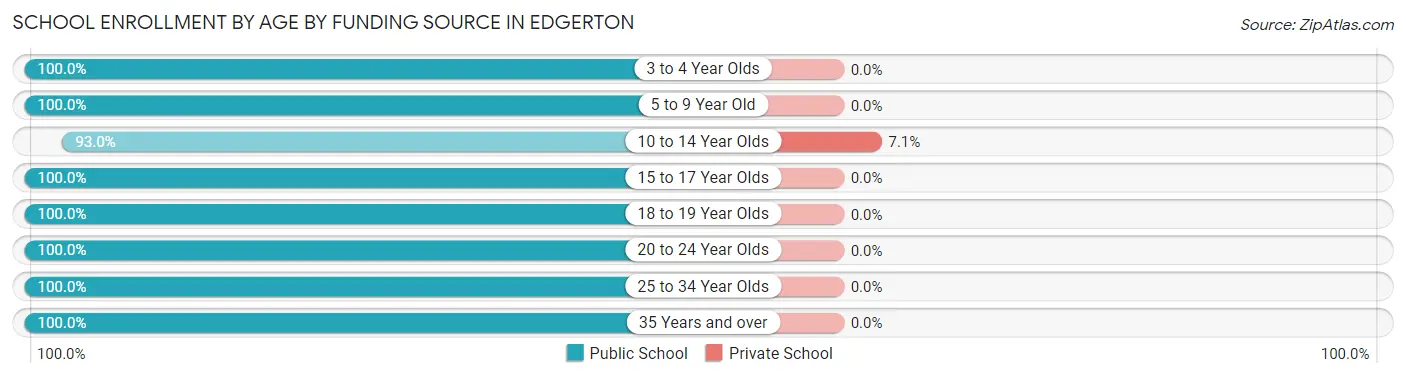
| Age Bracket | Public School | Private School |
| 3 to 4 Year Olds | 57 (100.0%) | 0 (0.0%) |
| 5 to 9 Year Old | 309 (100.0%) | 0 (0.0%) |
| 10 to 14 Year Olds | 514 (92.9%) | 39 (7.0%) |
| 15 to 17 Year Olds | 362 (100.0%) | 0 (0.0%) |
| 18 to 19 Year Olds | 50 (100.0%) | 0 (0.0%) |
| 20 to 24 Year Olds | 180 (100.0%) | 0 (0.0%) |
| 25 to 34 Year Olds | 59 (100.0%) | 0 (0.0%) |
| 35 Years and over | 60 (100.0%) | 0 (0.0%) |
| Total | 1,591 (97.6%) | 39 (2.4%) |
Educational Attainment by Field of Study in Edgerton
Science & technology (211 | 17.4%), education (181 | 14.9%), business (171 | 14.1%), arts & humanities (105 | 8.7%), and social sciences (100 | 8.2%) are the most common fields of study among 1,213 individuals in Edgerton who have obtained a bachelor's degree or higher.
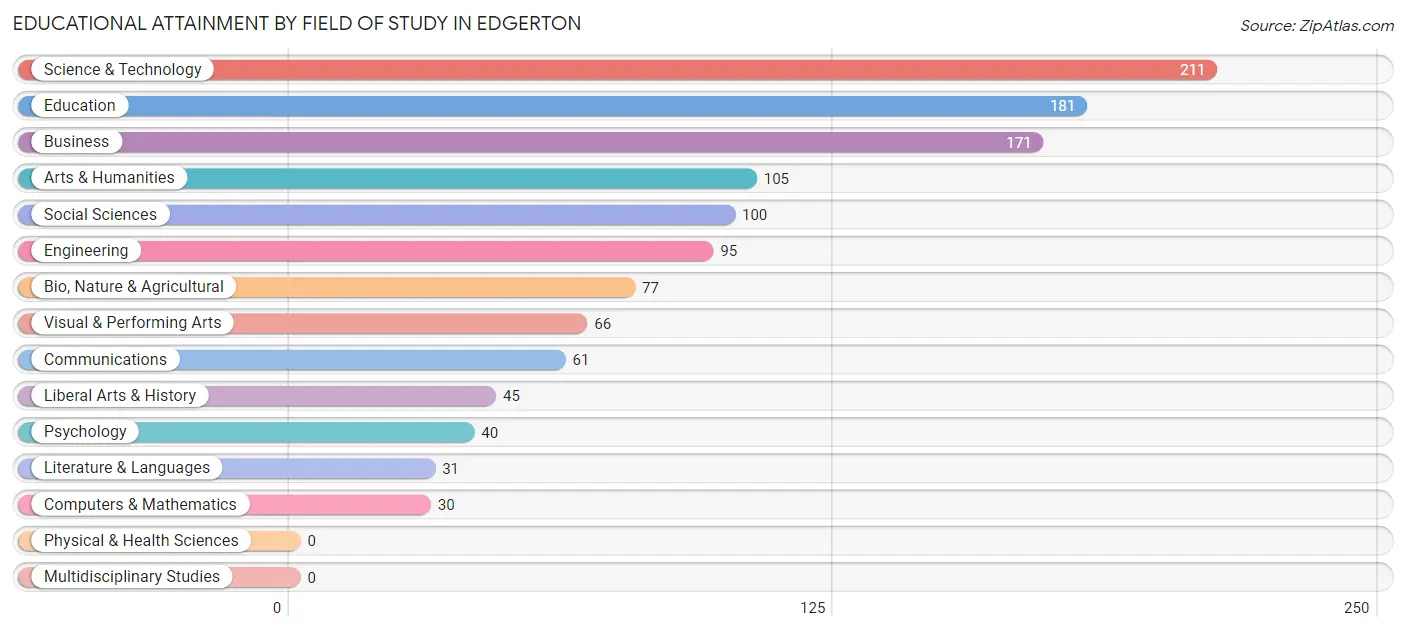
| Field of Study | # Graduates | % Graduates |
| Computers & Mathematics | 30 | 2.5% |
| Bio, Nature & Agricultural | 77 | 6.4% |
| Physical & Health Sciences | 0 | 0.0% |
| Psychology | 40 | 3.3% |
| Social Sciences | 100 | 8.2% |
| Engineering | 95 | 7.8% |
| Multidisciplinary Studies | 0 | 0.0% |
| Science & Technology | 211 | 17.4% |
| Business | 171 | 14.1% |
| Education | 181 | 14.9% |
| Literature & Languages | 31 | 2.6% |
| Liberal Arts & History | 45 | 3.7% |
| Visual & Performing Arts | 66 | 5.4% |
| Communications | 61 | 5.0% |
| Arts & Humanities | 105 | 8.7% |
| Total | 1,213 | 100.0% |
Transportation & Commute in Edgerton
Vehicle Availability by Sex in Edgerton
The most prevalent vehicle ownership categories in Edgerton are males with 2 vehicles (771, accounting for 48.7%) and females with 2 vehicles (611, making up 58.9%).
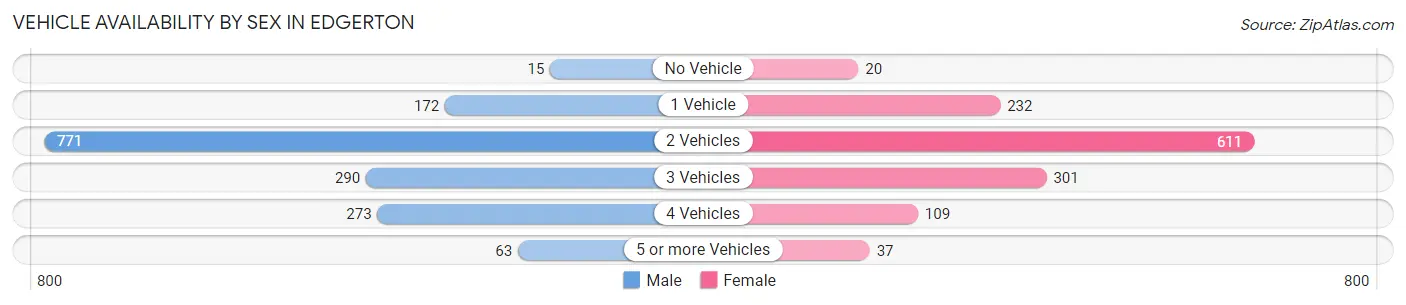
| Vehicles Available | Male | Female |
| No Vehicle | 15 (0.9%) | 20 (1.5%) |
| 1 Vehicle | 172 (10.9%) | 232 (17.7%) |
| 2 Vehicles | 771 (48.7%) | 611 (46.6%) |
| 3 Vehicles | 290 (18.3%) | 301 (23.0%) |
| 4 Vehicles | 273 (17.2%) | 109 (8.3%) |
| 5 or more Vehicles | 63 (4.0%) | 37 (2.8%) |
| Total | 1,584 (100.0%) | 1,310 (100.0%) |
Commute Time in Edgerton
The most frequently occuring commute durations in Edgerton are 30 to 34 minutes (531 commuters, 20.7%), 20 to 24 minutes (383 commuters, 14.9%), and 45 to 59 minutes (279 commuters, 10.9%).
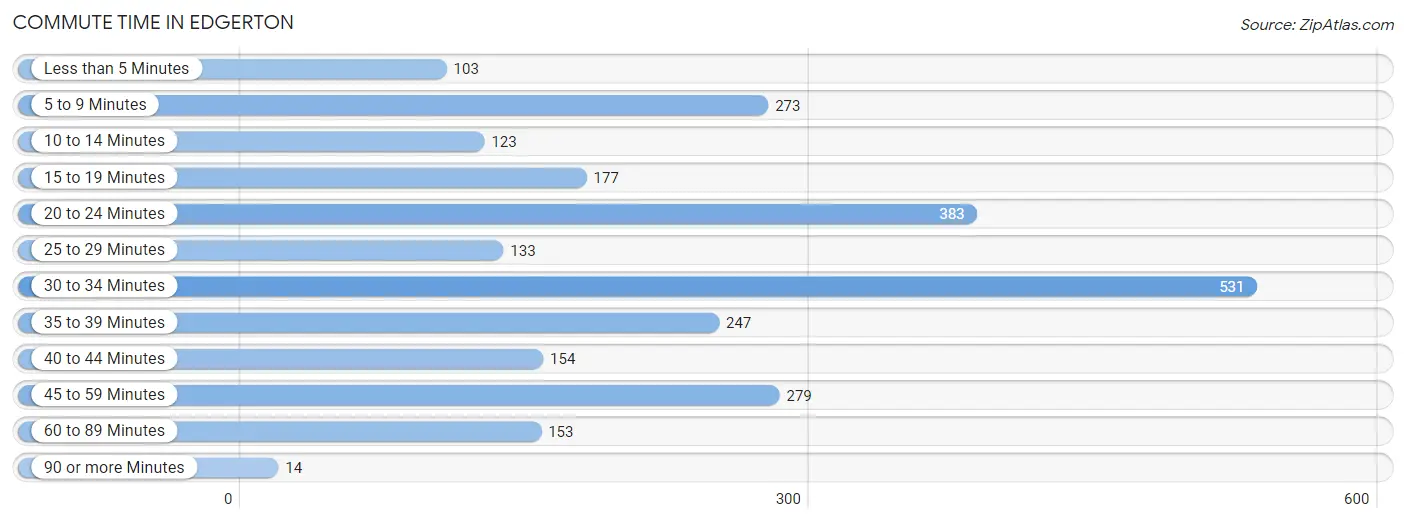
| Commute Time | # Commuters | % Commuters |
| Less than 5 Minutes | 103 | 4.0% |
| 5 to 9 Minutes | 273 | 10.6% |
| 10 to 14 Minutes | 123 | 4.8% |
| 15 to 19 Minutes | 177 | 6.9% |
| 20 to 24 Minutes | 383 | 14.9% |
| 25 to 29 Minutes | 133 | 5.2% |
| 30 to 34 Minutes | 531 | 20.7% |
| 35 to 39 Minutes | 247 | 9.6% |
| 40 to 44 Minutes | 154 | 6.0% |
| 45 to 59 Minutes | 279 | 10.9% |
| 60 to 89 Minutes | 153 | 5.9% |
| 90 or more Minutes | 14 | 0.5% |
Commute Time by Sex in Edgerton
The most common commute times in Edgerton are 30 to 34 minutes (359 commuters, 26.7%) for males and 20 to 24 minutes (200 commuters, 16.4%) for females.
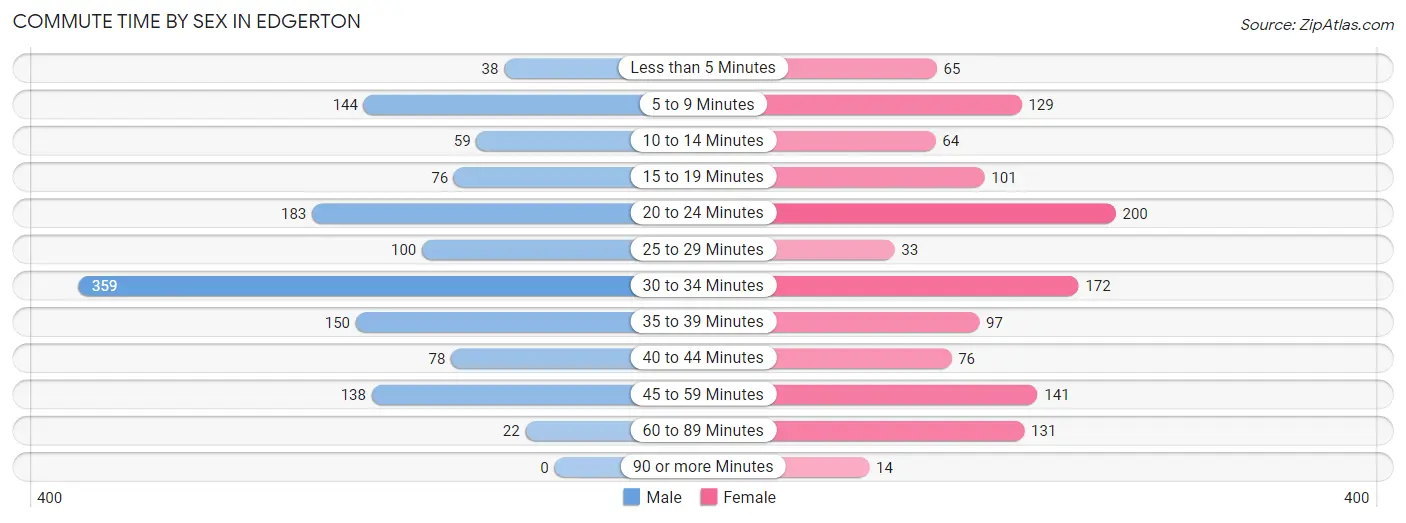
| Commute Time | Male | Female |
| Less than 5 Minutes | 38 (2.8%) | 65 (5.3%) |
| 5 to 9 Minutes | 144 (10.7%) | 129 (10.5%) |
| 10 to 14 Minutes | 59 (4.4%) | 64 (5.2%) |
| 15 to 19 Minutes | 76 (5.6%) | 101 (8.3%) |
| 20 to 24 Minutes | 183 (13.6%) | 200 (16.4%) |
| 25 to 29 Minutes | 100 (7.4%) | 33 (2.7%) |
| 30 to 34 Minutes | 359 (26.7%) | 172 (14.1%) |
| 35 to 39 Minutes | 150 (11.1%) | 97 (7.9%) |
| 40 to 44 Minutes | 78 (5.8%) | 76 (6.2%) |
| 45 to 59 Minutes | 138 (10.2%) | 141 (11.5%) |
| 60 to 89 Minutes | 22 (1.6%) | 131 (10.7%) |
| 90 or more Minutes | 0 (0.0%) | 14 (1.1%) |
Time of Departure to Work by Sex in Edgerton
The most frequent times of departure to work in Edgerton are 6:30 AM to 6:59 AM (224, 16.6%) for males and 7:30 AM to 7:59 AM (204, 16.7%) for females.
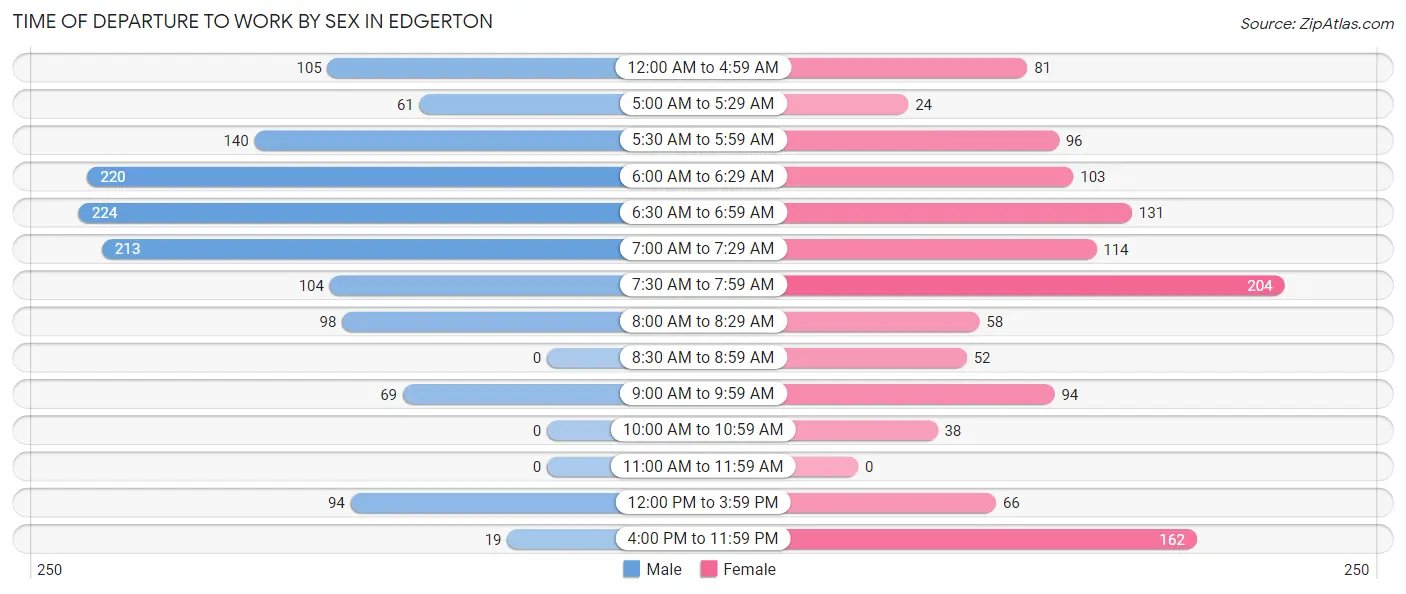
| Time of Departure | Male | Female |
| 12:00 AM to 4:59 AM | 105 (7.8%) | 81 (6.6%) |
| 5:00 AM to 5:29 AM | 61 (4.5%) | 24 (2.0%) |
| 5:30 AM to 5:59 AM | 140 (10.4%) | 96 (7.9%) |
| 6:00 AM to 6:29 AM | 220 (16.3%) | 103 (8.4%) |
| 6:30 AM to 6:59 AM | 224 (16.6%) | 131 (10.7%) |
| 7:00 AM to 7:29 AM | 213 (15.8%) | 114 (9.3%) |
| 7:30 AM to 7:59 AM | 104 (7.7%) | 204 (16.7%) |
| 8:00 AM to 8:29 AM | 98 (7.3%) | 58 (4.7%) |
| 8:30 AM to 8:59 AM | 0 (0.0%) | 52 (4.3%) |
| 9:00 AM to 9:59 AM | 69 (5.1%) | 94 (7.7%) |
| 10:00 AM to 10:59 AM | 0 (0.0%) | 38 (3.1%) |
| 11:00 AM to 11:59 AM | 0 (0.0%) | 0 (0.0%) |
| 12:00 PM to 3:59 PM | 94 (7.0%) | 66 (5.4%) |
| 4:00 PM to 11:59 PM | 19 (1.4%) | 162 (13.3%) |
| Total | 1,347 (100.0%) | 1,223 (100.0%) |
Housing Occupancy in Edgerton
Occupancy by Ownership in Edgerton
Of the total 2,257 dwellings in Edgerton, owner-occupied units account for 1,316 (58.3%), while renter-occupied units make up 941 (41.7%).
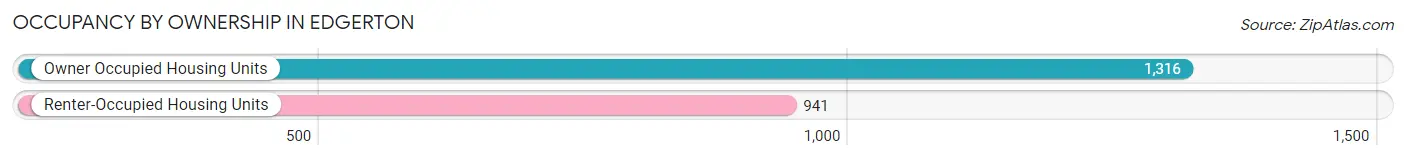
| Occupancy | # Housing Units | % Housing Units |
| Owner Occupied Housing Units | 1,316 | 58.3% |
| Renter-Occupied Housing Units | 941 | 41.7% |
| Total Occupied Housing Units | 2,257 | 100.0% |
Occupancy by Household Size in Edgerton
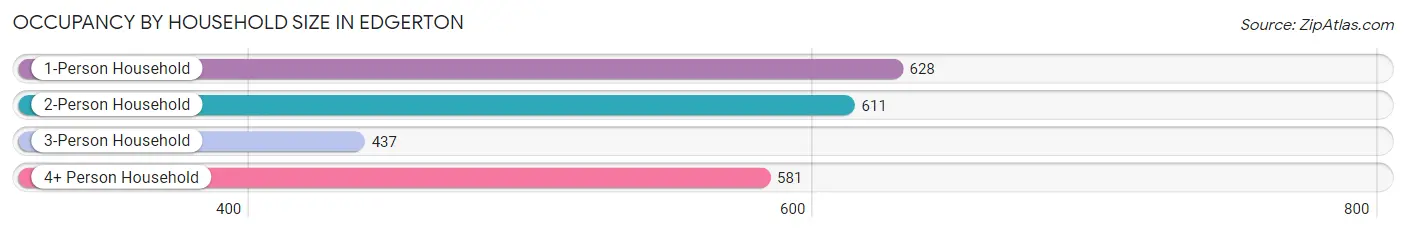
| Household Size | # Housing Units | % Housing Units |
| 1-Person Household | 628 | 27.8% |
| 2-Person Household | 611 | 27.1% |
| 3-Person Household | 437 | 19.4% |
| 4+ Person Household | 581 | 25.7% |
| Total Housing Units | 2,257 | 100.0% |
Occupancy by Ownership by Household Size in Edgerton
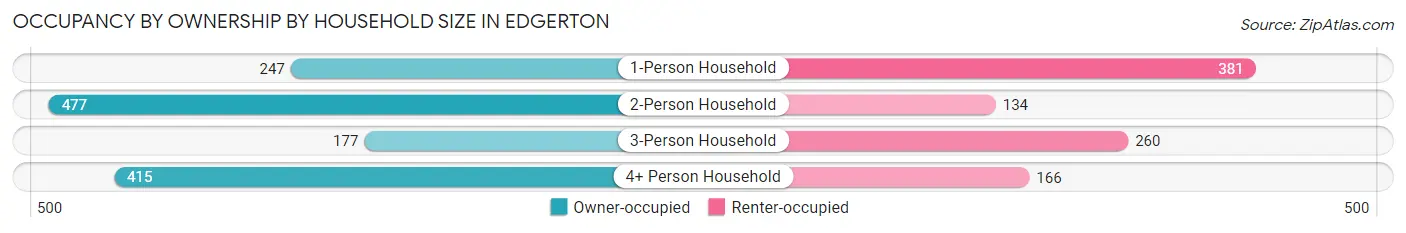
| Household Size | Owner-occupied | Renter-occupied |
| 1-Person Household | 247 (39.3%) | 381 (60.7%) |
| 2-Person Household | 477 (78.1%) | 134 (21.9%) |
| 3-Person Household | 177 (40.5%) | 260 (59.5%) |
| 4+ Person Household | 415 (71.4%) | 166 (28.6%) |
| Total Housing Units | 1,316 (58.3%) | 941 (41.7%) |
Occupancy by Educational Attainment in Edgerton
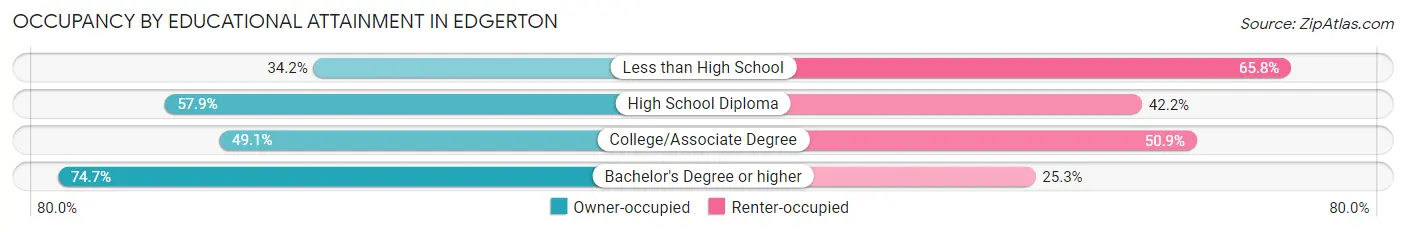
| Household Size | Owner-occupied | Renter-occupied |
| Less than High School | 54 (34.2%) | 104 (65.8%) |
| High School Diploma | 387 (57.9%) | 282 (42.1%) |
| College/Associate Degree | 372 (49.1%) | 385 (50.9%) |
| Bachelor's Degree or higher | 503 (74.7%) | 170 (25.3%) |
Occupancy by Age of Householder in Edgerton
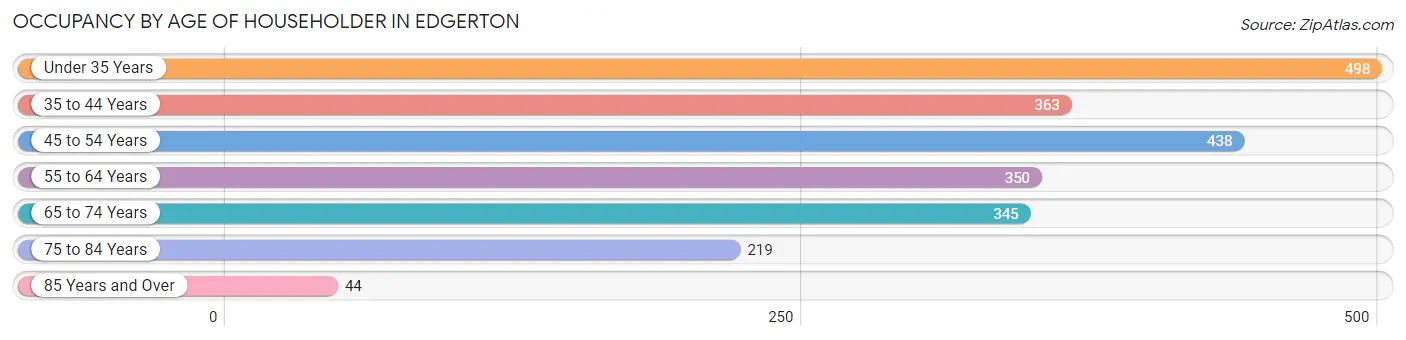
| Age Bracket | # Households | % Households |
| Under 35 Years | 498 | 22.1% |
| 35 to 44 Years | 363 | 16.1% |
| 45 to 54 Years | 438 | 19.4% |
| 55 to 64 Years | 350 | 15.5% |
| 65 to 74 Years | 345 | 15.3% |
| 75 to 84 Years | 219 | 9.7% |
| 85 Years and Over | 44 | 1.9% |
| Total | 2,257 | 100.0% |
Housing Finances in Edgerton
Median Income by Occupancy in Edgerton
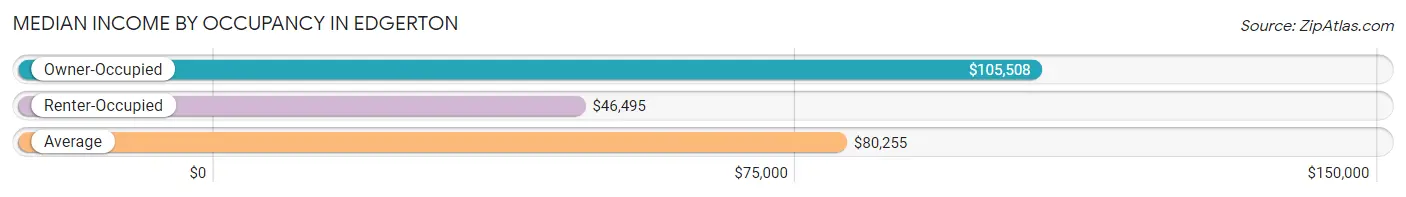
| Occupancy Type | # Households | Median Income |
| Owner-Occupied | 1,316 (58.3%) | $105,508 |
| Renter-Occupied | 941 (41.7%) | $46,495 |
| Average | 2,257 (100.0%) | $80,255 |
Occupancy by Householder Income Bracket in Edgerton
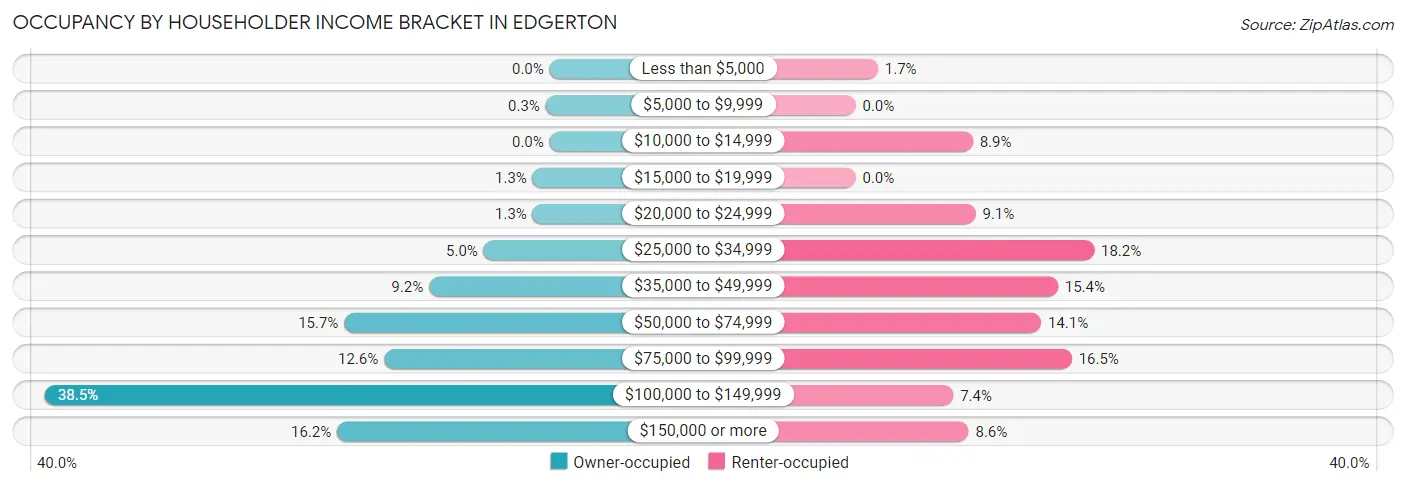
| Income Bracket | Owner-occupied | Renter-occupied |
| Less than $5,000 | 0 (0.0%) | 16 (1.7%) |
| $5,000 to $9,999 | 4 (0.3%) | 0 (0.0%) |
| $10,000 to $14,999 | 0 (0.0%) | 84 (8.9%) |
| $15,000 to $19,999 | 17 (1.3%) | 0 (0.0%) |
| $20,000 to $24,999 | 17 (1.3%) | 86 (9.1%) |
| $25,000 to $34,999 | 66 (5.0%) | 171 (18.2%) |
| $35,000 to $49,999 | 121 (9.2%) | 145 (15.4%) |
| $50,000 to $74,999 | 206 (15.7%) | 133 (14.1%) |
| $75,000 to $99,999 | 166 (12.6%) | 155 (16.5%) |
| $100,000 to $149,999 | 506 (38.5%) | 70 (7.4%) |
| $150,000 or more | 213 (16.2%) | 81 (8.6%) |
| Total | 1,316 (100.0%) | 941 (100.0%) |
Monthly Housing Cost Tiers in Edgerton
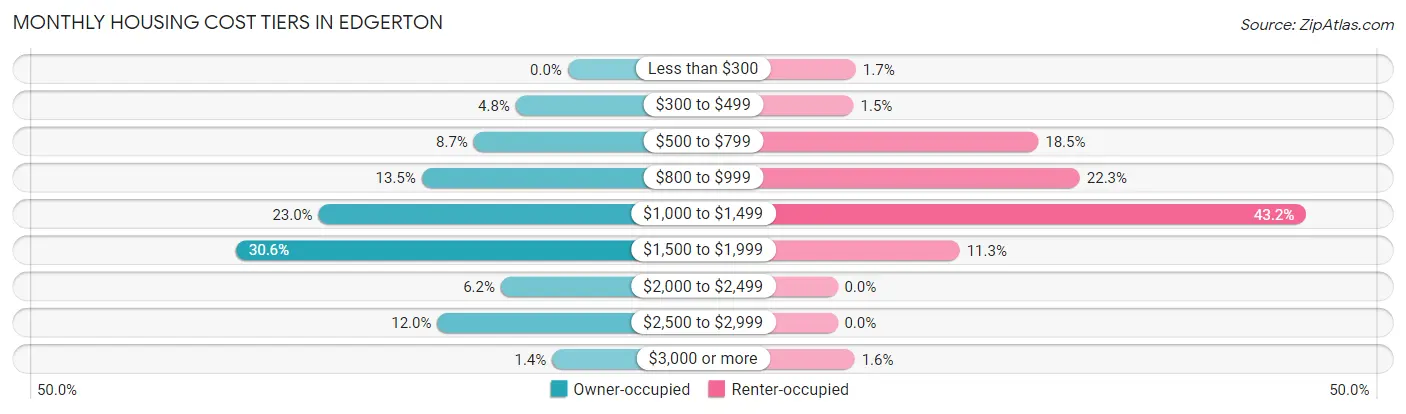
| Monthly Cost | Owner-occupied | Renter-occupied |
| Less than $300 | 0 (0.0%) | 16 (1.7%) |
| $300 to $499 | 63 (4.8%) | 14 (1.5%) |
| $500 to $799 | 114 (8.7%) | 174 (18.5%) |
| $800 to $999 | 177 (13.5%) | 210 (22.3%) |
| $1,000 to $1,499 | 302 (23.0%) | 406 (43.1%) |
| $1,500 to $1,999 | 402 (30.5%) | 106 (11.3%) |
| $2,000 to $2,499 | 81 (6.2%) | 0 (0.0%) |
| $2,500 to $2,999 | 158 (12.0%) | 0 (0.0%) |
| $3,000 or more | 19 (1.4%) | 15 (1.6%) |
| Total | 1,316 (100.0%) | 941 (100.0%) |
Physical Housing Characteristics in Edgerton
Housing Structures in Edgerton
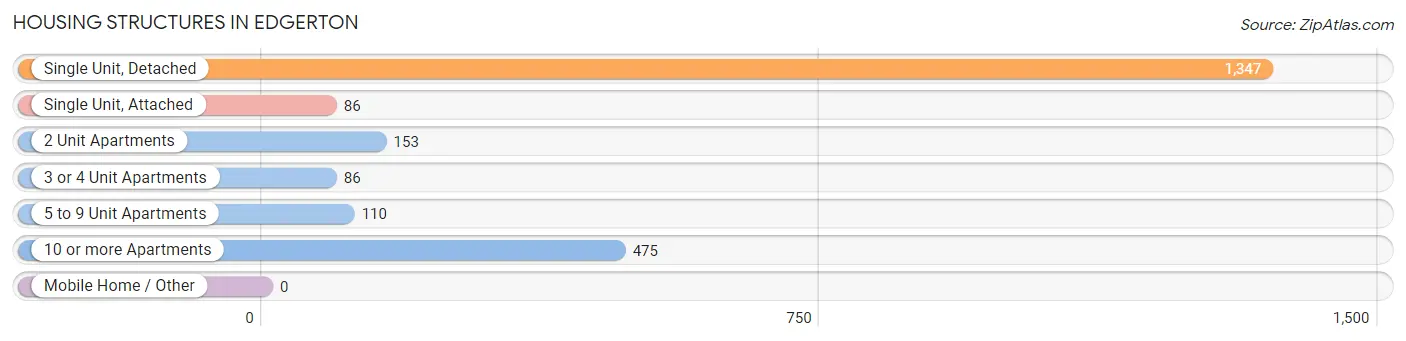
| Structure Type | # Housing Units | % Housing Units |
| Single Unit, Detached | 1,347 | 59.7% |
| Single Unit, Attached | 86 | 3.8% |
| 2 Unit Apartments | 153 | 6.8% |
| 3 or 4 Unit Apartments | 86 | 3.8% |
| 5 to 9 Unit Apartments | 110 | 4.9% |
| 10 or more Apartments | 475 | 21.0% |
| Mobile Home / Other | 0 | 0.0% |
| Total | 2,257 | 100.0% |
Housing Structures by Occupancy in Edgerton
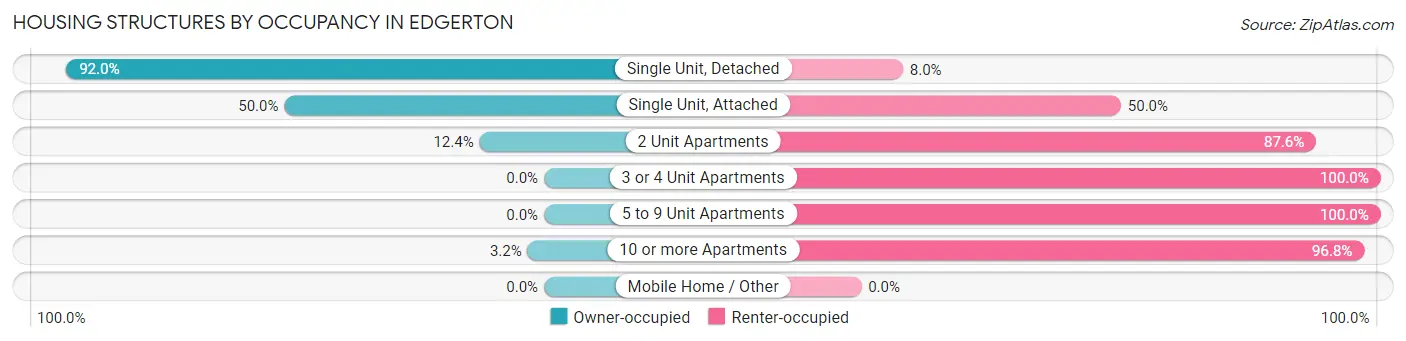
| Structure Type | Owner-occupied | Renter-occupied |
| Single Unit, Detached | 1,239 (92.0%) | 108 (8.0%) |
| Single Unit, Attached | 43 (50.0%) | 43 (50.0%) |
| 2 Unit Apartments | 19 (12.4%) | 134 (87.6%) |
| 3 or 4 Unit Apartments | 0 (0.0%) | 86 (100.0%) |
| 5 to 9 Unit Apartments | 0 (0.0%) | 110 (100.0%) |
| 10 or more Apartments | 15 (3.2%) | 460 (96.8%) |
| Mobile Home / Other | 0 (0.0%) | 0 (0.0%) |
| Total | 1,316 (58.3%) | 941 (41.7%) |
Housing Structures by Number of Rooms in Edgerton
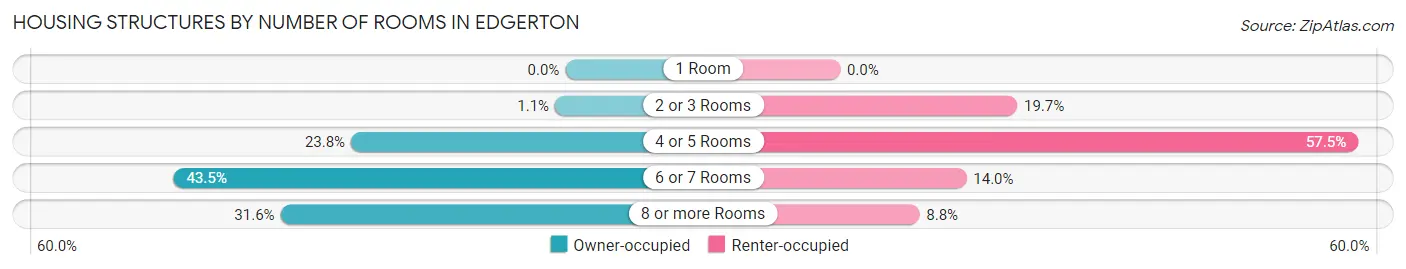
| Number of Rooms | Owner-occupied | Renter-occupied |
| 1 Room | 0 (0.0%) | 0 (0.0%) |
| 2 or 3 Rooms | 15 (1.1%) | 185 (19.7%) |
| 4 or 5 Rooms | 313 (23.8%) | 541 (57.5%) |
| 6 or 7 Rooms | 572 (43.5%) | 132 (14.0%) |
| 8 or more Rooms | 416 (31.6%) | 83 (8.8%) |
| Total | 1,316 (100.0%) | 941 (100.0%) |
Housing Structure by Heating Type in Edgerton
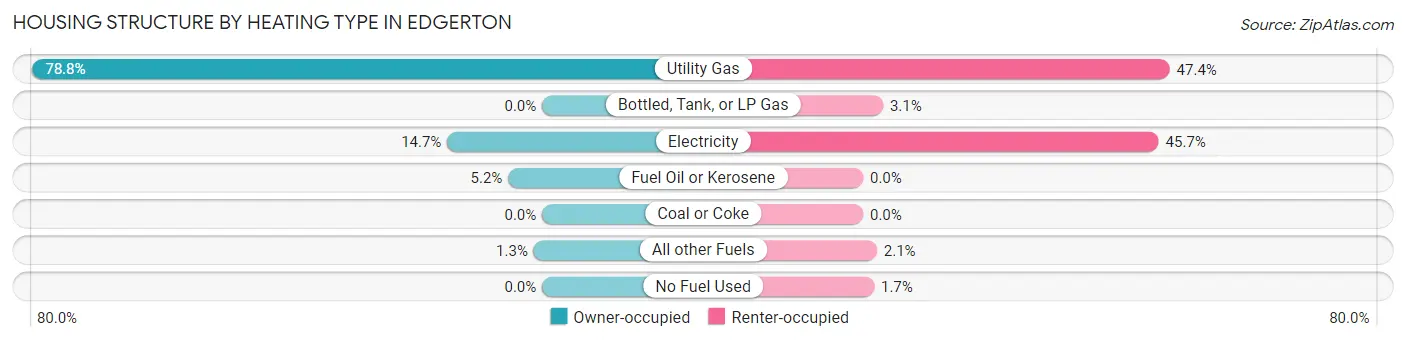
| Heating Type | Owner-occupied | Renter-occupied |
| Utility Gas | 1,037 (78.8%) | 446 (47.4%) |
| Bottled, Tank, or LP Gas | 0 (0.0%) | 29 (3.1%) |
| Electricity | 193 (14.7%) | 430 (45.7%) |
| Fuel Oil or Kerosene | 69 (5.2%) | 0 (0.0%) |
| Coal or Coke | 0 (0.0%) | 0 (0.0%) |
| All other Fuels | 17 (1.3%) | 20 (2.1%) |
| No Fuel Used | 0 (0.0%) | 16 (1.7%) |
| Total | 1,316 (100.0%) | 941 (100.0%) |
Household Vehicle Usage in Edgerton
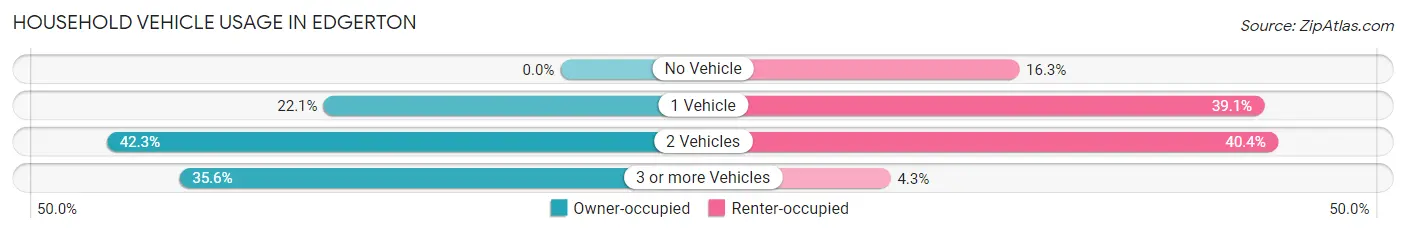
| Vehicles per Household | Owner-occupied | Renter-occupied |
| No Vehicle | 0 (0.0%) | 153 (16.3%) |
| 1 Vehicle | 291 (22.1%) | 368 (39.1%) |
| 2 Vehicles | 557 (42.3%) | 380 (40.4%) |
| 3 or more Vehicles | 468 (35.6%) | 40 (4.3%) |
| Total | 1,316 (100.0%) | 941 (100.0%) |
Real Estate & Mortgages in Edgerton
Real Estate and Mortgage Overview in Edgerton
| Characteristic | Without Mortgage | With Mortgage |
| Housing Units | 310 | 1,006 |
| Median Property Value | $211,300 | $223,100 |
| Median Household Income | $70,870 | $148 |
| Monthly Housing Costs | $812 | $19 |
| Real Estate Taxes | $3,794 | $0 |
Property Value by Mortgage Status in Edgerton
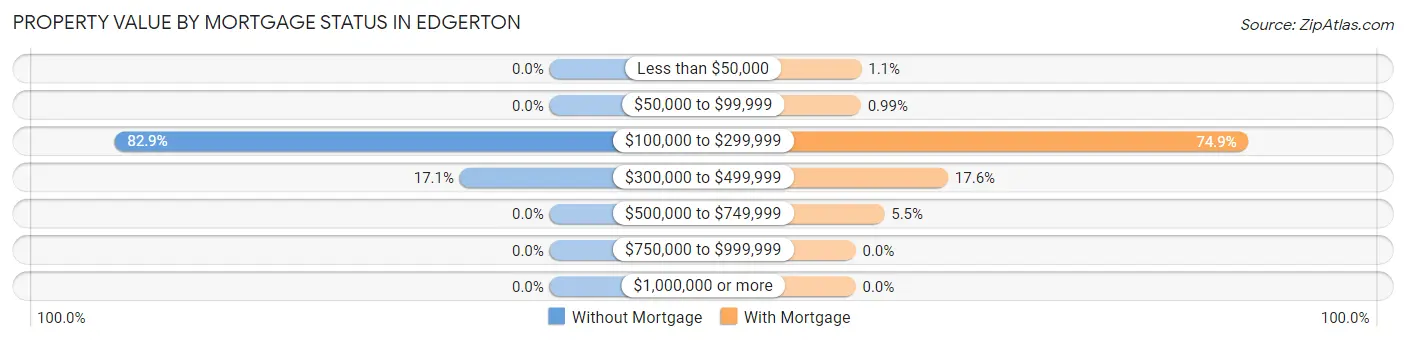
| Property Value | Without Mortgage | With Mortgage |
| Less than $50,000 | 0 (0.0%) | 11 (1.1%) |
| $50,000 to $99,999 | 0 (0.0%) | 10 (1.0%) |
| $100,000 to $299,999 | 257 (82.9%) | 753 (74.9%) |
| $300,000 to $499,999 | 53 (17.1%) | 177 (17.6%) |
| $500,000 to $749,999 | 0 (0.0%) | 55 (5.5%) |
| $750,000 to $999,999 | 0 (0.0%) | 0 (0.0%) |
| $1,000,000 or more | 0 (0.0%) | 0 (0.0%) |
| Total | 310 (100.0%) | 1,006 (100.0%) |
Household Income by Mortgage Status in Edgerton
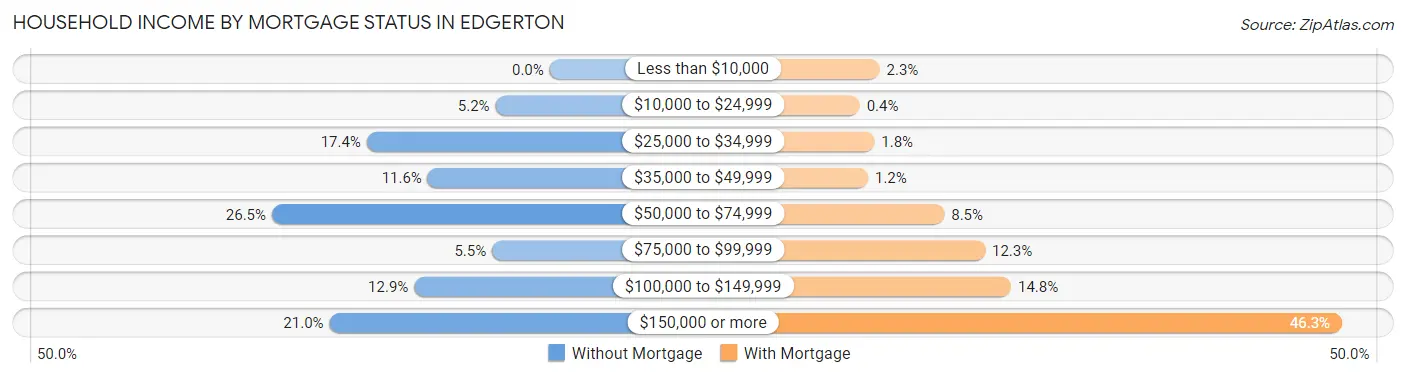
| Household Income | Without Mortgage | With Mortgage |
| Less than $10,000 | 0 (0.0%) | 23 (2.3%) |
| $10,000 to $24,999 | 16 (5.2%) | 4 (0.4%) |
| $25,000 to $34,999 | 54 (17.4%) | 18 (1.8%) |
| $35,000 to $49,999 | 36 (11.6%) | 12 (1.2%) |
| $50,000 to $74,999 | 82 (26.5%) | 85 (8.5%) |
| $75,000 to $99,999 | 17 (5.5%) | 124 (12.3%) |
| $100,000 to $149,999 | 40 (12.9%) | 149 (14.8%) |
| $150,000 or more | 65 (21.0%) | 466 (46.3%) |
| Total | 310 (100.0%) | 1,006 (100.0%) |
Property Value to Household Income Ratio in Edgerton
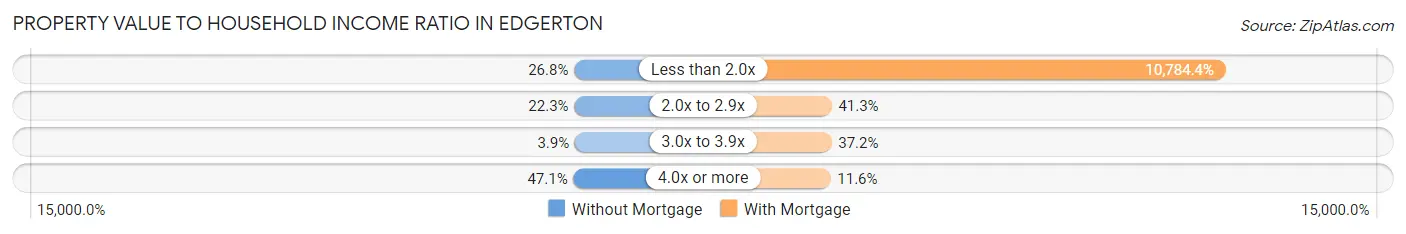
| Value-to-Income Ratio | Without Mortgage | With Mortgage |
| Less than 2.0x | 83 (26.8%) | 108,491 (10,784.4%) |
| 2.0x to 2.9x | 69 (22.3%) | 415 (41.2%) |
| 3.0x to 3.9x | 12 (3.9%) | 374 (37.2%) |
| 4.0x or more | 146 (47.1%) | 117 (11.6%) |
| Total | 310 (100.0%) | 1,006 (100.0%) |
Real Estate Taxes by Mortgage Status in Edgerton
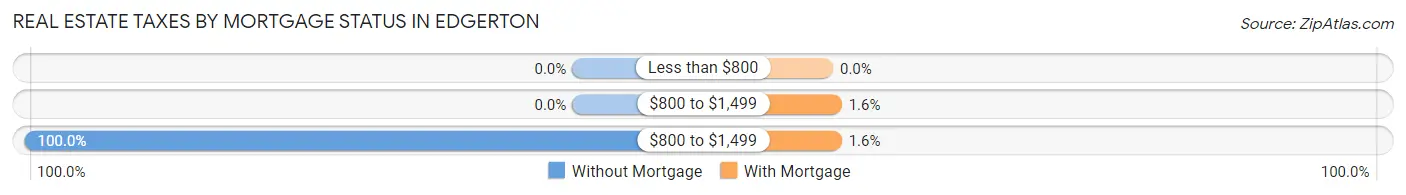
| Property Taxes | Without Mortgage | With Mortgage |
| Less than $800 | 0 (0.0%) | 0 (0.0%) |
| $800 to $1,499 | 0 (0.0%) | 16 (1.6%) |
| $800 to $1,499 | 310 (100.0%) | 16 (1.6%) |
| Total | 310 (100.0%) | 1,006 (100.0%) |
Health & Disability in Edgerton
Health Insurance Coverage by Age in Edgerton
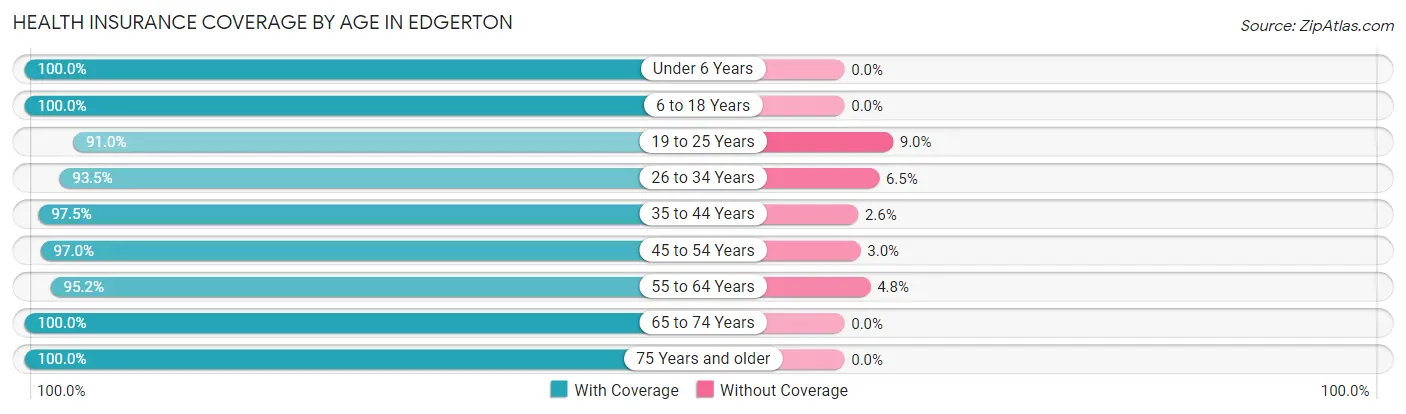
| Age Bracket | With Coverage | Without Coverage |
| Under 6 Years | 401 (100.0%) | 0 (0.0%) |
| 6 to 18 Years | 1,241 (100.0%) | 0 (0.0%) |
| 19 to 25 Years | 483 (91.0%) | 48 (9.0%) |
| 26 to 34 Years | 694 (93.5%) | 48 (6.5%) |
| 35 to 44 Years | 725 (97.5%) | 19 (2.5%) |
| 45 to 54 Years | 678 (97.0%) | 21 (3.0%) |
| 55 to 64 Years | 551 (95.2%) | 28 (4.8%) |
| 65 to 74 Years | 552 (100.0%) | 0 (0.0%) |
| 75 Years and older | 336 (100.0%) | 0 (0.0%) |
| Total | 5,661 (97.2%) | 164 (2.8%) |
Health Insurance Coverage by Citizenship Status in Edgerton
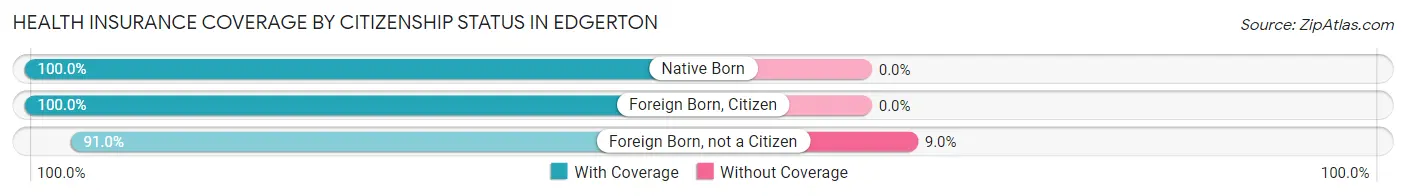
| Citizenship Status | With Coverage | Without Coverage |
| Native Born | 401 (100.0%) | 0 (0.0%) |
| Foreign Born, Citizen | 1,241 (100.0%) | 0 (0.0%) |
| Foreign Born, not a Citizen | 483 (91.0%) | 48 (9.0%) |
Health Insurance Coverage by Household Income in Edgerton
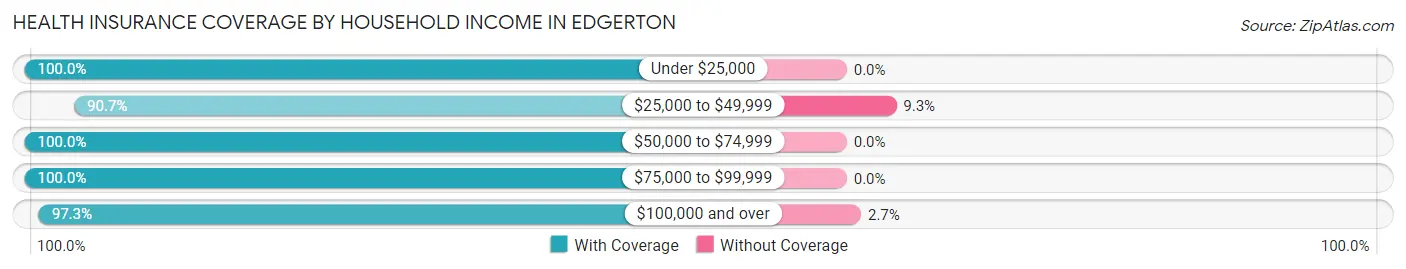
| Household Income | With Coverage | Without Coverage |
| Under $25,000 | 333 (100.0%) | 0 (0.0%) |
| $25,000 to $49,999 | 810 (90.7%) | 83 (9.3%) |
| $50,000 to $74,999 | 842 (100.0%) | 0 (0.0%) |
| $75,000 to $99,999 | 725 (100.0%) | 0 (0.0%) |
| $100,000 and over | 2,951 (97.3%) | 81 (2.7%) |
Public vs Private Health Insurance Coverage by Age in Edgerton
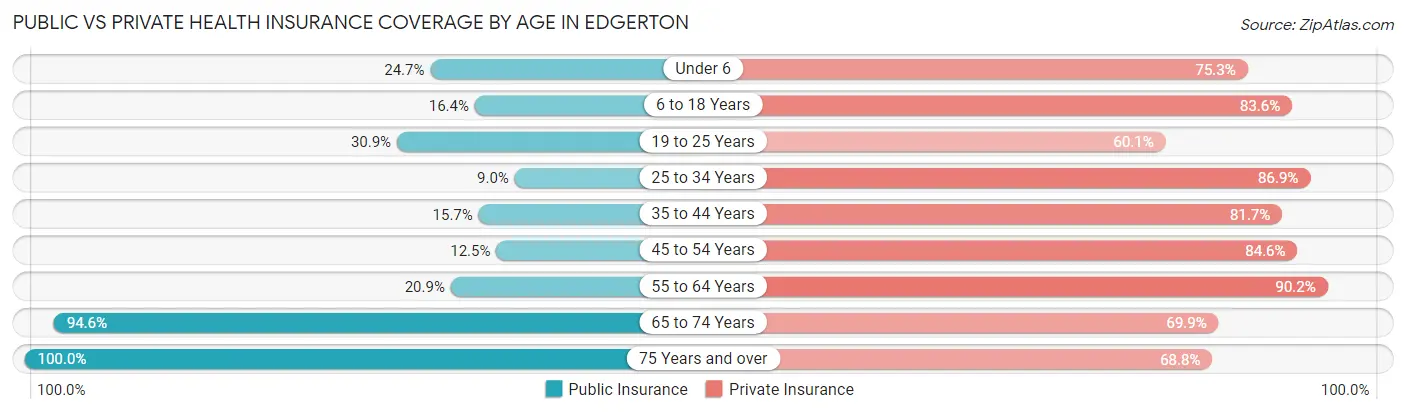
| Age Bracket | Public Insurance | Private Insurance |
| Under 6 | 99 (24.7%) | 302 (75.3%) |
| 6 to 18 Years | 204 (16.4%) | 1,037 (83.6%) |
| 19 to 25 Years | 164 (30.9%) | 319 (60.1%) |
| 25 to 34 Years | 67 (9.0%) | 645 (86.9%) |
| 35 to 44 Years | 117 (15.7%) | 608 (81.7%) |
| 45 to 54 Years | 87 (12.4%) | 591 (84.6%) |
| 55 to 64 Years | 121 (20.9%) | 522 (90.2%) |
| 65 to 74 Years | 522 (94.6%) | 386 (69.9%) |
| 75 Years and over | 336 (100.0%) | 231 (68.8%) |
| Total | 1,717 (29.5%) | 4,641 (79.7%) |
Disability Status by Sex by Age in Edgerton
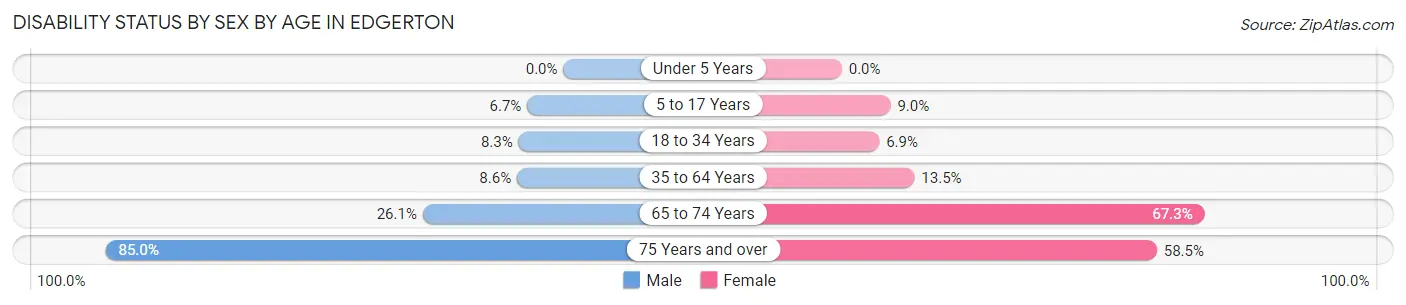
| Age Bracket | Male | Female |
| Under 5 Years | 0 (0.0%) | 0 (0.0%) |
| 5 to 17 Years | 45 (6.7%) | 50 (9.0%) |
| 18 to 34 Years | 61 (8.3%) | 42 (6.9%) |
| 35 to 64 Years | 93 (8.6%) | 127 (13.5%) |
| 65 to 74 Years | 65 (26.1%) | 204 (67.3%) |
| 75 Years and over | 130 (85.0%) | 107 (58.5%) |
Disability Class by Sex by Age in Edgerton
Disability Class: Hearing Difficulty
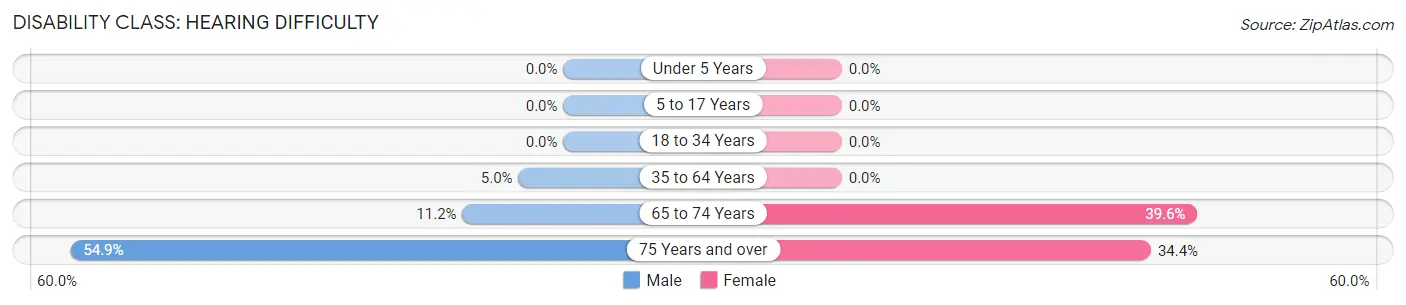
| Age Bracket | Male | Female |
| Under 5 Years | 0 (0.0%) | 0 (0.0%) |
| 5 to 17 Years | 0 (0.0%) | 0 (0.0%) |
| 18 to 34 Years | 0 (0.0%) | 0 (0.0%) |
| 35 to 64 Years | 54 (5.0%) | 0 (0.0%) |
| 65 to 74 Years | 28 (11.2%) | 120 (39.6%) |
| 75 Years and over | 84 (54.9%) | 63 (34.4%) |
Disability Class: Vision Difficulty
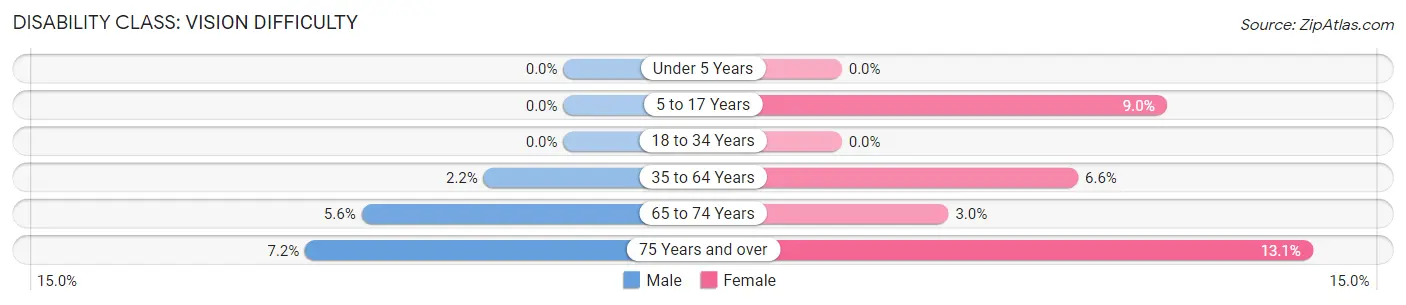
| Age Bracket | Male | Female |
| Under 5 Years | 0 (0.0%) | 0 (0.0%) |
| 5 to 17 Years | 0 (0.0%) | 50 (9.0%) |
| 18 to 34 Years | 0 (0.0%) | 0 (0.0%) |
| 35 to 64 Years | 24 (2.2%) | 62 (6.6%) |
| 65 to 74 Years | 14 (5.6%) | 9 (3.0%) |
| 75 Years and over | 11 (7.2%) | 24 (13.1%) |
Disability Class: Cognitive Difficulty
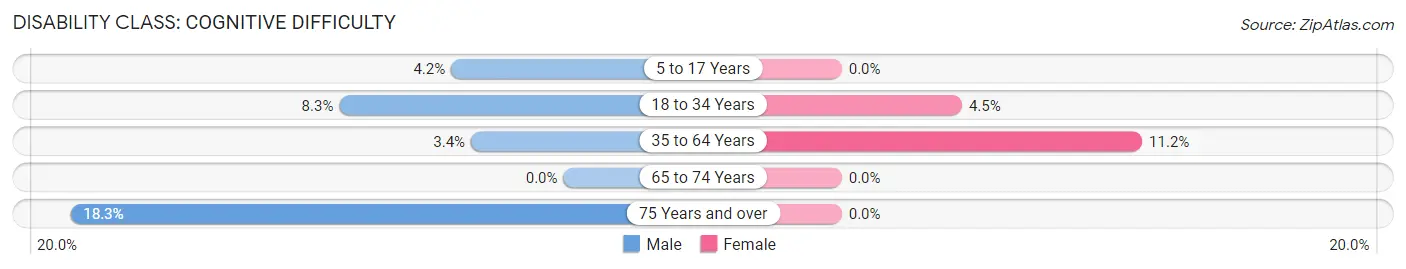
| Age Bracket | Male | Female |
| 5 to 17 Years | 28 (4.2%) | 0 (0.0%) |
| 18 to 34 Years | 61 (8.3%) | 27 (4.5%) |
| 35 to 64 Years | 37 (3.4%) | 105 (11.2%) |
| 65 to 74 Years | 0 (0.0%) | 0 (0.0%) |
| 75 Years and over | 28 (18.3%) | 0 (0.0%) |
Disability Class: Ambulatory Difficulty
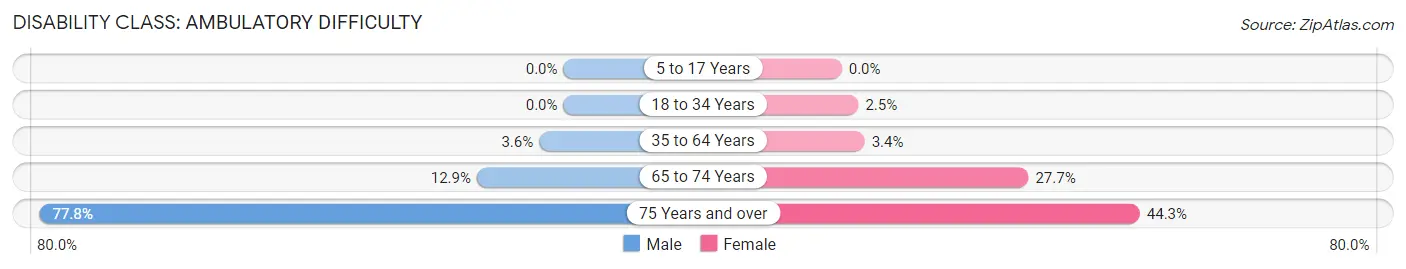
| Age Bracket | Male | Female |
| 5 to 17 Years | 0 (0.0%) | 0 (0.0%) |
| 18 to 34 Years | 0 (0.0%) | 15 (2.5%) |
| 35 to 64 Years | 39 (3.6%) | 32 (3.4%) |
| 65 to 74 Years | 32 (12.9%) | 84 (27.7%) |
| 75 Years and over | 119 (77.8%) | 81 (44.3%) |
Disability Class: Self-Care Difficulty
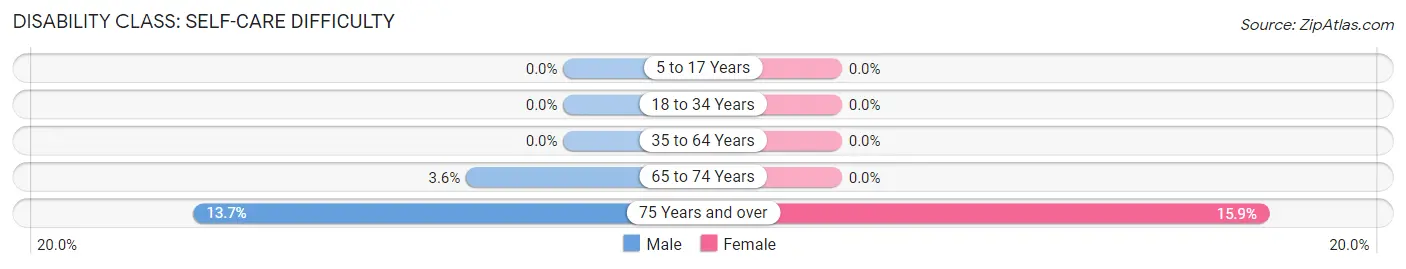
| Age Bracket | Male | Female |
| 5 to 17 Years | 0 (0.0%) | 0 (0.0%) |
| 18 to 34 Years | 0 (0.0%) | 0 (0.0%) |
| 35 to 64 Years | 0 (0.0%) | 0 (0.0%) |
| 65 to 74 Years | 9 (3.6%) | 0 (0.0%) |
| 75 Years and over | 21 (13.7%) | 29 (15.9%) |
Technology Access in Edgerton
Computing Device Access in Edgerton
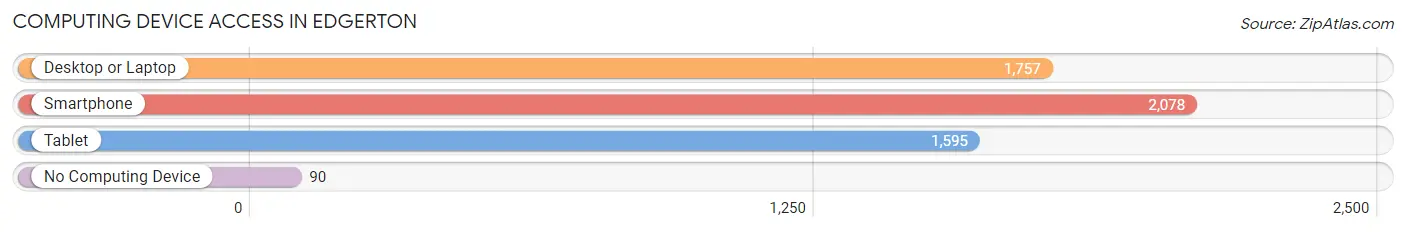
| Device Type | # Households | % Households |
| Desktop or Laptop | 1,757 | 77.8% |
| Smartphone | 2,078 | 92.1% |
| Tablet | 1,595 | 70.7% |
| No Computing Device | 90 | 4.0% |
| Total | 2,257 | 100.0% |
Internet Access in Edgerton
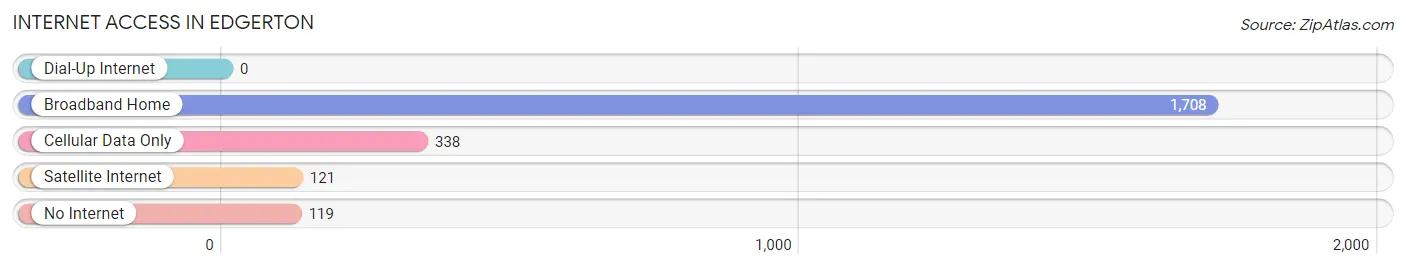
| Internet Type | # Households | % Households |
| Dial-Up Internet | 0 | 0.0% |
| Broadband Home | 1,708 | 75.7% |
| Cellular Data Only | 338 | 15.0% |
| Satellite Internet | 121 | 5.4% |
| No Internet | 119 | 5.3% |
| Total | 2,257 | 100.0% |
Edgerton Summary
Edgerton, Wisconsin is a small city located in Rock County, Wisconsin. It is situated on the Rock River, about 25 miles south of Madison. The city has a population of 4,719 people, according to the 2010 census.
History
Edgerton was founded in 1836 by William Edgerton, a settler from New York. He purchased land from the government and began to build a small village. The village was named after him and was incorporated in 1856.
Edgerton was an important stop on the Milwaukee and St. Paul Railroad, which ran through the city. This allowed the city to become a major shipping center for the surrounding area. The railroad also helped to bring in new businesses and industries, such as the Edgerton Canning Company, which was established in 1876.
The city was also home to several other businesses, including a flour mill, a sawmill, a brickyard, and a furniture factory. In the late 19th century, Edgerton was a major center for the production of cheese and butter.
Geography
Edgerton is located in the southeastern part of Rock County, Wisconsin. It is situated on the Rock River, about 25 miles south of Madison. The city has a total area of 2.3 square miles, all of which is land.
The city is located in a rural area, with rolling hills and farmland. The terrain is mostly flat, with some areas of higher elevation. The city is surrounded by several small towns and villages, including Milton, Janesville, and Stoughton.
Economy
Edgerton’s economy is largely based on agriculture and manufacturing. The city is home to several large companies, including the Edgerton Canning Company, which produces canned fruits and vegetables. The city is also home to several smaller businesses, such as restaurants, retail stores, and service providers.
The city is also home to several educational institutions, including Edgerton High School and Edgerton Technical College. The city is also home to several parks and recreational areas, including the Edgerton City Park and the Edgerton Nature Center.
Demographics
As of the 2010 census, Edgerton had a population of 4,719 people. The racial makeup of the city was 95.3% White, 0.7% African American, 0.3% Native American, 0.7% Asian, 0.1% Pacific Islander, 1.2% from other races, and 1.7% from two or more races. Hispanic or Latino of any race were 3.2% of the population.
The median income for a household in Edgerton was $45,938, and the median income for a family was $54,938. The per capita income for the city was $20,938. About 8.2% of families and 10.2% of the population were below the poverty line, including 14.2% of those under age 18 and 6.2% of those age 65 or over.
Edgerton is a small city with a rich history and a diverse economy. The city is home to several businesses and educational institutions, as well as several parks and recreational areas. The city has a population of 4,719 people, with a median income of $45,938. The city is largely white, with a small percentage of African American, Native American, Asian, and Pacific Islander residents.
Common Questions
What is Per Capita Income in Edgerton?
Per Capita income in Edgerton is $35,262.
What is the Median Family Income in Edgerton?
Median Family Income in Edgerton is $96,402.
What is the Median Household income in Edgerton?
Median Household Income in Edgerton is $80,255.
What is Income or Wage Gap in Edgerton?
Income or Wage Gap in Edgerton is 31.3%.
Women in Edgerton earn 68.7 cents for every dollar earned by a man.
What is Inequality or Gini Index in Edgerton?
Inequality or Gini Index in Edgerton is 0.37.
What is the Total Population of Edgerton?
Total Population of Edgerton is 5,878.
What is the Total Male Population of Edgerton?
Total Male Population of Edgerton is 3,085.
What is the Total Female Population of Edgerton?
Total Female Population of Edgerton is 2,793.
What is the Ratio of Males per 100 Females in Edgerton?
There are 110.45 Males per 100 Females in Edgerton.
What is the Ratio of Females per 100 Males in Edgerton?
There are 90.53 Females per 100 Males in Edgerton.
What is the Median Population Age in Edgerton?
Median Population Age in Edgerton is 36.0 Years.
What is the Average Family Size in Edgerton
Average Family Size in Edgerton is 3.2 People.
What is the Average Household Size in Edgerton
Average Household Size in Edgerton is 2.6 People.
How Large is the Labor Force in Edgerton?
There are 3,188 People in the Labor Forcein in Edgerton.
What is the Percentage of People in the Labor Force in Edgerton?
69.1% of People are in the Labor Force in Edgerton.
What is the Unemployment Rate in Edgerton?
Unemployment Rate in Edgerton is 4.7%.