Zip Codes with the Highest Unemployment Rate in Washington
RELATED REPORTS & OPTIONS
Highest Unemployment
Washington
Compare Zip Codes
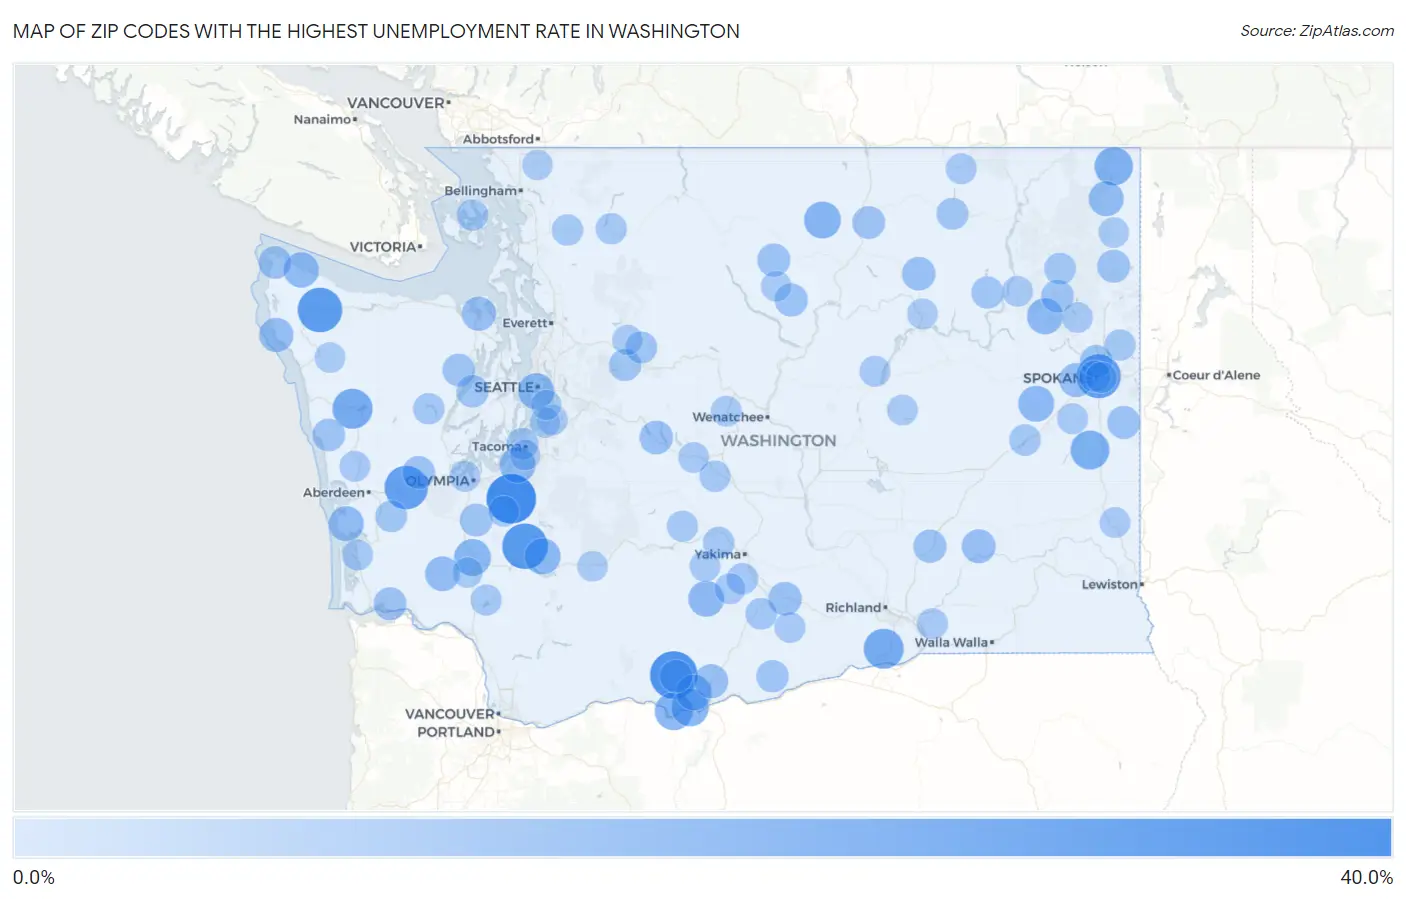
Map of Zip Codes with the Highest Unemployment Rate in Washington
0.0%
40.0%
Zip Codes with the Highest Unemployment Rate in Washington
| Zip Code | Unemployment Rate | vs State | vs National | |
| 1. | 98558 | 40.0% | 4.6%(+35.4)#1 | 5.0%(+35.0)#184 |
| 2. | 98670 | 36.4% | 4.6%(+31.8)#2 | 5.0%(+31.4)#225 |
| 3. | 98533 | 33.1% | 4.6%(+28.5)#3 | 5.0%(+28.1)#274 |
| 4. | 98305 | 31.4% | 4.6%(+26.8)#4 | 5.0%(+26.4)#312 |
| 5. | 99258 | 30.5% | 4.6%(+25.9)#5 | 5.0%(+25.5)#326 |
| 6. | 98583 | 29.5% | 4.6%(+24.9)#6 | 5.0%(+24.5)#353 |
| 7. | 98526 | 23.7% | 4.6%(+19.1)#7 | 5.0%(+18.7)#572 |
| 8. | 99346 | 23.6% | 4.6%(+19.0)#8 | 5.0%(+18.6)#575 |
| 9. | 99149 | 21.6% | 4.6%(+17.0)#9 | 5.0%(+16.6)#691 |
| 10. | 99153 | 20.8% | 4.6%(+16.2)#10 | 5.0%(+15.8)#740 |
| 11. | 98617 | 20.1% | 4.6%(+15.5)#11 | 5.0%(+15.1)#786 |
| 12. | 98673 | 19.6% | 4.6%(+15.0)#12 | 5.0%(+14.6)#852 |
| 13. | 98819 | 18.3% | 4.6%(+13.7)#13 | 5.0%(+13.3)#969 |
| 14. | 98565 | 18.2% | 4.6%(+13.6)#14 | 5.0%(+13.2)#979 |
| 15. | 98356 | 17.1% | 4.6%(+12.5)#15 | 5.0%(+12.1)#1,107 |
| 16. | 98134 | 17.1% | 4.6%(+12.5)#16 | 5.0%(+12.1)#1,110 |
| 17. | 99173 | 16.9% | 4.6%(+12.3)#17 | 5.0%(+11.9)#1,136 |
| 18. | 98952 | 16.7% | 4.6%(+12.1)#18 | 5.0%(+11.7)#1,169 |
| 19. | 99008 | 16.7% | 4.6%(+12.1)#19 | 5.0%(+11.7)#1,179 |
| 20. | 98439 | 16.6% | 4.6%(+12.0)#20 | 5.0%(+11.6)#1,188 |
| 21. | 98613 | 16.5% | 4.6%(+11.9)#21 | 5.0%(+11.5)#1,199 |
| 22. | 98381 | 15.6% | 4.6%(+11.0)#22 | 5.0%(+10.6)#1,319 |
| 23. | 98547 | 15.4% | 4.6%(+10.8)#23 | 5.0%(+10.4)#1,347 |
| 24. | 99139 | 15.1% | 4.6%(+10.5)#24 | 5.0%(+10.1)#1,420 |
| 25. | 98538 | 14.7% | 4.6%(+10.1)#25 | 5.0%(+9.70)#1,500 |
| 26. | 98350 | 14.0% | 4.6%(+9.40)#26 | 5.0%(+9.00)#1,655 |
| 27. | 98368 | 13.6% | 4.6%(+9.00)#27 | 5.0%(+8.60)#1,737 |
| 28. | 98620 | 13.6% | 4.6%(+9.00)#28 | 5.0%(+8.60)#1,739 |
| 29. | 99001 | 13.5% | 4.6%(+8.90)#29 | 5.0%(+8.50)#1,762 |
| 30. | 99335 | 13.4% | 4.6%(+8.80)#30 | 5.0%(+8.40)#1,815 |
| 31. | 98925 | 13.0% | 4.6%(+8.40)#31 | 5.0%(+8.00)#1,926 |
| 32. | 98932 | 12.8% | 4.6%(+8.20)#32 | 5.0%(+7.80)#1,964 |
| 33. | 99155 | 12.7% | 4.6%(+8.10)#33 | 5.0%(+7.70)#2,006 |
| 34. | 99326 | 12.2% | 4.6%(+7.60)#34 | 5.0%(+7.20)#2,170 |
| 35. | 99012 | 12.0% | 4.6%(+7.40)#35 | 5.0%(+7.00)#2,261 |
| 36. | 98834 | 12.0% | 4.6%(+7.40)#36 | 5.0%(+7.00)#2,268 |
| 37. | 98856 | 11.9% | 4.6%(+7.30)#37 | 5.0%(+6.90)#2,289 |
| 38. | 98643 | 11.7% | 4.6%(+7.10)#38 | 5.0%(+6.70)#2,382 |
| 39. | 98628 | 11.7% | 4.6%(+7.10)#39 | 5.0%(+6.70)#2,384 |
| 40. | 98541 | 11.6% | 4.6%(+7.00)#40 | 5.0%(+6.60)#2,396 |
| 41. | 98530 | 11.6% | 4.6%(+7.00)#41 | 5.0%(+6.60)#2,427 |
| 42. | 98849 | 11.5% | 4.6%(+6.90)#42 | 5.0%(+6.50)#2,456 |
| 43. | 99180 | 11.5% | 4.6%(+6.90)#43 | 5.0%(+6.50)#2,458 |
| 44. | 99181 | 11.3% | 4.6%(+6.70)#44 | 5.0%(+6.30)#2,544 |
| 45. | 98587 | 11.3% | 4.6%(+6.70)#45 | 5.0%(+6.30)#2,554 |
| 46. | 98357 | 11.2% | 4.6%(+6.60)#46 | 5.0%(+6.20)#2,594 |
| 47. | 99251 | 11.2% | 4.6%(+6.60)#47 | 5.0%(+6.20)#2,598 |
| 48. | 98320 | 11.1% | 4.6%(+6.50)#48 | 5.0%(+6.10)#2,627 |
| 49. | 98380 | 11.0% | 4.6%(+6.40)#49 | 5.0%(+6.00)#2,668 |
| 50. | 99356 | 10.8% | 4.6%(+6.20)#50 | 5.0%(+5.80)#2,808 |
| 51. | 99138 | 10.5% | 4.6%(+5.90)#51 | 5.0%(+5.50)#2,964 |
| 52. | 98224 | 10.2% | 4.6%(+5.60)#52 | 5.0%(+5.20)#3,155 |
| 53. | 99166 | 10.1% | 4.6%(+5.50)#53 | 5.0%(+5.10)#3,200 |
| 54. | 98537 | 9.8% | 4.6%(+5.20)#54 | 5.0%(+4.80)#3,395 |
| 55. | 98256 | 9.8% | 4.6%(+5.20)#55 | 5.0%(+4.80)#3,428 |
| 56. | 98402 | 9.7% | 4.6%(+5.10)#56 | 5.0%(+4.70)#3,464 |
| 57. | 99109 | 9.7% | 4.6%(+5.10)#57 | 5.0%(+4.70)#3,468 |
| 58. | 99201 | 9.5% | 4.6%(+4.90)#58 | 5.0%(+4.50)#3,597 |
| 59. | 98948 | 9.5% | 4.6%(+4.90)#59 | 5.0%(+4.50)#3,600 |
| 60. | 98923 | 9.4% | 4.6%(+4.80)#60 | 5.0%(+4.40)#3,711 |
| 61. | 98280 | 9.4% | 4.6%(+4.80)#61 | 5.0%(+4.40)#3,725 |
| 62. | 98951 | 9.2% | 4.6%(+4.60)#62 | 5.0%(+4.20)#3,830 |
| 63. | 98548 | 9.2% | 4.6%(+4.60)#63 | 5.0%(+4.20)#3,847 |
| 64. | 99032 | 9.2% | 4.6%(+4.60)#64 | 5.0%(+4.20)#3,873 |
| 65. | 99021 | 9.0% | 4.6%(+4.40)#65 | 5.0%(+4.00)#3,995 |
| 66. | 98263 | 9.0% | 4.6%(+4.40)#66 | 5.0%(+4.00)#4,051 |
| 67. | 98237 | 8.9% | 4.6%(+4.30)#67 | 5.0%(+3.90)#4,091 |
| 68. | 98946 | 8.9% | 4.6%(+4.30)#68 | 5.0%(+3.90)#4,130 |
| 69. | 99202 | 8.8% | 4.6%(+4.20)#69 | 5.0%(+3.80)#4,163 |
| 70. | 98937 | 8.5% | 4.6%(+3.90)#70 | 5.0%(+3.50)#4,515 |
| 71. | 98645 | 8.5% | 4.6%(+3.90)#71 | 5.0%(+3.50)#4,533 |
| 72. | 98527 | 8.5% | 4.6%(+3.90)#72 | 5.0%(+3.50)#4,564 |
| 73. | 99115 | 8.4% | 4.6%(+3.80)#73 | 5.0%(+3.40)#4,659 |
| 74. | 98505 | 8.4% | 4.6%(+3.80)#74 | 5.0%(+3.40)#4,674 |
| 75. | 99004 | 8.3% | 4.6%(+3.70)#75 | 5.0%(+3.30)#4,701 |
| 76. | 99323 | 8.3% | 4.6%(+3.70)#76 | 5.0%(+3.30)#4,749 |
| 77. | 98933 | 8.3% | 4.6%(+3.70)#77 | 5.0%(+3.30)#4,779 |
| 78. | 99118 | 8.3% | 4.6%(+3.70)#78 | 5.0%(+3.30)#4,785 |
| 79. | 98550 | 8.2% | 4.6%(+3.60)#79 | 5.0%(+3.20)#4,851 |
| 80. | 98576 | 8.2% | 4.6%(+3.60)#80 | 5.0%(+3.20)#4,874 |
| 81. | 98943 | 8.2% | 4.6%(+3.60)#81 | 5.0%(+3.20)#4,919 |
| 82. | 98903 | 8.1% | 4.6%(+3.50)#82 | 5.0%(+3.10)#4,962 |
| 83. | 98935 | 8.1% | 4.6%(+3.50)#83 | 5.0%(+3.10)#4,995 |
| 84. | 98847 | 8.1% | 4.6%(+3.50)#84 | 5.0%(+3.10)#5,006 |
| 85. | 98408 | 8.0% | 4.6%(+3.40)#85 | 5.0%(+3.00)#5,091 |
| 86. | 99110 | 8.0% | 4.6%(+3.40)#86 | 5.0%(+3.00)#5,161 |
| 87. | 99102 | 8.0% | 4.6%(+3.40)#87 | 5.0%(+3.00)#5,184 |
| 88. | 99137 | 8.0% | 4.6%(+3.40)#88 | 5.0%(+3.00)#5,187 |
| 89. | 98860 | 8.0% | 4.6%(+3.40)#89 | 5.0%(+3.00)#5,196 |
| 90. | 98331 | 7.8% | 4.6%(+3.20)#90 | 5.0%(+2.80)#5,387 |
| 91. | 99116 | 7.8% | 4.6%(+3.20)#91 | 5.0%(+2.80)#5,427 |
| 92. | 98377 | 7.7% | 4.6%(+3.10)#92 | 5.0%(+2.70)#5,564 |
| 93. | 99119 | 7.7% | 4.6%(+3.10)#93 | 5.0%(+2.70)#5,574 |
| 94. | 98814 | 7.7% | 4.6%(+3.10)#94 | 5.0%(+2.70)#5,595 |
| 95. | 98031 | 7.6% | 4.6%(+3.00)#95 | 5.0%(+2.60)#5,614 |
| 96. | 98032 | 7.6% | 4.6%(+3.00)#96 | 5.0%(+2.60)#5,617 |
| 97. | 98247 | 7.6% | 4.6%(+3.00)#97 | 5.0%(+2.60)#5,667 |
| 98. | 98178 | 7.5% | 4.6%(+2.90)#98 | 5.0%(+2.50)#5,766 |
| 99. | 98596 | 7.5% | 4.6%(+2.90)#99 | 5.0%(+2.50)#5,801 |
| 100. | 98251 | 7.5% | 4.6%(+2.90)#100 | 5.0%(+2.50)#5,820 |
Common Questions
What are the Top 10 Zip Codes with the Highest Unemployment Rate in Washington?
Top 10 Zip Codes with the Highest Unemployment Rate in Washington are:
What zip code has the Highest Unemployment Rate in Washington?
98558 has the Highest Unemployment Rate in Washington with 40.0%.
What is the Unemployment Rate in the State of Washington?
Unemployment Rate in Washington is 4.6%.
What is the Unemployment Rate in the United States?
Unemployment Rate in the United States is 5.0%.