Zip Codes with the Highest Percentage of Population Employed in Construction & Extraction in Washington
RELATED REPORTS & OPTIONS
Construction & Extraction
Washington
Compare Zip Codes
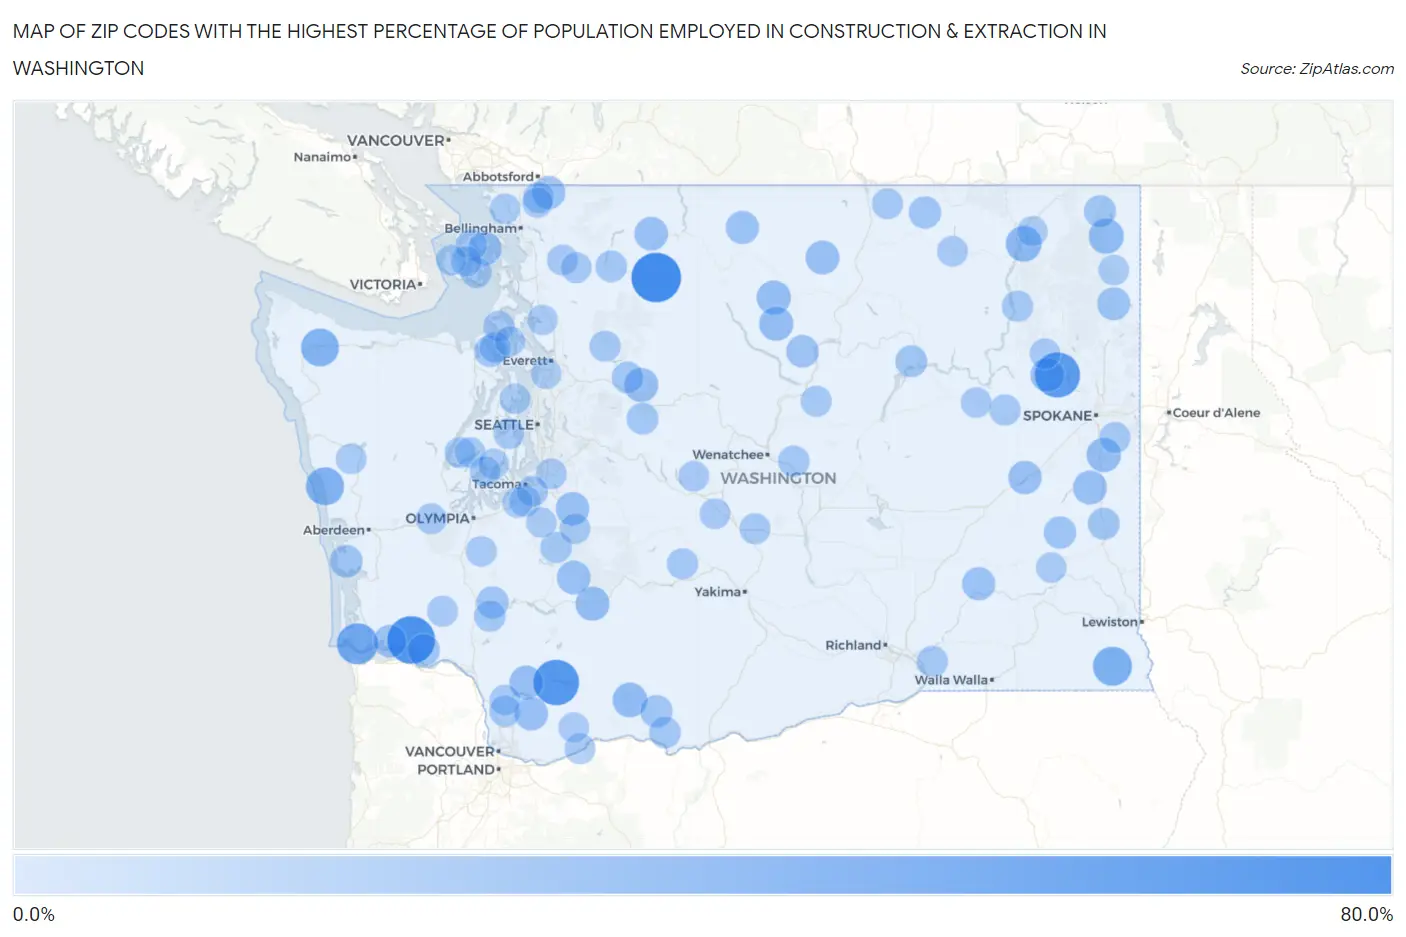
Map of Zip Codes with the Highest Percentage of Population Employed in Construction & Extraction in Washington
0.0%
80.0%
Zip Codes with the Highest Percentage of Population Employed in Construction & Extraction in Washington
| Zip Code | % Employed | vs State | vs National | |
| 1. | 98267 | 60.6% | 4.9%(+55.7)#1 | 5.0%(+55.6)#81 |
| 2. | 98647 | 55.6% | 4.9%(+50.6)#2 | 5.0%(+50.6)#99 |
| 3. | 98616 | 50.0% | 4.9%(+45.1)#3 | 5.0%(+45.0)#129 |
| 4. | 99034 | 48.6% | 4.9%(+43.7)#4 | 5.0%(+43.6)#138 |
| 5. | 98614 | 37.5% | 4.9%(+32.6)#5 | 5.0%(+32.6)#250 |
| 6. | 99401 | 31.9% | 4.9%(+27.0)#6 | 5.0%(+26.9)#358 |
| 7. | 98562 | 29.5% | 4.9%(+24.6)#7 | 5.0%(+24.5)#411 |
| 8. | 98305 | 28.9% | 4.9%(+24.0)#8 | 5.0%(+23.9)#428 |
| 9. | 99151 | 23.4% | 4.9%(+18.5)#9 | 5.0%(+18.4)#689 |
| 10. | 99139 | 21.5% | 4.9%(+16.6)#10 | 5.0%(+16.5)#841 |
| 11. | 98650 | 20.5% | 4.9%(+15.6)#11 | 5.0%(+15.5)#937 |
| 12. | 99031 | 19.7% | 4.9%(+14.8)#12 | 5.0%(+14.7)#1,039 |
| 13. | 98856 | 19.2% | 4.9%(+14.3)#13 | 5.0%(+14.2)#1,097 |
| 14. | 98814 | 19.2% | 4.9%(+14.3)#14 | 5.0%(+14.2)#1,098 |
| 15. | 98377 | 19.0% | 4.9%(+14.1)#15 | 5.0%(+14.0)#1,136 |
| 16. | 98256 | 18.9% | 4.9%(+14.0)#16 | 5.0%(+13.9)#1,152 |
| 17. | 99149 | 18.6% | 4.9%(+13.7)#17 | 5.0%(+13.6)#1,199 |
| 18. | 99013 | 18.3% | 4.9%(+13.4)#18 | 5.0%(+13.3)#1,248 |
| 19. | 98603 | 18.2% | 4.9%(+13.3)#19 | 5.0%(+13.2)#1,259 |
| 20. | 98819 | 17.9% | 4.9%(+13.0)#20 | 5.0%(+12.9)#1,315 |
| 21. | 98355 | 17.6% | 4.9%(+12.7)#21 | 5.0%(+12.7)#1,353 |
| 22. | 98283 | 17.6% | 4.9%(+12.6)#22 | 5.0%(+12.6)#1,371 |
| 23. | 98396 | 17.2% | 4.9%(+12.3)#23 | 5.0%(+12.2)#1,432 |
| 24. | 99032 | 17.1% | 4.9%(+12.2)#24 | 5.0%(+12.1)#1,454 |
| 25. | 98675 | 17.1% | 4.9%(+12.1)#25 | 5.0%(+12.1)#1,462 |
| 26. | 98279 | 16.7% | 4.9%(+11.8)#26 | 5.0%(+11.7)#1,522 |
| 27. | 98295 | 16.7% | 4.9%(+11.8)#27 | 5.0%(+11.7)#1,535 |
| 28. | 99335 | 16.7% | 4.9%(+11.7)#28 | 5.0%(+11.7)#1,555 |
| 29. | 98833 | 16.4% | 4.9%(+11.5)#29 | 5.0%(+11.4)#1,621 |
| 30. | 99180 | 15.9% | 4.9%(+11.0)#30 | 5.0%(+10.9)#1,735 |
| 31. | 98643 | 15.7% | 4.9%(+10.8)#31 | 5.0%(+10.7)#1,795 |
| 32. | 98547 | 15.3% | 4.9%(+10.4)#32 | 5.0%(+10.3)#1,904 |
| 33. | 98846 | 14.8% | 4.9%(+9.85)#33 | 5.0%(+9.77)#2,125 |
| 34. | 98602 | 14.8% | 4.9%(+9.84)#34 | 5.0%(+9.76)#2,135 |
| 35. | 99125 | 14.5% | 4.9%(+9.62)#35 | 5.0%(+9.54)#2,224 |
| 36. | 98542 | 14.4% | 4.9%(+9.49)#36 | 5.0%(+9.42)#2,276 |
| 37. | 98859 | 14.3% | 4.9%(+9.37)#37 | 5.0%(+9.29)#2,320 |
| 38. | 98612 | 13.9% | 4.9%(+8.97)#38 | 5.0%(+8.89)#2,514 |
| 39. | 99152 | 13.6% | 4.9%(+8.64)#39 | 5.0%(+8.57)#2,674 |
| 40. | 99174 | 13.3% | 4.9%(+8.42)#40 | 5.0%(+8.34)#2,788 |
| 41. | 99133 | 13.1% | 4.9%(+8.17)#41 | 5.0%(+8.10)#2,885 |
| 42. | 98635 | 12.7% | 4.9%(+7.77)#42 | 5.0%(+7.69)#3,128 |
| 43. | 98288 | 12.7% | 4.9%(+7.74)#43 | 5.0%(+7.66)#3,150 |
| 44. | 98339 | 12.5% | 4.9%(+7.58)#44 | 5.0%(+7.50)#3,277 |
| 45. | 98251 | 12.5% | 4.9%(+7.54)#45 | 5.0%(+7.46)#3,298 |
| 46. | 98237 | 12.1% | 4.9%(+7.14)#46 | 5.0%(+7.07)#3,550 |
| 47. | 98850 | 11.9% | 4.9%(+6.97)#47 | 5.0%(+6.89)#3,660 |
| 48. | 98328 | 11.8% | 4.9%(+6.90)#48 | 5.0%(+6.83)#3,706 |
| 49. | 98591 | 11.6% | 4.9%(+6.68)#49 | 5.0%(+6.60)#3,887 |
| 50. | 98358 | 11.4% | 4.9%(+6.49)#50 | 5.0%(+6.41)#4,032 |
| 51. | 98245 | 11.3% | 4.9%(+6.41)#51 | 5.0%(+6.33)#4,088 |
| 52. | 98937 | 11.2% | 4.9%(+6.28)#52 | 5.0%(+6.20)#4,199 |
| 53. | 98261 | 11.2% | 4.9%(+6.26)#53 | 5.0%(+6.19)#4,211 |
| 54. | 99122 | 11.2% | 4.9%(+6.26)#54 | 5.0%(+6.18)#4,219 |
| 55. | 99131 | 11.1% | 4.9%(+6.19)#55 | 5.0%(+6.12)#4,290 |
| 56. | 99036 | 11.1% | 4.9%(+6.16)#56 | 5.0%(+6.08)#4,308 |
| 57. | 98629 | 11.0% | 4.9%(+6.06)#57 | 5.0%(+5.98)#4,386 |
| 58. | 98276 | 11.0% | 4.9%(+6.05)#58 | 5.0%(+5.97)#4,396 |
| 59. | 98858 | 10.9% | 4.9%(+5.97)#59 | 5.0%(+5.89)#4,480 |
| 60. | 98252 | 10.9% | 4.9%(+5.94)#60 | 5.0%(+5.86)#4,519 |
| 61. | 98844 | 10.8% | 4.9%(+5.90)#61 | 5.0%(+5.83)#4,541 |
| 62. | 99323 | 10.8% | 4.9%(+5.85)#62 | 5.0%(+5.78)#4,582 |
| 63. | 98934 | 10.7% | 4.9%(+5.79)#63 | 5.0%(+5.71)#4,648 |
| 64. | 98239 | 10.6% | 4.9%(+5.66)#64 | 5.0%(+5.58)#4,780 |
| 65. | 98284 | 10.5% | 4.9%(+5.56)#65 | 5.0%(+5.48)#4,884 |
| 66. | 98588 | 10.5% | 4.9%(+5.54)#66 | 5.0%(+5.46)#4,909 |
| 67. | 98538 | 10.4% | 4.9%(+5.48)#67 | 5.0%(+5.41)#4,965 |
| 68. | 98589 | 10.4% | 4.9%(+5.45)#68 | 5.0%(+5.37)#5,004 |
| 69. | 98639 | 10.4% | 4.9%(+5.45)#69 | 5.0%(+5.37)#5,005 |
| 70. | 98255 | 10.3% | 4.9%(+5.43)#70 | 5.0%(+5.35)#5,040 |
| 71. | 98002 | 10.3% | 4.9%(+5.40)#71 | 5.0%(+5.32)#5,068 |
| 72. | 98674 | 10.3% | 4.9%(+5.35)#72 | 5.0%(+5.28)#5,114 |
| 73. | 98444 | 10.2% | 4.9%(+5.29)#73 | 5.0%(+5.21)#5,181 |
| 74. | 99166 | 10.2% | 4.9%(+5.28)#74 | 5.0%(+5.21)#5,183 |
| 75. | 98443 | 10.2% | 4.9%(+5.25)#75 | 5.0%(+5.18)#5,207 |
| 76. | 98557 | 10.1% | 4.9%(+5.21)#76 | 5.0%(+5.13)#5,245 |
| 77. | 98946 | 10.1% | 4.9%(+5.15)#77 | 5.0%(+5.07)#5,329 |
| 78. | 98366 | 10.0% | 4.9%(+5.07)#78 | 5.0%(+5.00)#5,415 |
| 79. | 98922 | 10.0% | 4.9%(+5.05)#79 | 5.0%(+4.97)#5,449 |
| 80. | 99117 | 9.8% | 4.9%(+4.93)#80 | 5.0%(+4.85)#5,593 |
| 81. | 99173 | 9.8% | 4.9%(+4.92)#81 | 5.0%(+4.85)#5,601 |
| 82. | 98286 | 9.8% | 4.9%(+4.89)#82 | 5.0%(+4.81)#5,639 |
| 83. | 98566 | 9.7% | 4.9%(+4.79)#83 | 5.0%(+4.71)#5,750 |
| 84. | 99143 | 9.7% | 4.9%(+4.78)#84 | 5.0%(+4.70)#5,763 |
| 85. | 98323 | 9.6% | 4.9%(+4.69)#85 | 5.0%(+4.62)#5,887 |
| 86. | 98247 | 9.6% | 4.9%(+4.64)#86 | 5.0%(+4.56)#5,957 |
| 87. | 98528 | 9.5% | 4.9%(+4.63)#87 | 5.0%(+4.55)#5,976 |
| 88. | 98329 | 9.5% | 4.9%(+4.58)#88 | 5.0%(+4.51)#6,040 |
| 89. | 98439 | 9.4% | 4.9%(+4.48)#89 | 5.0%(+4.40)#6,176 |
| 90. | 98250 | 9.4% | 4.9%(+4.45)#90 | 5.0%(+4.37)#6,213 |
| 91. | 98338 | 9.3% | 4.9%(+4.40)#91 | 5.0%(+4.32)#6,286 |
| 92. | 98204 | 9.3% | 4.9%(+4.39)#92 | 5.0%(+4.31)#6,300 |
| 93. | 98248 | 9.3% | 4.9%(+4.37)#93 | 5.0%(+4.29)#6,331 |
| 94. | 99119 | 9.3% | 4.9%(+4.36)#94 | 5.0%(+4.28)#6,338 |
| 95. | 98394 | 9.3% | 4.9%(+4.36)#95 | 5.0%(+4.28)#6,339 |
| 96. | 98342 | 9.2% | 4.9%(+4.32)#96 | 5.0%(+4.25)#6,388 |
| 97. | 98292 | 9.2% | 4.9%(+4.31)#97 | 5.0%(+4.23)#6,412 |
| 98. | 98253 | 9.2% | 4.9%(+4.28)#98 | 5.0%(+4.21)#6,450 |
| 99. | 98610 | 9.2% | 4.9%(+4.28)#99 | 5.0%(+4.20)#6,455 |
| 100. | 99126 | 9.1% | 4.9%(+4.17)#100 | 5.0%(+4.10)#6,614 |
Common Questions
What are the Top 10 Zip Codes with the Highest Percentage of Population Employed in Construction & Extraction in Washington?
Top 10 Zip Codes with the Highest Percentage of Population Employed in Construction & Extraction in Washington are:
What zip code has the Highest Percentage of Population Employed in Construction & Extraction in Washington?
98267 has the Highest Percentage of Population Employed in Construction & Extraction in Washington with 60.6%.
What is the Percentage of Population Employed in Construction & Extraction in the State of Washington?
Percentage of Population Employed in Construction & Extraction in Washington is 4.9%.
What is the Percentage of Population Employed in Construction & Extraction in the United States?
Percentage of Population Employed in Construction & Extraction in the United States is 5.0%.