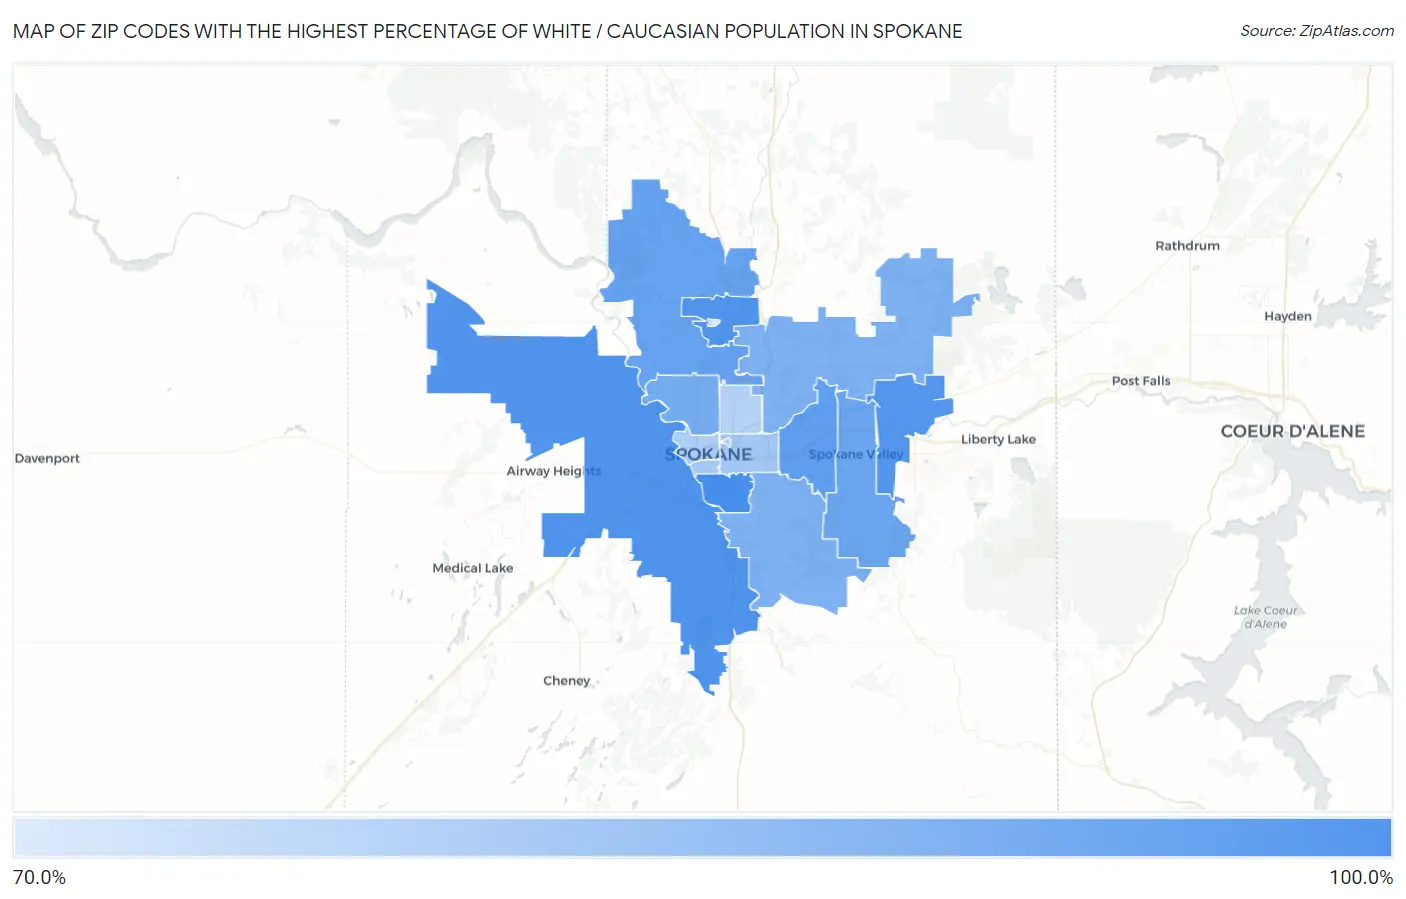
Zip Codes with the Highest Percentage of White / Caucasian Population in Spokane, WA
RELATED REPORTS & OPTIONS
White / Caucasian
Spokane
Compare Zip Codes
Map of Zip Codes with the Highest Percentage of White / Caucasian Population in Spokane
72.2%
89.4%
Zip Codes with the Highest Percentage of White / Caucasian Population in Spokane, WA
| Zip Code | White / Caucasian | vs State | vs National | |
| 1. | 99203 | 89.4% | 69.9%(+19.5)#142 | 65.9%(+23.5)#15,359 |
| 2. | 99218 | 88.5% | 69.9%(+18.6)#157 | 65.9%(+22.6)#16,101 |
| 3. | 99224 | 88.4% | 69.9%(+18.5)#159 | 65.9%(+22.6)#16,125 |
| 4. | 99216 | 87.8% | 69.9%(+17.8)#174 | 65.9%(+21.9)#16,625 |
| 5. | 99212 | 86.5% | 69.9%(+16.6)#205 | 65.9%(+20.6)#17,508 |
| 6. | 99208 | 86.0% | 69.9%(+16.0)#214 | 65.9%(+20.1)#17,825 |
| 7. | 99206 | 85.1% | 69.9%(+15.2)#229 | 65.9%(+19.2)#18,371 |
| 8. | 99205 | 84.0% | 69.9%(+14.1)#251 | 65.9%(+18.1)#18,973 |
| 9. | 99223 | 82.9% | 69.9%(+13.0)#267 | 65.9%(+17.1)#19,523 |
| 10. | 99217 | 82.8% | 69.9%(+12.9)#270 | 65.9%(+16.9)#19,610 |
| 11. | 99202 | 78.6% | 69.9%(+8.70)#333 | 65.9%(+12.7)#21,589 |
| 12. | 99204 | 78.4% | 69.9%(+8.50)#337 | 65.9%(+12.5)#21,677 |
| 13. | 99201 | 77.5% | 69.9%(+7.59)#351 | 65.9%(+11.6)#22,063 |
| 14. | 99258 | 77.1% | 69.9%(+7.18)#354 | 65.9%(+11.2)#22,229 |
| 15. | 99207 | 76.5% | 69.9%(+6.62)#361 | 65.9%(+10.6)#22,452 |
| 16. | 99251 | 72.2% | 69.9%(+2.25)#402 | 65.9%(+6.28)#24,057 |
1
Common Questions
What are the Top 10 Zip Codes with the Highest Percentage of White / Caucasian Population in Spokane, WA?
Top 10 Zip Codes with the Highest Percentage of White / Caucasian Population in Spokane, WA are:
What zip code has the Highest Percentage of White / Caucasian Population in Spokane, WA?
99203 has the Highest Percentage of White / Caucasian Population in Spokane, WA with 89.4%.
What is the Percentage of White / Caucasian Population in Spokane, WA?
Percentage of White / Caucasian Population in Spokane is 82.0%.
What is the Percentage of White / Caucasian Population in Washington?
Percentage of White / Caucasian Population in Washington is 69.9%.
What is the Percentage of White / Caucasian Population in the United States?
Percentage of White / Caucasian Population in the United States is 65.9%.