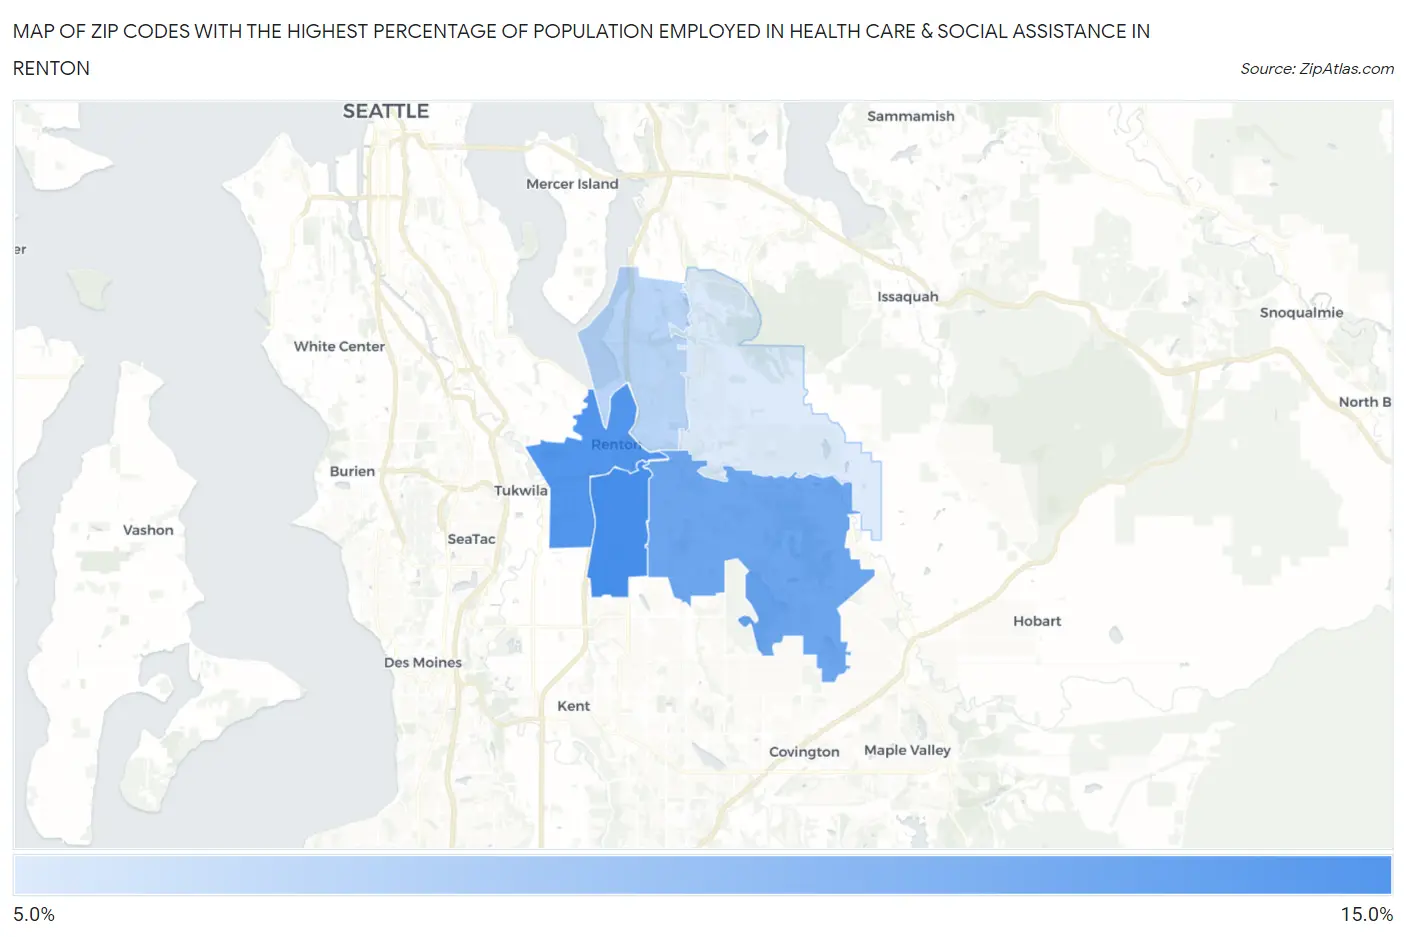
Zip Codes with the Highest Percentage of Population Employed in Health Care & Social Assistance in Renton, WA
RELATED REPORTS & OPTIONS
Health Care & Social Assistance
Renton
Compare Zip Codes
Map of Zip Codes with the Highest Percentage of Population Employed in Health Care & Social Assistance in Renton
0.0%
15.0%
Zip Codes with the Highest Percentage of Population Employed in Health Care & Social Assistance in Renton, WA
| Zip Code | % Employed | vs State | vs National | |
| 1. | 98055 | 13.6% | 13.0%(+0.557)#223 | 13.9%(-0.341)#15,045 |
| 2. | 98057 | 13.4% | 13.0%(+0.328)#232 | 13.9%(-0.570)#15,624 |
| 3. | 98058 | 12.8% | 13.0%(-0.287)#261 | 13.9%(-1.19)#17,225 |
| 4. | 98056 | 11.2% | 13.0%(-1.86)#329 | 13.9%(-2.76)#20,962 |
| 5. | 98059 | 10.5% | 13.0%(-2.55)#360 | 13.9%(-3.45)#22,463 |
1
Common Questions
What are the Top 3 Zip Codes with the Highest Percentage of Population Employed in Health Care & Social Assistance in Renton, WA?
Top 3 Zip Codes with the Highest Percentage of Population Employed in Health Care & Social Assistance in Renton, WA are:
What zip code has the Highest Percentage of Population Employed in Health Care & Social Assistance in Renton, WA?
98055 has the Highest Percentage of Population Employed in Health Care & Social Assistance in Renton, WA with 13.6%.
What is the Percentage of Population Employed in Health Care & Social Assistance in Renton, WA?
Percentage of Population Employed in Health Care & Social Assistance in Renton is 12.1%.
What is the Percentage of Population Employed in Health Care & Social Assistance in Washington?
Percentage of Population Employed in Health Care & Social Assistance in Washington is 13.0%.
What is the Percentage of Population Employed in Health Care & Social Assistance in the United States?
Percentage of Population Employed in Health Care & Social Assistance in the United States is 13.9%.