Zip Codes with the Highest Percentage of Population Employed in Agriculture, Fishing & Hunting in Port Angeles, WA
RELATED REPORTS & OPTIONS
Agriculture, Fishing & Hunting
Port Angeles
Compare Zip Codes
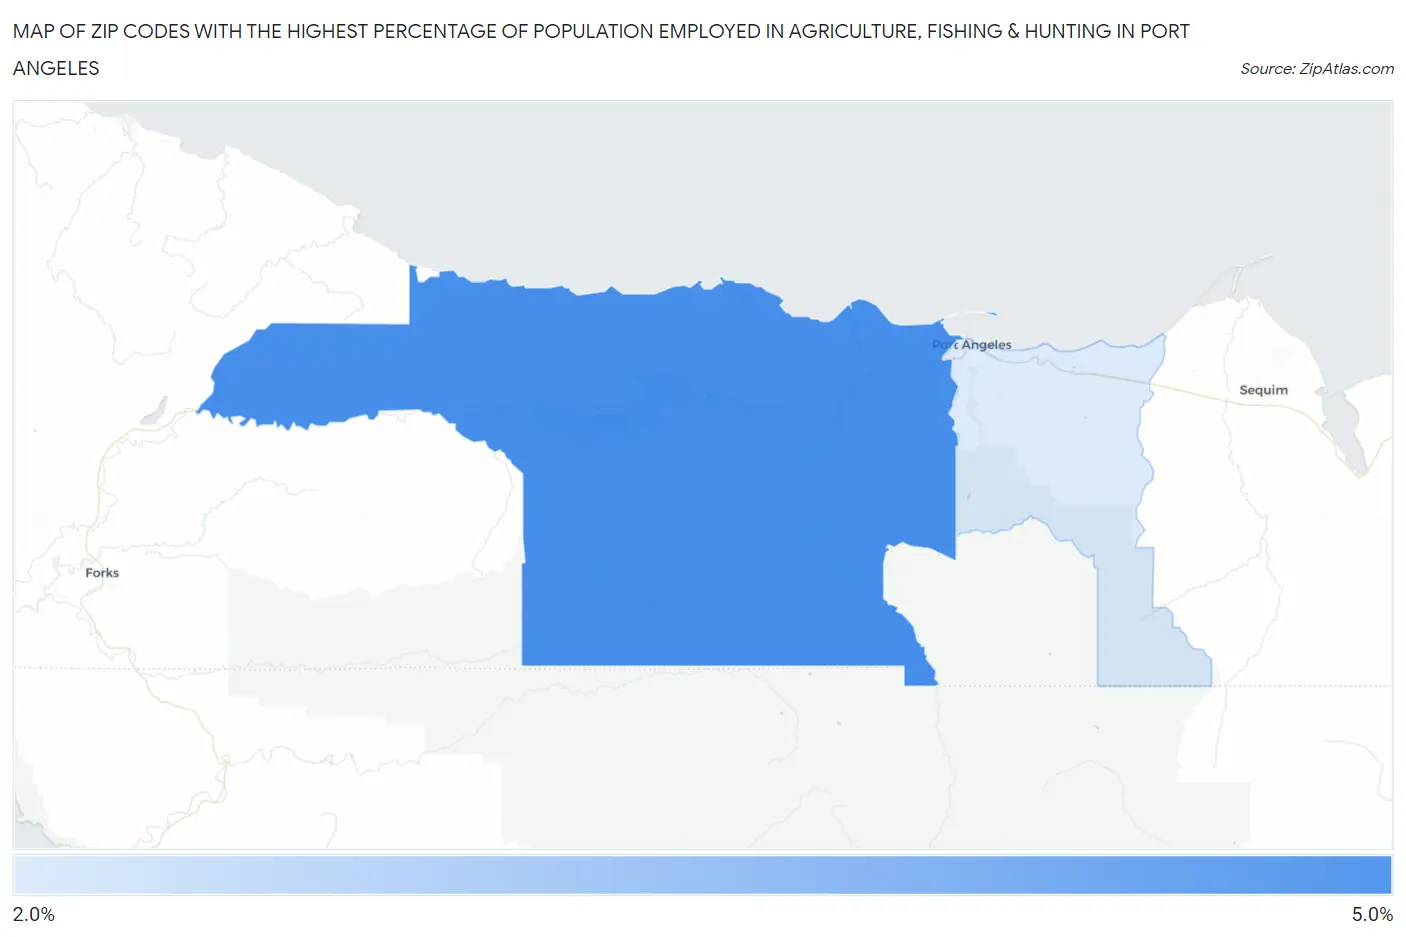
Map of Zip Codes with the Highest Percentage of Population Employed in Agriculture, Fishing & Hunting in Port Angeles
0.0%
5.0%
Zip Codes with the Highest Percentage of Population Employed in Agriculture, Fishing & Hunting in Port Angeles, WA
| Zip Code | % Employed | vs State | vs National | |
| 1. | 98363 | 4.5% | 2.4%(+2.14)#221 | 1.2%(+3.33)#8,377 |
| 2. | 98362 | 2.7% | 2.4%(+0.324)#265 | 1.2%(+1.52)#11,102 |
1
Common Questions
What are the Top Zip Codes with the Highest Percentage of Population Employed in Agriculture, Fishing & Hunting in Port Angeles, WA?
Top Zip Codes with the Highest Percentage of Population Employed in Agriculture, Fishing & Hunting in Port Angeles, WA are:
What zip code has the Highest Percentage of Population Employed in Agriculture, Fishing & Hunting in Port Angeles, WA?
98363 has the Highest Percentage of Population Employed in Agriculture, Fishing & Hunting in Port Angeles, WA with 4.5%.
What is the Percentage of Population Employed in Agriculture, Fishing & Hunting in Port Angeles, WA?
Percentage of Population Employed in Agriculture, Fishing & Hunting in Port Angeles is 4.2%.
What is the Percentage of Population Employed in Agriculture, Fishing & Hunting in Washington?
Percentage of Population Employed in Agriculture, Fishing & Hunting in Washington is 2.4%.
What is the Percentage of Population Employed in Agriculture, Fishing & Hunting in the United States?
Percentage of Population Employed in Agriculture, Fishing & Hunting in the United States is 1.2%.