Zip Codes with the Highest Percentage of Households Heated by Bottled Gas / Liquid Propane in Olympia, WA

RELATED REPORTS & OPTIONS

Bottled Gas / LP Heating
Population
Families and Households
Female Fertility
Female Fertility (Unmarried)
Race (Community Size)
Race (Percentage)
Ancestry (Community Size)
AfghanAfricanAlaska NativeAlaskan AthabascanAlbanianAleutAmericanArabArmenianAustralianAustrianBangladeshiBasqueBelgianBhutaneseBlackfeetBolivianBrazilianBritishBulgarianBurmeseCajunCanadianCelticCentral AmericanCentral American IndianCherokeeCheyenneChickasawChileanChippewaChoctawColombianColvilleComancheCreekCroatianCubanCzechCzechoslovakianDanishDominicanDutchEastern EuropeanEcuadorianEgyptianEnglishEthiopianEuropeanFilipinoFinnishFrenchFrench American IndianFrench CanadianGermanGerman RussianGreekGuamanian / ChamorroGuatemalanHaitianHonduranHungarianIcelanderIndian (Asian)IranianIraqiIrishIroquoisItalianJamaicanJapaneseKenyanKoreanLatvianLebaneseLithuanianLumbeeLuxembourgerMalaysianMenomineeMexicanMexican American IndianMoroccanNative HawaiianNavajoNicaraguanNigerianNorthern EuropeanNorwegianPakistaniPanamanianPennsylvania GermanPeruvianPolishPortuguesePuerto RicanPuget Sound SalishRomanianRussianSalvadoranSamoanScandinavianScotch-IrishScottishSerbianSiouxSlavicSlovakSloveneSouth AmericanSpaniardSpanishSri LankanSubsaharan AfricanSwedishSwissSyrianThaiTlingit-HaidaTrinidadian and TobagonianTurkishUkrainianVenezuelanWelshWest IndianYakamaYugoslavianYup'ik
Ancestry (Percentage)
AfghanAfricanAlaska NativeAlaskan AthabascanAlbanianAleutAmericanArabArmenianAustralianAustrianBangladeshiBasqueBelgianBhutaneseBlackfeetBolivianBrazilianBritishBulgarianBurmeseCajunCanadianCelticCentral AmericanCentral American IndianCherokeeCheyenneChickasawChileanChippewaChoctawColombianColvilleComancheCreekCroatianCubanCzechCzechoslovakianDanishDominicanDutchEastern EuropeanEcuadorianEgyptianEnglishEthiopianEuropeanFilipinoFinnishFrenchFrench American IndianFrench CanadianGermanGerman RussianGreekGuamanian / ChamorroGuatemalanHaitianHonduranHungarianIcelanderIndian (Asian)IranianIraqiIrishIroquoisItalianJamaicanJapaneseKenyanKoreanLatvianLebaneseLithuanianLumbeeLuxembourgerMalaysianMenomineeMexicanMexican American IndianMoroccanNative HawaiianNavajoNicaraguanNigerianNorthern EuropeanNorwegianPakistaniPanamanianPennsylvania GermanPeruvianPolishPortuguesePuerto RicanPuget Sound SalishRomanianRussianSalvadoranSamoanScandinavianScotch-IrishScottishSerbianSiouxSlavicSlovakSloveneSouth AmericanSpaniardSpanishSri LankanSubsaharan AfricanSwedishSwissSyrianThaiTlingit-HaidaTrinidadian and TobagonianTurkishUkrainianVenezuelanWelshWest IndianYakamaYugoslavianYup'ik
Immigrant Origin (Total)
Immigrant Origin (Percentage)
Income
Income (Families)
Income (Households)
Poverty
Poverty (Families)
Unemployment
Employment Occupations
Employment Industries
Employer Class
Commute Time
Commute Means
School Enrollment
Education by Degree Field
Occupancy
Finances
Physical Characteristics
Olympia
Compare Zip Codes
Comparison Subject

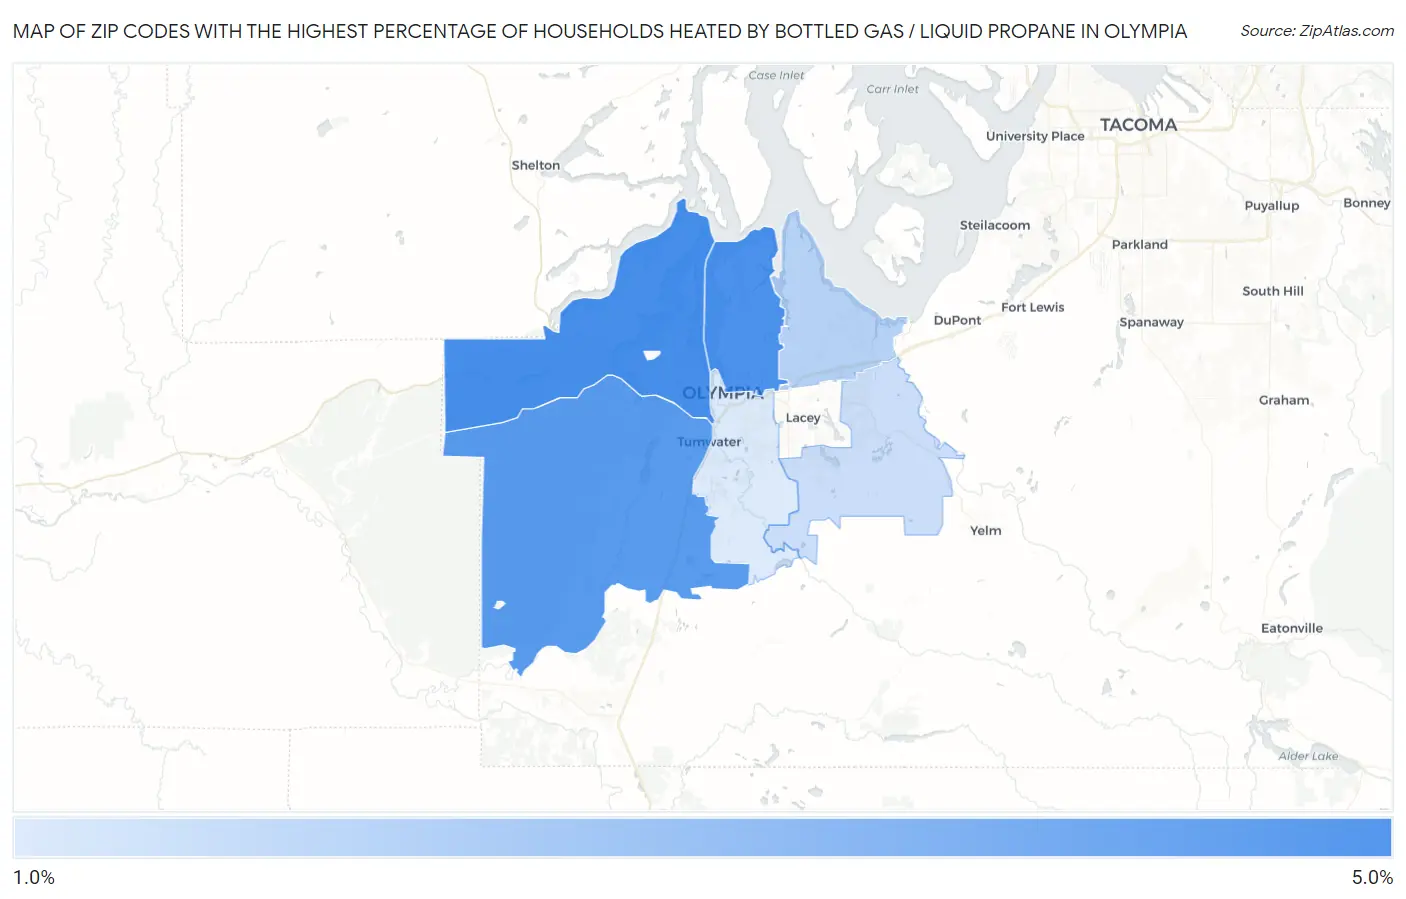
Map of Zip Codes with the Highest Percentage of Households Heated by Bottled Gas / Liquid Propane in Olympia

0.0%
5.0%
Zip Codes with the Highest Percentage of Households Heated by Bottled Gas / Liquid Propane in Olympia Map

Zip Codes with the Highest Percentage of Households Heated by Bottled Gas / Liquid Propane in Olympia, WA

Zip Code Bottled Gas / LP Heating vs State vs National
1.985025.0%3.1%(+1.90)#1864.9%(+0.100)#18,508
2.985064.9%3.1%(+1.80)#1894.9%(=0.000)#18,636
3.985124.6%3.1%(+1.50)#1994.9%(-0.300)#18,956
4.985162.4%3.1%(-0.700)#2784.9%(-2.50)#22,169
5.985131.9%3.1%(-1.20)#3114.9%(-3.00)#23,430
6.985011.5%3.1%(-1.60)#3454.9%(-3.40)#24,637

Common Questions

What are the Top 5 Zip Codes with the Highest Percentage of Households Heated by Bottled Gas / Liquid Propane in Olympia, WA?
Top 5 Zip Codes with the Highest Percentage of Households Heated by Bottled Gas / Liquid Propane in Olympia, WA are:
#1
5.0%
#2
4.9%
#3
4.6%
#4
2.4%
#5
1.9%
What zip code has the Highest Percentage of Households Heated by Bottled Gas / Liquid Propane in Olympia, WA?
98502 has the Highest Percentage of Households Heated by Bottled Gas / Liquid Propane in Olympia, WA with 5.0%.
What is the Percentage of Households Heated by Bottled Gas / Liquid Propane in Olympia, WA?
Percentage of Households Heated by Bottled Gas / Liquid Propane in Olympia is 0.70%.
What is the Percentage of Households Heated by Bottled Gas / Liquid Propane in Washington?
Percentage of Households Heated by Bottled Gas / Liquid Propane in Washington is 3.1%.
What is the Percentage of Households Heated by Bottled Gas / Liquid Propane in the United States?
Percentage of Households Heated by Bottled Gas / Liquid Propane in the United States is 4.9%.