Zip Codes with the Highest Percentage of Population Employed in Agriculture, Fishing & Hunting in Mount Vernon, WA
RELATED REPORTS & OPTIONS
Agriculture, Fishing & Hunting
Mount Vernon
Compare Zip Codes
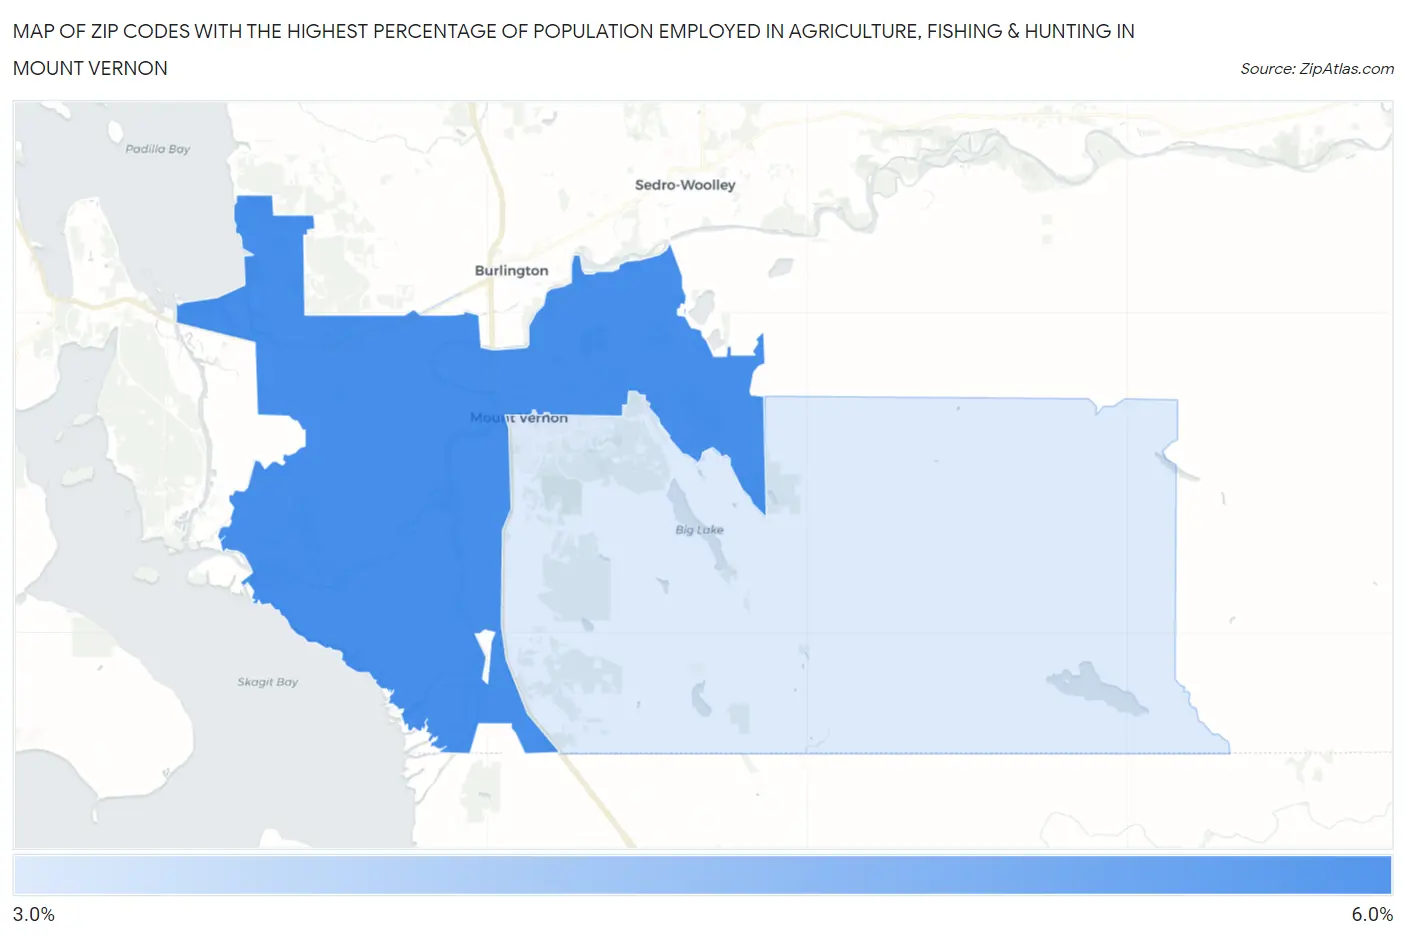
Map of Zip Codes with the Highest Percentage of Population Employed in Agriculture, Fishing & Hunting in Mount Vernon
0.0%
6.0%
Zip Codes with the Highest Percentage of Population Employed in Agriculture, Fishing & Hunting in Mount Vernon, WA
| Zip Code | % Employed | vs State | vs National | |
| 1. | 98273 | 5.9% | 2.4%(+3.50)#194 | 1.2%(+4.69)#7,012 |
| 2. | 98274 | 3.5% | 2.4%(+1.13)#238 | 1.2%(+2.32)#9,717 |
1
Common Questions
What are the Top Zip Codes with the Highest Percentage of Population Employed in Agriculture, Fishing & Hunting in Mount Vernon, WA?
Top Zip Codes with the Highest Percentage of Population Employed in Agriculture, Fishing & Hunting in Mount Vernon, WA are:
What zip code has the Highest Percentage of Population Employed in Agriculture, Fishing & Hunting in Mount Vernon, WA?
98273 has the Highest Percentage of Population Employed in Agriculture, Fishing & Hunting in Mount Vernon, WA with 5.9%.
What is the Percentage of Population Employed in Agriculture, Fishing & Hunting in Mount Vernon, WA?
Percentage of Population Employed in Agriculture, Fishing & Hunting in Mount Vernon is 4.6%.
What is the Percentage of Population Employed in Agriculture, Fishing & Hunting in Washington?
Percentage of Population Employed in Agriculture, Fishing & Hunting in Washington is 2.4%.
What is the Percentage of Population Employed in Agriculture, Fishing & Hunting in the United States?
Percentage of Population Employed in Agriculture, Fishing & Hunting in the United States is 1.2%.