Zip Codes with the Highest Percentage of Population Employed in Agriculture, Fishing & Hunting in Marysville, WA
RELATED REPORTS & OPTIONS
Agriculture, Fishing & Hunting
Marysville
Compare Zip Codes
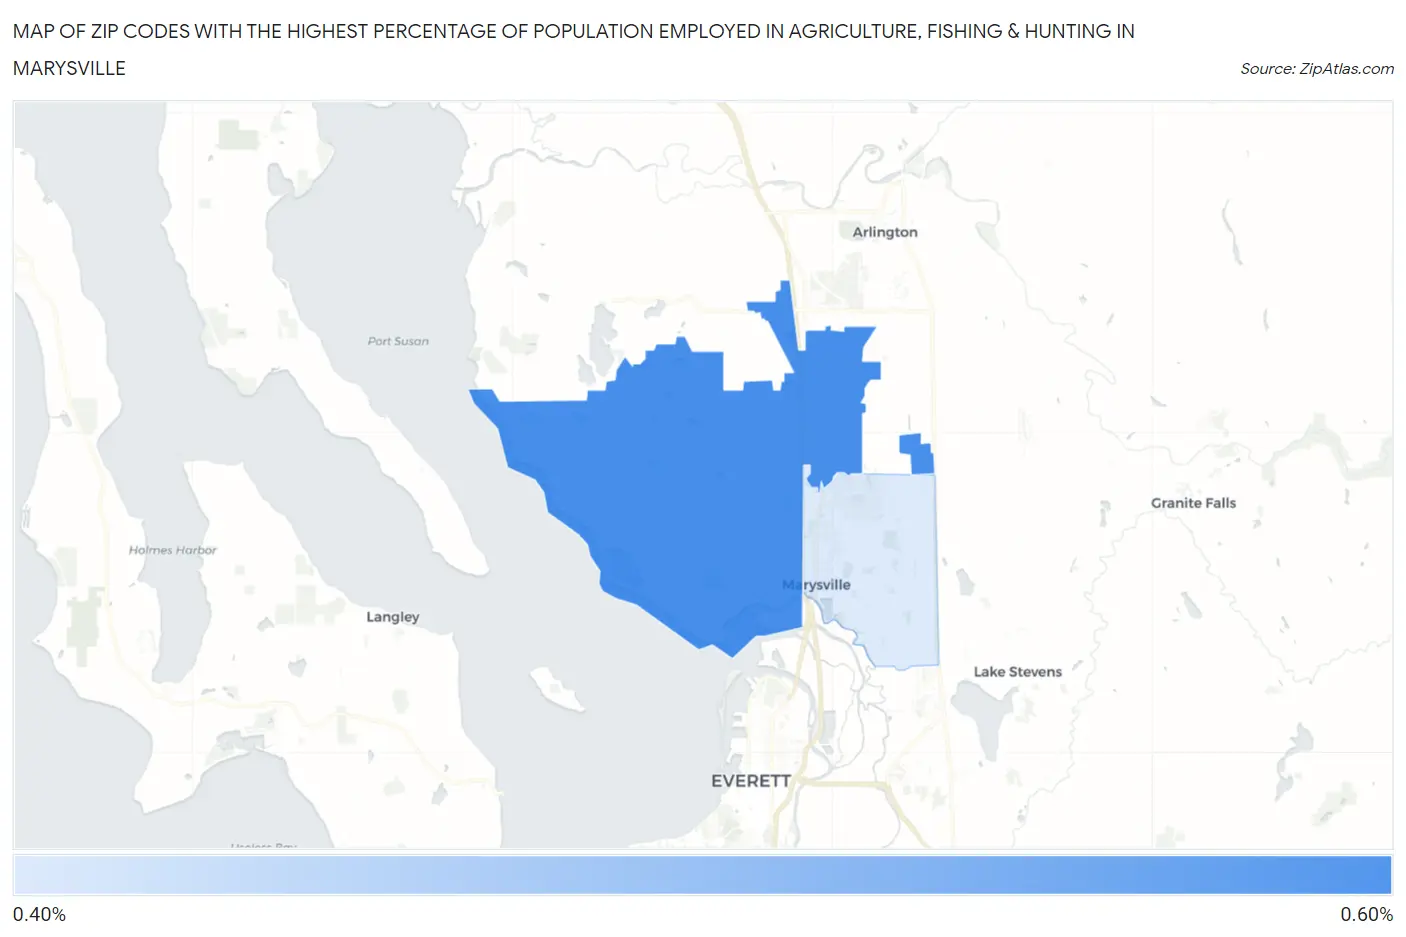
Map of Zip Codes with the Highest Percentage of Population Employed in Agriculture, Fishing & Hunting in Marysville
0.0%
0.60%
Zip Codes with the Highest Percentage of Population Employed in Agriculture, Fishing & Hunting in Marysville, WA
| Zip Code | % Employed | vs State | vs National | |
| 1. | 98271 | 0.56% | 2.4%(-1.83)#402 | 1.2%(-0.643)#18,797 |
| 2. | 98270 | 0.40% | 2.4%(-1.99)#428 | 1.2%(-0.796)#20,127 |
1
Common Questions
What are the Top Zip Codes with the Highest Percentage of Population Employed in Agriculture, Fishing & Hunting in Marysville, WA?
Top Zip Codes with the Highest Percentage of Population Employed in Agriculture, Fishing & Hunting in Marysville, WA are:
What zip code has the Highest Percentage of Population Employed in Agriculture, Fishing & Hunting in Marysville, WA?
98271 has the Highest Percentage of Population Employed in Agriculture, Fishing & Hunting in Marysville, WA with 0.56%.
What is the Percentage of Population Employed in Agriculture, Fishing & Hunting in Marysville, WA?
Percentage of Population Employed in Agriculture, Fishing & Hunting in Marysville is 0.41%.
What is the Percentage of Population Employed in Agriculture, Fishing & Hunting in Washington?
Percentage of Population Employed in Agriculture, Fishing & Hunting in Washington is 2.4%.
What is the Percentage of Population Employed in Agriculture, Fishing & Hunting in the United States?
Percentage of Population Employed in Agriculture, Fishing & Hunting in the United States is 1.2%.