Zip Codes with the Highest Percentage of Households Heated by Bottled Gas / Liquid Propane in Marysville, WA
RELATED REPORTS & OPTIONS
Bottled Gas / LP Heating
Marysville
Compare Zip Codes
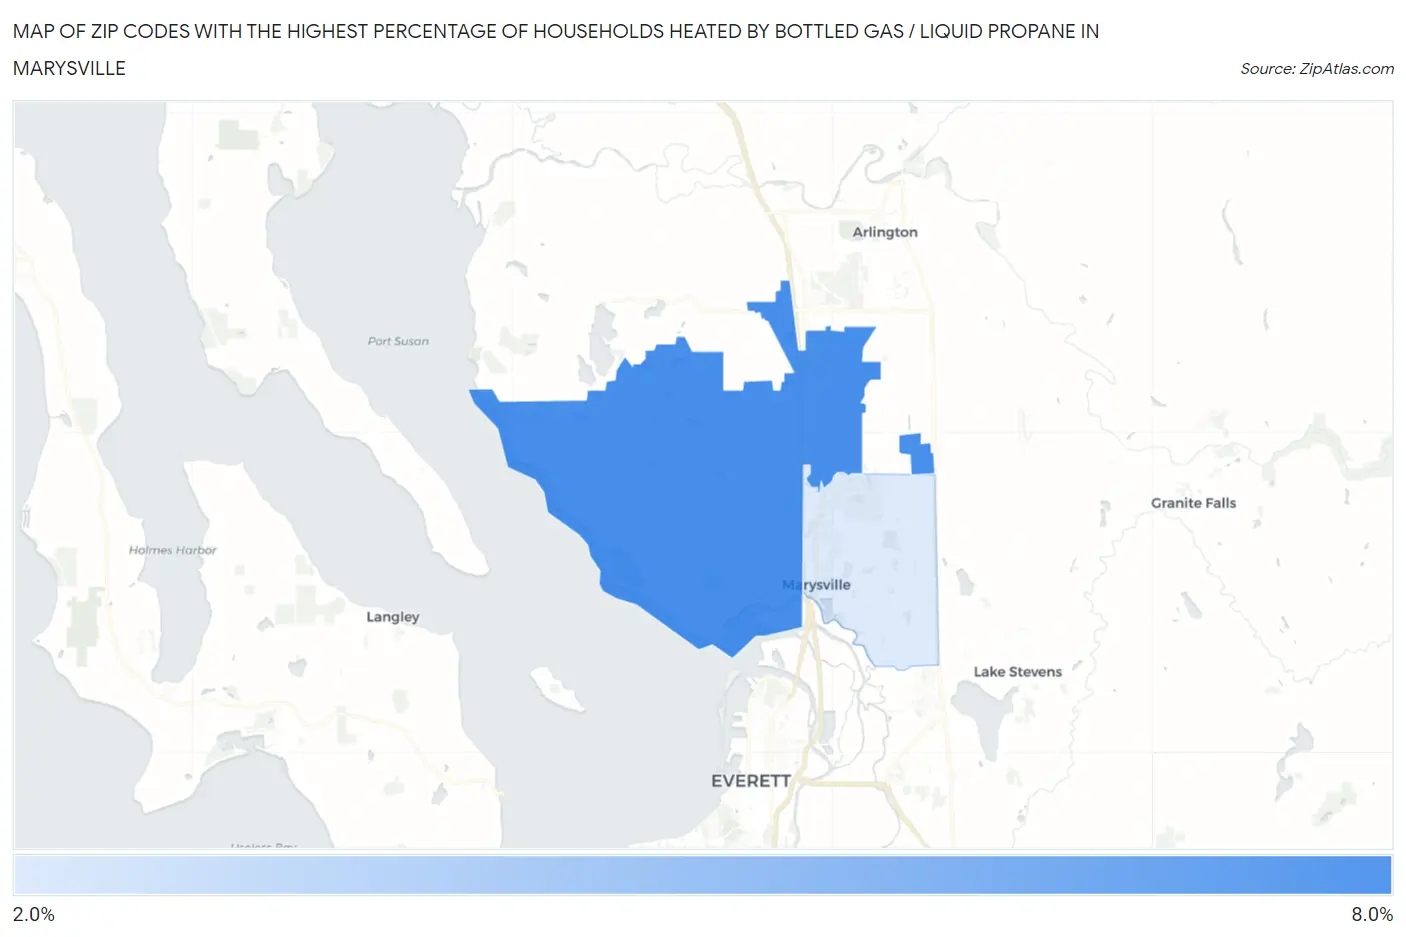
Map of Zip Codes with the Highest Percentage of Households Heated by Bottled Gas / Liquid Propane in Marysville
0.0%
8.0%
Zip Codes with the Highest Percentage of Households Heated by Bottled Gas / Liquid Propane in Marysville, WA
| Zip Code | Bottled Gas / LP Heating | vs State | vs National | |
| 1. | 98271 | 6.5% | 3.1%(+3.40)#153 | 4.9%(+1.60)#17,158 |
| 2. | 98270 | 2.0% | 3.1%(-1.10)#301 | 4.9%(-2.90)#23,107 |
1
Common Questions
What are the Top Zip Codes with the Highest Percentage of Households Heated by Bottled Gas / Liquid Propane in Marysville, WA?
Top Zip Codes with the Highest Percentage of Households Heated by Bottled Gas / Liquid Propane in Marysville, WA are:
What zip code has the Highest Percentage of Households Heated by Bottled Gas / Liquid Propane in Marysville, WA?
98271 has the Highest Percentage of Households Heated by Bottled Gas / Liquid Propane in Marysville, WA with 6.5%.
What is the Percentage of Households Heated by Bottled Gas / Liquid Propane in Marysville, WA?
Percentage of Households Heated by Bottled Gas / Liquid Propane in Marysville is 2.0%.
What is the Percentage of Households Heated by Bottled Gas / Liquid Propane in Washington?
Percentage of Households Heated by Bottled Gas / Liquid Propane in Washington is 3.1%.
What is the Percentage of Households Heated by Bottled Gas / Liquid Propane in the United States?
Percentage of Households Heated by Bottled Gas / Liquid Propane in the United States is 4.9%.