Zip Codes with the Highest Percentage of Population Employed in Health Care & Social Assistance in Lynnwood, WA
RELATED REPORTS & OPTIONS
Health Care & Social Assistance
Lynnwood
Compare Zip Codes
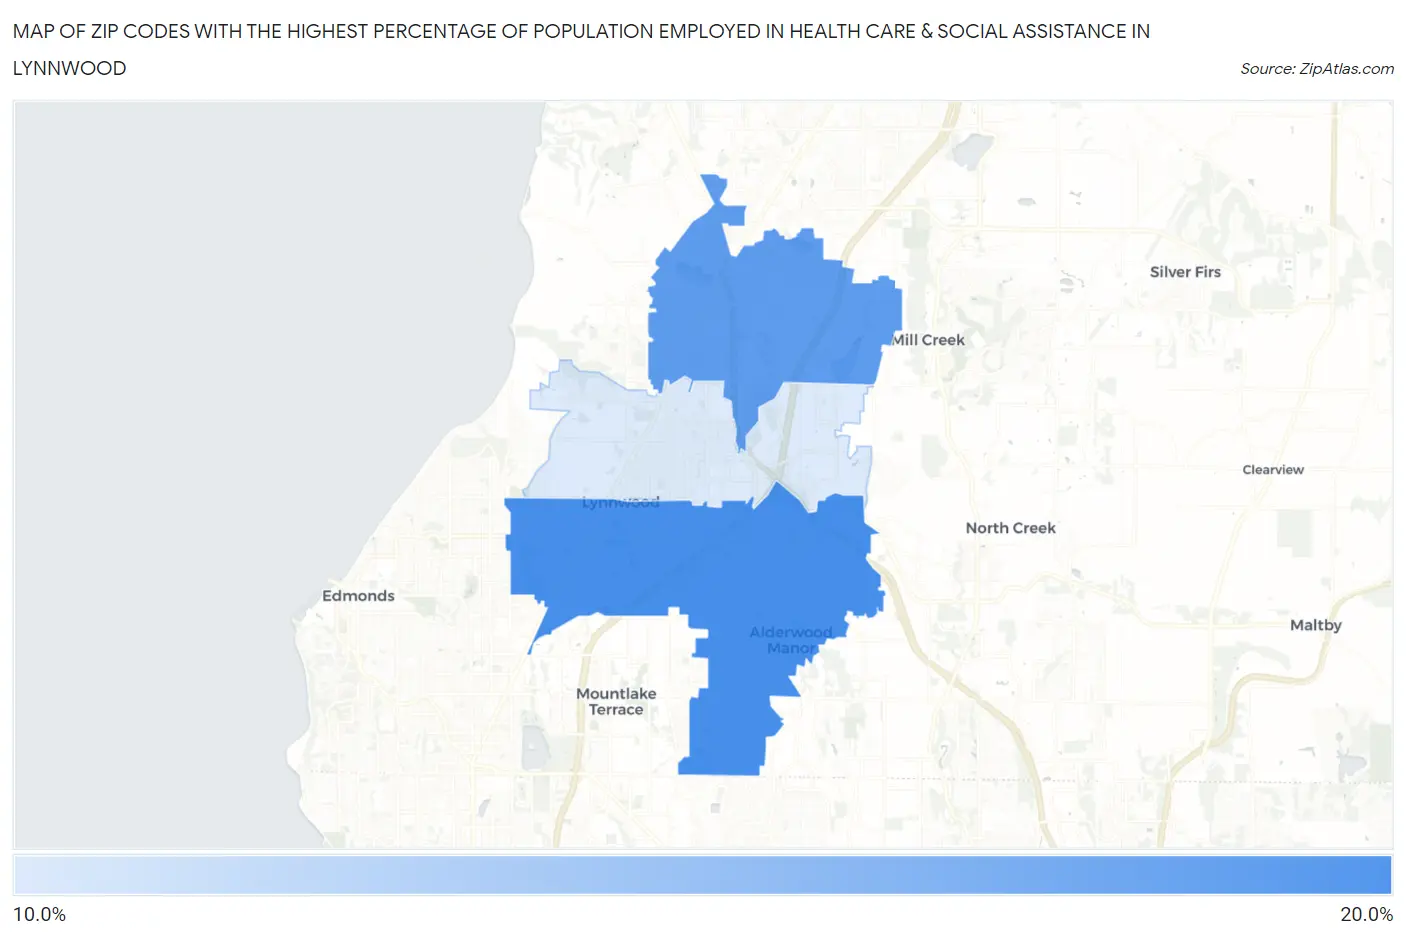
Map of Zip Codes with the Highest Percentage of Population Employed in Health Care & Social Assistance in Lynnwood
0.0%
20.0%
Zip Codes with the Highest Percentage of Population Employed in Health Care & Social Assistance in Lynnwood, WA
| Zip Code | % Employed | vs State | vs National | |
| 1. | 98036 | 17.5% | 13.0%(+4.49)#71 | 13.9%(+3.60)#6,883 |
| 2. | 98087 | 16.8% | 13.0%(+3.75)#87 | 13.9%(+2.85)#8,065 |
| 3. | 98037 | 12.8% | 13.0%(-0.233)#259 | 13.9%(-1.13)#17,077 |
1
Common Questions
What are the Top Zip Codes with the Highest Percentage of Population Employed in Health Care & Social Assistance in Lynnwood, WA?
Top Zip Codes with the Highest Percentage of Population Employed in Health Care & Social Assistance in Lynnwood, WA are:
What zip code has the Highest Percentage of Population Employed in Health Care & Social Assistance in Lynnwood, WA?
98036 has the Highest Percentage of Population Employed in Health Care & Social Assistance in Lynnwood, WA with 17.5%.
What is the Percentage of Population Employed in Health Care & Social Assistance in Lynnwood, WA?
Percentage of Population Employed in Health Care & Social Assistance in Lynnwood is 14.3%.
What is the Percentage of Population Employed in Health Care & Social Assistance in Washington?
Percentage of Population Employed in Health Care & Social Assistance in Washington is 13.0%.
What is the Percentage of Population Employed in Health Care & Social Assistance in the United States?
Percentage of Population Employed in Health Care & Social Assistance in the United States is 13.9%.