Zip Codes with the Highest Percentage of Population Employed in Agriculture, Fishing & Hunting in Lynnwood, WA
RELATED REPORTS & OPTIONS
Agriculture, Fishing & Hunting
Lynnwood
Compare Zip Codes
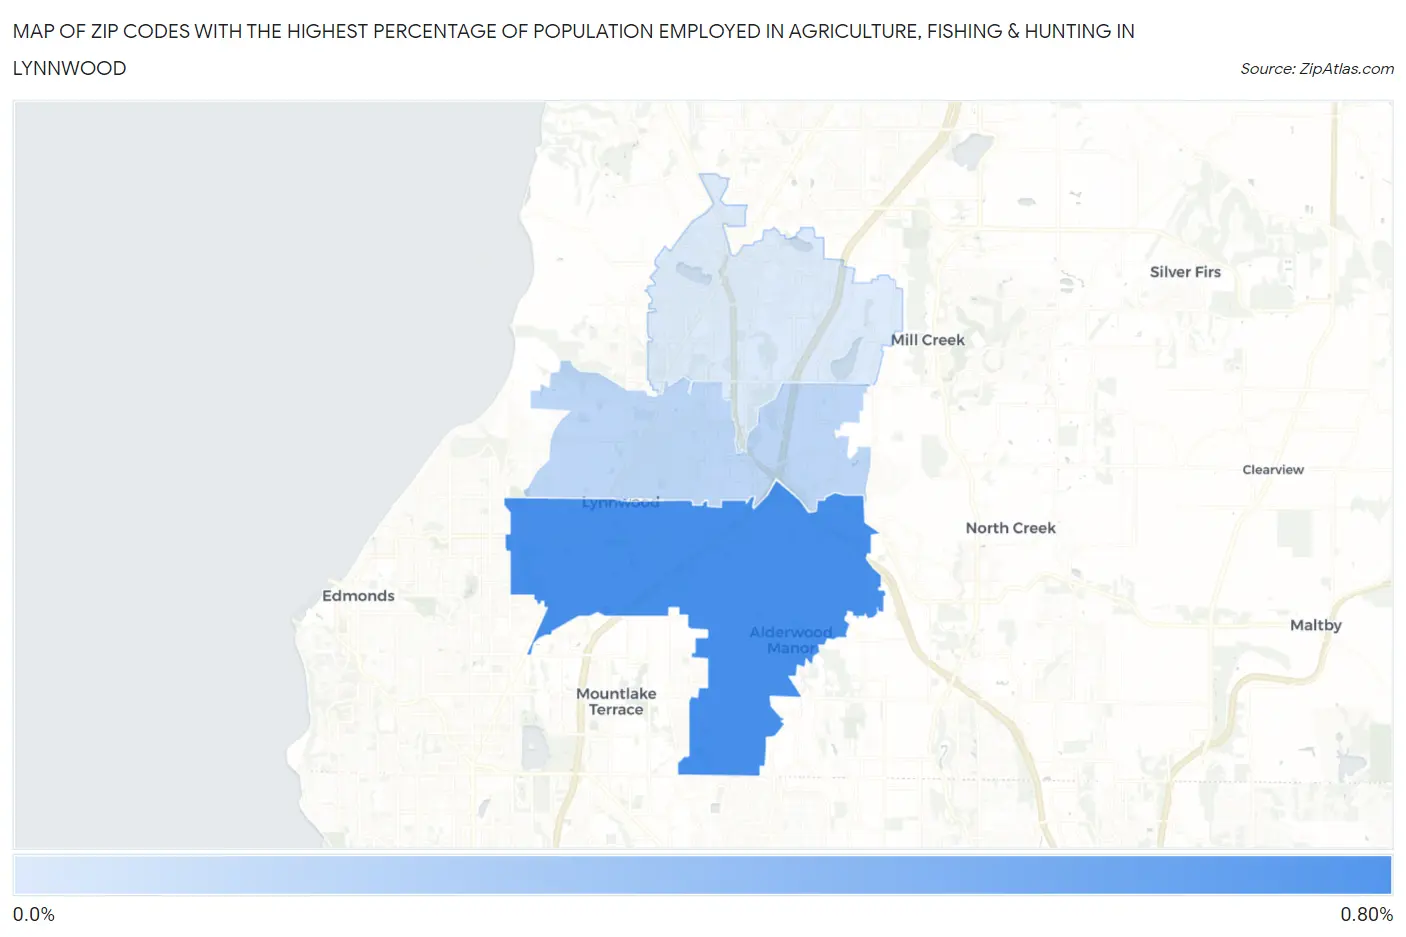
Map of Zip Codes with the Highest Percentage of Population Employed in Agriculture, Fishing & Hunting in Lynnwood
0.0%
0.80%
Zip Codes with the Highest Percentage of Population Employed in Agriculture, Fishing & Hunting in Lynnwood, WA
| Zip Code | % Employed | vs State | vs National | |
| 1. | 98036 | 0.79% | 2.4%(-1.60)#369 | 1.2%(-0.406)#17,274 |
| 2. | 98037 | 0.28% | 2.4%(-2.11)#454 | 1.2%(-0.918)#21,397 |
| 3. | 98087 | 0.15% | 2.4%(-2.25)#489 | 1.2%(-1.05)#23,078 |
1
Common Questions
What are the Top Zip Codes with the Highest Percentage of Population Employed in Agriculture, Fishing & Hunting in Lynnwood, WA?
Top Zip Codes with the Highest Percentage of Population Employed in Agriculture, Fishing & Hunting in Lynnwood, WA are:
What zip code has the Highest Percentage of Population Employed in Agriculture, Fishing & Hunting in Lynnwood, WA?
98036 has the Highest Percentage of Population Employed in Agriculture, Fishing & Hunting in Lynnwood, WA with 0.79%.
What is the Percentage of Population Employed in Agriculture, Fishing & Hunting in Lynnwood, WA?
Percentage of Population Employed in Agriculture, Fishing & Hunting in Lynnwood is 0.064%.
What is the Percentage of Population Employed in Agriculture, Fishing & Hunting in Washington?
Percentage of Population Employed in Agriculture, Fishing & Hunting in Washington is 2.4%.
What is the Percentage of Population Employed in Agriculture, Fishing & Hunting in the United States?
Percentage of Population Employed in Agriculture, Fishing & Hunting in the United States is 1.2%.