Zip Codes with the Highest Percentage of Population Employed in Farming, Fishing & Forestry in Kirkland, WA
RELATED REPORTS & OPTIONS
Farming, Fishing & Forestry
Kirkland
Compare Zip Codes
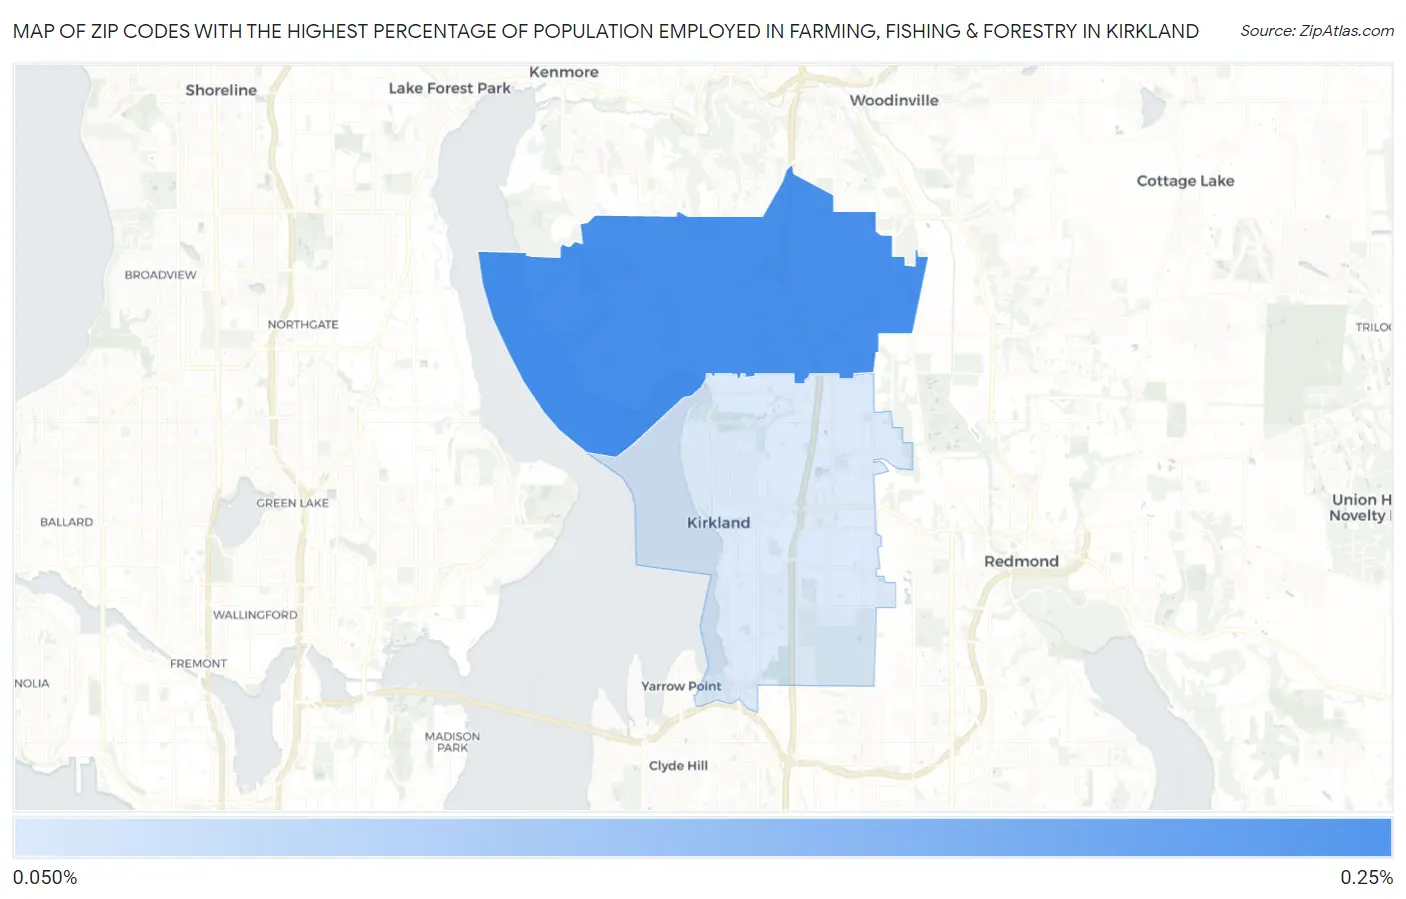
Map of Zip Codes with the Highest Percentage of Population Employed in Farming, Fishing & Forestry in Kirkland
0.0%
0.25%
Zip Codes with the Highest Percentage of Population Employed in Farming, Fishing & Forestry in Kirkland, WA
| Zip Code | % Employed | vs State | vs National | |
| 1. | 98034 | 0.22% | 1.5%(-1.29)#373 | 0.61%(-0.388)#15,875 |
| 2. | 98033 | 0.063% | 1.5%(-1.45)#418 | 0.61%(-0.543)#18,430 |
1
Common Questions
What are the Top Zip Codes with the Highest Percentage of Population Employed in Farming, Fishing & Forestry in Kirkland, WA?
Top Zip Codes with the Highest Percentage of Population Employed in Farming, Fishing & Forestry in Kirkland, WA are:
What zip code has the Highest Percentage of Population Employed in Farming, Fishing & Forestry in Kirkland, WA?
98034 has the Highest Percentage of Population Employed in Farming, Fishing & Forestry in Kirkland, WA with 0.22%.
What is the Percentage of Population Employed in Farming, Fishing & Forestry in Kirkland, WA?
Percentage of Population Employed in Farming, Fishing & Forestry in Kirkland is 0.15%.
What is the Percentage of Population Employed in Farming, Fishing & Forestry in Washington?
Percentage of Population Employed in Farming, Fishing & Forestry in Washington is 1.5%.
What is the Percentage of Population Employed in Farming, Fishing & Forestry in the United States?
Percentage of Population Employed in Farming, Fishing & Forestry in the United States is 0.61%.