Zip Codes with the Highest Percentage of Population Employed in Agriculture, Fishing & Hunting in Kennewick, WA
RELATED REPORTS & OPTIONS
Agriculture, Fishing & Hunting
Kennewick
Compare Zip Codes
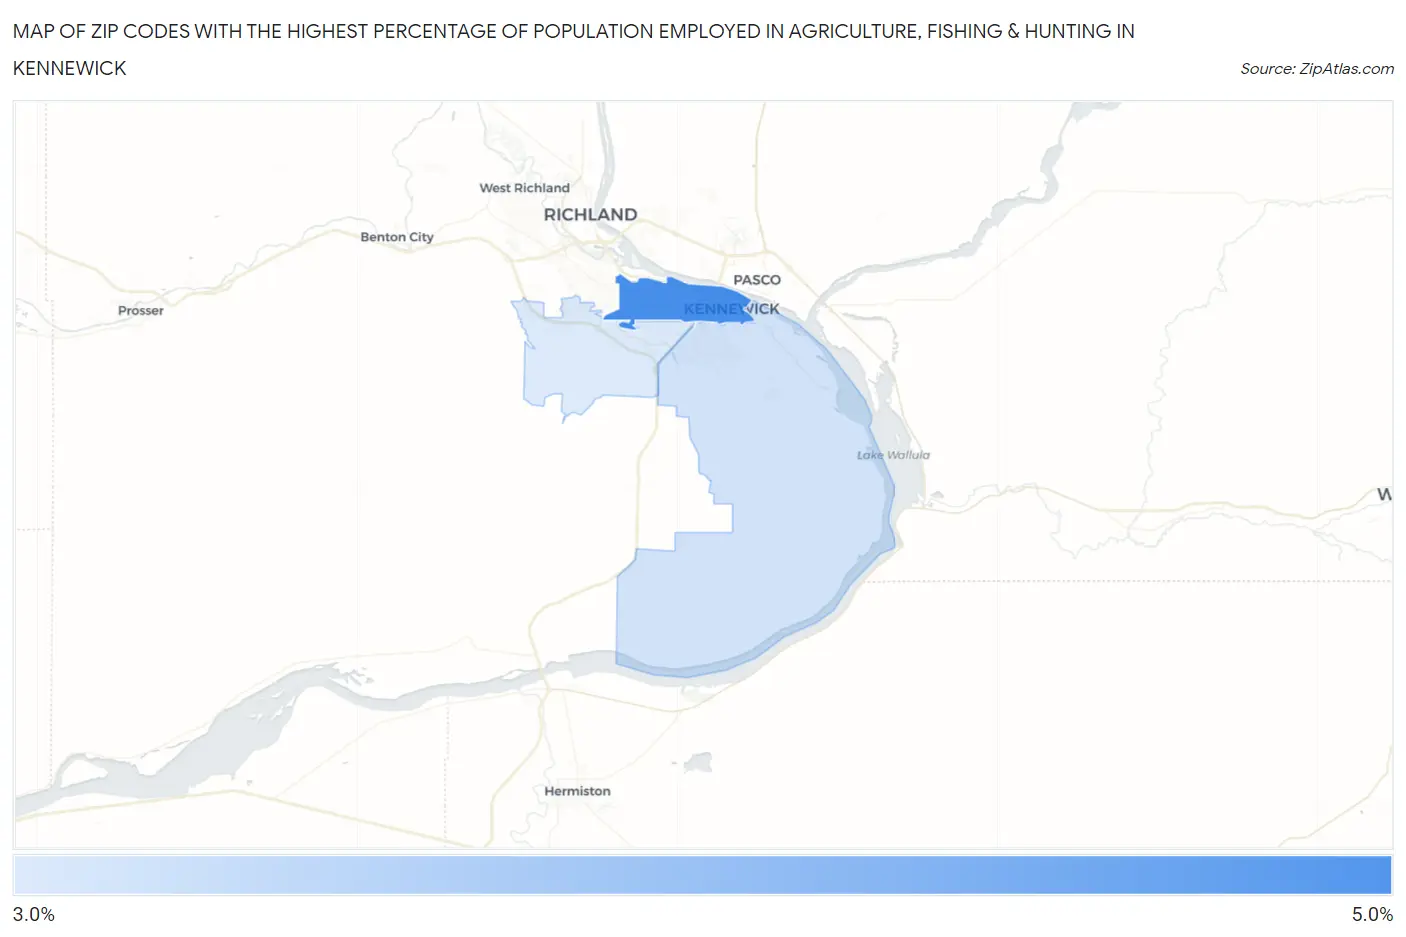
Map of Zip Codes with the Highest Percentage of Population Employed in Agriculture, Fishing & Hunting in Kennewick
0.0%
5.0%
Zip Codes with the Highest Percentage of Population Employed in Agriculture, Fishing & Hunting in Kennewick, WA
| Zip Code | % Employed | vs State | vs National | |
| 1. | 99336 | 4.8% | 2.4%(+2.44)#216 | 1.2%(+3.63)#8,040 |
| 2. | 99337 | 3.2% | 2.4%(+0.814)#248 | 1.2%(+2.01)#10,209 |
| 3. | 99338 | 3.1% | 2.4%(+0.682)#251 | 1.2%(+1.87)#10,436 |
1
Common Questions
What are the Top Zip Codes with the Highest Percentage of Population Employed in Agriculture, Fishing & Hunting in Kennewick, WA?
Top Zip Codes with the Highest Percentage of Population Employed in Agriculture, Fishing & Hunting in Kennewick, WA are:
What zip code has the Highest Percentage of Population Employed in Agriculture, Fishing & Hunting in Kennewick, WA?
99336 has the Highest Percentage of Population Employed in Agriculture, Fishing & Hunting in Kennewick, WA with 4.8%.
What is the Percentage of Population Employed in Agriculture, Fishing & Hunting in Kennewick, WA?
Percentage of Population Employed in Agriculture, Fishing & Hunting in Kennewick is 3.6%.
What is the Percentage of Population Employed in Agriculture, Fishing & Hunting in Washington?
Percentage of Population Employed in Agriculture, Fishing & Hunting in Washington is 2.4%.
What is the Percentage of Population Employed in Agriculture, Fishing & Hunting in the United States?
Percentage of Population Employed in Agriculture, Fishing & Hunting in the United States is 1.2%.