Zip Codes with the Highest Percentage of Population Employed in Arts, Entertainment & Recreation in Issaquah, WA
RELATED REPORTS & OPTIONS
Arts, Entertainment & Recreation
Issaquah
Compare Zip Codes
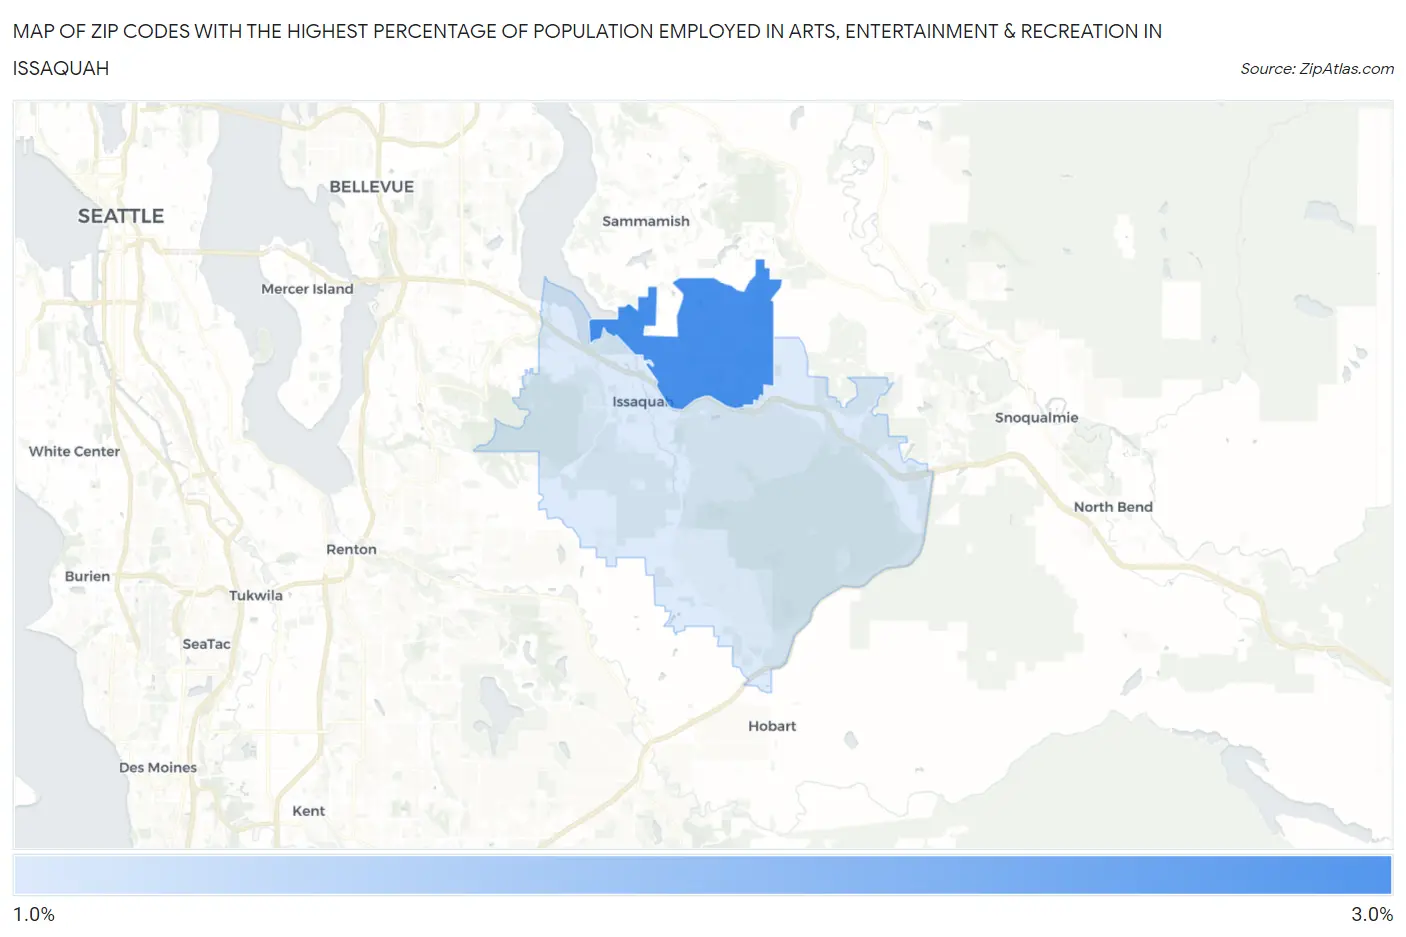
Map of Zip Codes with the Highest Percentage of Population Employed in Arts, Entertainment & Recreation in Issaquah
0.0%
3.0%
Zip Codes with the Highest Percentage of Population Employed in Arts, Entertainment & Recreation in Issaquah, WA
| Zip Code | % Employed | vs State | vs National | |
| 1. | 98029 | 2.5% | 2.1%(+0.360)#180 | 2.1%(+0.423)#7,148 |
| 2. | 98027 | 2.0% | 2.1%(-0.180)#246 | 2.1%(-0.116)#9,976 |
1
Common Questions
What are the Top Zip Codes with the Highest Percentage of Population Employed in Arts, Entertainment & Recreation in Issaquah, WA?
Top Zip Codes with the Highest Percentage of Population Employed in Arts, Entertainment & Recreation in Issaquah, WA are:
What zip code has the Highest Percentage of Population Employed in Arts, Entertainment & Recreation in Issaquah, WA?
98029 has the Highest Percentage of Population Employed in Arts, Entertainment & Recreation in Issaquah, WA with 2.5%.
What is the Percentage of Population Employed in Arts, Entertainment & Recreation in Issaquah, WA?
Percentage of Population Employed in Arts, Entertainment & Recreation in Issaquah is 2.5%.
What is the Percentage of Population Employed in Arts, Entertainment & Recreation in Washington?
Percentage of Population Employed in Arts, Entertainment & Recreation in Washington is 2.1%.
What is the Percentage of Population Employed in Arts, Entertainment & Recreation in the United States?
Percentage of Population Employed in Arts, Entertainment & Recreation in the United States is 2.1%.