Zip Codes with the Highest Percentage of Population Employed in Transportation & Warehousing in Vermont
RELATED REPORTS & OPTIONS
Transportation & Warehousing
Vermont
Compare Zip Codes
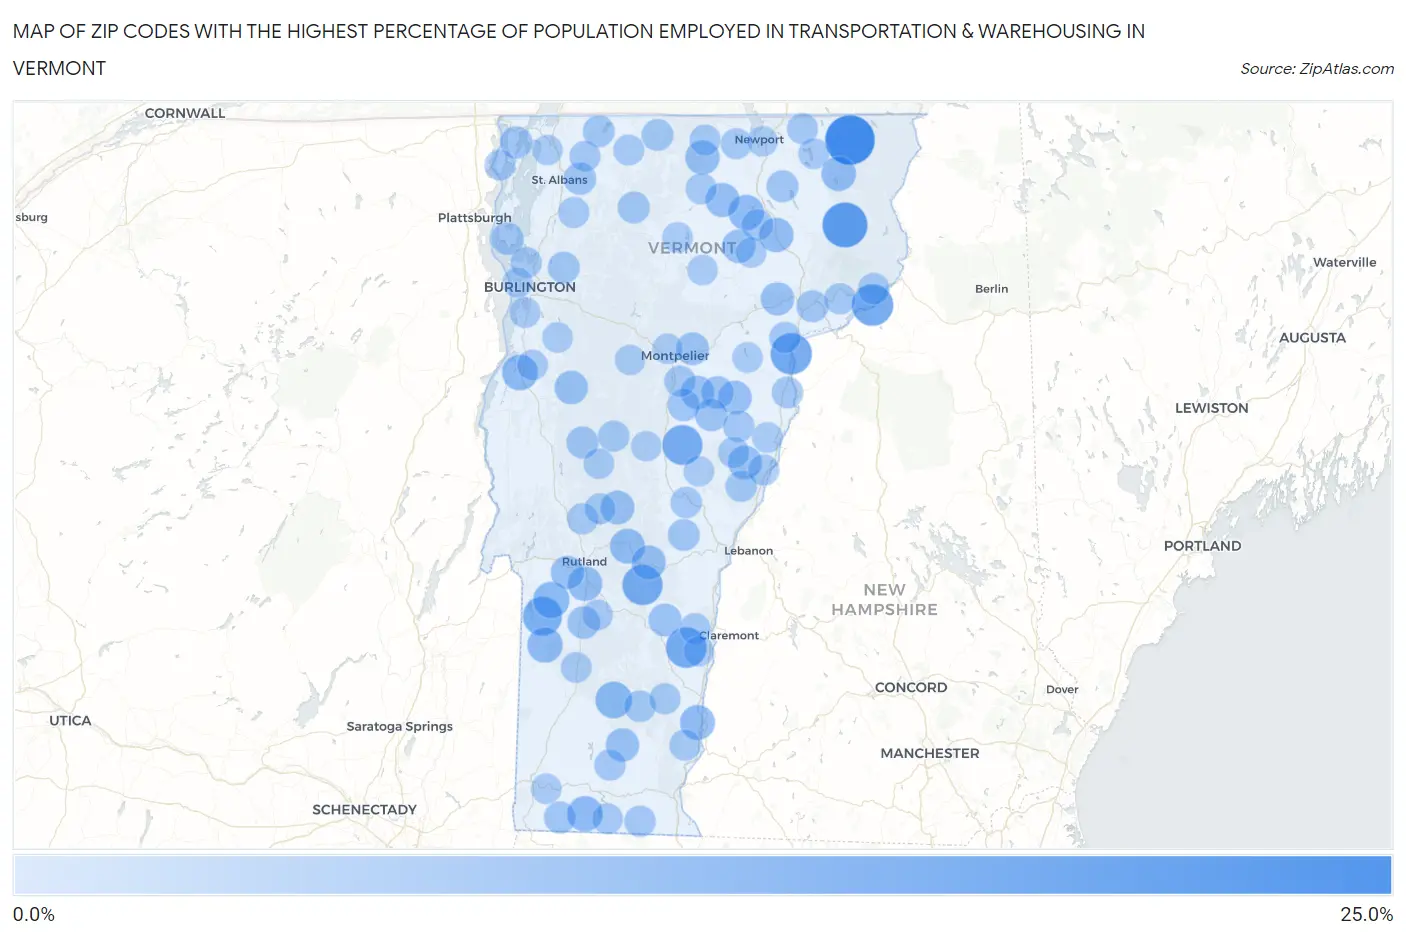
Map of Zip Codes with the Highest Percentage of Population Employed in Transportation & Warehousing in Vermont
0.0%
25.0%
Zip Codes with the Highest Percentage of Population Employed in Transportation & Warehousing in Vermont
| Zip Code | % Employed | vs State | vs National | |
| 1. | 05907 | 23.7% | 2.4%(+21.3)#1 | 4.9%(+18.7)#374 |
| 2. | 05837 | 18.5% | 2.4%(+16.2)#2 | 4.9%(+13.6)#637 |
| 3. | 05904 | 14.7% | 2.4%(+12.4)#3 | 4.9%(+9.79)#1,116 |
| 4. | 05050 | 14.5% | 2.4%(+12.1)#4 | 4.9%(+9.51)#1,175 |
| 5. | 05150 | 13.7% | 2.4%(+11.3)#5 | 4.9%(+8.75)#1,346 |
| 6. | 05056 | 13.3% | 2.4%(+11.0)#6 | 4.9%(+8.39)#1,442 |
| 7. | 05041 | 13.0% | 2.4%(+10.6)#7 | 4.9%(+8.04)#1,536 |
| 8. | 05774 | 12.0% | 2.4%(+9.68)#8 | 4.9%(+7.10)#1,837 |
| 9. | 05155 | 9.4% | 2.4%(+6.98)#9 | 4.9%(+4.41)#3,356 |
| 10. | 05757 | 9.1% | 2.4%(+6.70)#10 | 4.9%(+4.12)#3,630 |
| 11. | 05456 | 8.4% | 2.4%(+6.01)#11 | 4.9%(+3.43)#4,412 |
| 12. | 05350 | 8.1% | 2.4%(+5.74)#12 | 4.9%(+3.16)#4,747 |
| 13. | 05761 | 8.1% | 2.4%(+5.73)#13 | 4.9%(+3.15)#4,767 |
| 14. | 05875 | 8.0% | 2.4%(+5.61)#14 | 4.9%(+3.03)#4,925 |
| 15. | 05158 | 7.5% | 2.4%(+5.14)#15 | 4.9%(+2.56)#5,625 |
| 16. | 05751 | 7.5% | 2.4%(+5.14)#16 | 4.9%(+2.56)#5,632 |
| 17. | 05846 | 7.2% | 2.4%(+4.87)#17 | 4.9%(+2.29)#6,118 |
| 18. | 05759 | 7.1% | 2.4%(+4.72)#18 | 4.9%(+2.14)#6,372 |
| 19. | 05866 | 7.0% | 2.4%(+4.65)#19 | 4.9%(+2.07)#6,526 |
| 20. | 05874 | 6.9% | 2.4%(+4.49)#20 | 4.9%(+1.91)#6,848 |
| 21. | 05035 | 6.7% | 2.4%(+4.35)#21 | 4.9%(+1.77)#7,119 |
| 22. | 05820 | 6.6% | 2.4%(+4.26)#22 | 4.9%(+1.69)#7,306 |
| 23. | 05083 | 6.5% | 2.4%(+4.08)#23 | 4.9%(+1.51)#7,674 |
| 24. | 05762 | 6.4% | 2.4%(+3.99)#24 | 4.9%(+1.41)#7,913 |
| 25. | 05086 | 6.1% | 2.4%(+3.78)#25 | 4.9%(+1.20)#8,422 |
| 26. | 05841 | 6.0% | 2.4%(+3.62)#26 | 4.9%(+1.04)#8,807 |
| 27. | 05443 | 6.0% | 2.4%(+3.61)#27 | 4.9%(+1.03)#8,836 |
| 28. | 05654 | 5.9% | 2.4%(+3.58)#28 | 4.9%(+1.00)#8,911 |
| 29. | 05828 | 5.9% | 2.4%(+3.53)#29 | 4.9%(+0.948)#9,044 |
| 30. | 05355 | 5.9% | 2.4%(+3.50)#30 | 4.9%(+0.921)#9,140 |
| 31. | 05777 | 5.8% | 2.4%(+3.40)#31 | 4.9%(+0.827)#9,425 |
| 32. | 05153 | 5.4% | 2.4%(+3.08)#32 | 4.9%(+0.499)#10,410 |
| 33. | 05651 | 5.4% | 2.4%(+3.02)#33 | 4.9%(+0.443)#10,611 |
| 34. | 05773 | 5.2% | 2.4%(+2.79)#34 | 4.9%(+0.216)#11,389 |
| 35. | 05649 | 5.1% | 2.4%(+2.72)#35 | 4.9%(+0.146)#11,640 |
| 36. | 05675 | 5.1% | 2.4%(+2.72)#36 | 4.9%(+0.138)#11,667 |
| 37. | 05455 | 4.9% | 2.4%(+2.51)#37 | 4.9%(-0.065)#12,340 |
| 38. | 05440 | 4.8% | 2.4%(+2.44)#38 | 4.9%(-0.137)#12,600 |
| 39. | 05486 | 4.8% | 2.4%(+2.42)#39 | 4.9%(-0.155)#12,679 |
| 40. | 05679 | 4.7% | 2.4%(+2.30)#40 | 4.9%(-0.280)#13,151 |
| 41. | 05766 | 4.5% | 2.4%(+2.18)#41 | 4.9%(-0.401)#13,632 |
| 42. | 05352 | 4.4% | 2.4%(+2.06)#42 | 4.9%(-0.522)#14,055 |
| 43. | 05819 | 4.4% | 2.4%(+2.00)#43 | 4.9%(-0.574)#14,282 |
| 44. | 05476 | 4.3% | 2.4%(+1.93)#44 | 4.9%(-0.648)#14,608 |
| 45. | 05067 | 4.3% | 2.4%(+1.92)#45 | 4.9%(-0.661)#14,662 |
| 46. | 05860 | 4.2% | 2.4%(+1.88)#46 | 4.9%(-0.701)#14,824 |
| 47. | 05492 | 4.2% | 2.4%(+1.88)#47 | 4.9%(-0.701)#14,826 |
| 48. | 05452 | 4.2% | 2.4%(+1.80)#48 | 4.9%(-0.774)#15,139 |
| 49. | 05457 | 4.1% | 2.4%(+1.72)#49 | 4.9%(-0.862)#15,544 |
| 50. | 05839 | 4.0% | 2.4%(+1.65)#50 | 4.9%(-0.933)#15,849 |
| 51. | 05359 | 4.0% | 2.4%(+1.59)#51 | 4.9%(-0.986)#16,090 |
| 52. | 05906 | 4.0% | 2.4%(+1.58)#52 | 4.9%(-0.996)#16,129 |
| 53. | 05081 | 3.8% | 2.4%(+1.46)#53 | 4.9%(-1.12)#16,668 |
| 54. | 05358 | 3.8% | 2.4%(+1.45)#54 | 4.9%(-1.12)#16,704 |
| 55. | 05039 | 3.8% | 2.4%(+1.45)#55 | 4.9%(-1.13)#16,713 |
| 56. | 05641 | 3.8% | 2.4%(+1.41)#56 | 4.9%(-1.17)#16,890 |
| 57. | 05075 | 3.7% | 2.4%(+1.38)#57 | 4.9%(-1.20)#17,031 |
| 58. | 05824 | 3.7% | 2.4%(+1.34)#58 | 4.9%(-1.24)#17,213 |
| 59. | 05068 | 3.7% | 2.4%(+1.30)#59 | 4.9%(-1.28)#17,347 |
| 60. | 05821 | 3.7% | 2.4%(+1.29)#60 | 4.9%(-1.28)#17,377 |
| 61. | 05356 | 3.6% | 2.4%(+1.27)#61 | 4.9%(-1.31)#17,499 |
| 62. | 05747 | 3.6% | 2.4%(+1.27)#62 | 4.9%(-1.31)#17,502 |
| 63. | 05446 | 3.6% | 2.4%(+1.25)#63 | 4.9%(-1.33)#17,571 |
| 64. | 05346 | 3.6% | 2.4%(+1.25)#64 | 4.9%(-1.33)#17,586 |
| 65. | 05045 | 3.6% | 2.4%(+1.20)#65 | 4.9%(-1.37)#17,769 |
| 66. | 05079 | 3.6% | 2.4%(+1.19)#66 | 4.9%(-1.39)#17,836 |
| 67. | 05763 | 3.5% | 2.4%(+1.17)#67 | 4.9%(-1.41)#17,902 |
| 68. | 05146 | 3.4% | 2.4%(+1.07)#68 | 4.9%(-1.51)#18,338 |
| 69. | 05454 | 3.4% | 2.4%(+1.06)#69 | 4.9%(-1.51)#18,361 |
| 70. | 05847 | 3.4% | 2.4%(+1.06)#70 | 4.9%(-1.51)#18,363 |
| 71. | 05483 | 3.4% | 2.4%(+0.998)#71 | 4.9%(-1.58)#18,637 |
| 72. | 05857 | 3.3% | 2.4%(+0.981)#72 | 4.9%(-1.60)#18,720 |
| 73. | 05151 | 3.3% | 2.4%(+0.906)#73 | 4.9%(-1.67)#19,021 |
| 74. | 05737 | 3.3% | 2.4%(+0.889)#74 | 4.9%(-1.69)#19,097 |
| 75. | 05859 | 3.3% | 2.4%(+0.888)#75 | 4.9%(-1.69)#19,102 |
| 76. | 05830 | 3.3% | 2.4%(+0.885)#76 | 4.9%(-1.69)#19,118 |
| 77. | 05463 | 3.2% | 2.4%(+0.835)#77 | 4.9%(-1.74)#19,362 |
| 78. | 05253 | 3.2% | 2.4%(+0.784)#78 | 4.9%(-1.79)#19,568 |
| 79. | 05742 | 3.1% | 2.4%(+0.777)#79 | 4.9%(-1.80)#19,593 |
| 80. | 05033 | 3.1% | 2.4%(+0.766)#80 | 4.9%(-1.81)#19,637 |
| 81. | 05853 | 3.1% | 2.4%(+0.764)#81 | 4.9%(-1.81)#19,646 |
| 82. | 05482 | 3.1% | 2.4%(+0.746)#82 | 4.9%(-1.83)#19,733 |
| 83. | 05450 | 3.1% | 2.4%(+0.720)#83 | 4.9%(-1.86)#19,861 |
| 84. | 05473 | 3.1% | 2.4%(+0.694)#84 | 4.9%(-1.88)#19,997 |
| 85. | 05655 | 3.1% | 2.4%(+0.688)#85 | 4.9%(-1.89)#20,020 |
| 86. | 05361 | 3.1% | 2.4%(+0.685)#86 | 4.9%(-1.89)#20,032 |
| 87. | 05046 | 3.0% | 2.4%(+0.628)#87 | 4.9%(-1.95)#20,250 |
| 88. | 05748 | 2.9% | 2.4%(+0.537)#88 | 4.9%(-2.04)#20,655 |
| 89. | 05461 | 2.8% | 2.4%(+0.458)#89 | 4.9%(-2.12)#21,027 |
| 90. | 05855 | 2.8% | 2.4%(+0.410)#90 | 4.9%(-2.17)#21,223 |
| 91. | 05842 | 2.8% | 2.4%(+0.400)#91 | 4.9%(-2.18)#21,273 |
| 92. | 05660 | 2.7% | 2.4%(+0.364)#92 | 4.9%(-2.21)#21,416 |
| 93. | 05201 | 2.7% | 2.4%(+0.353)#93 | 4.9%(-2.23)#21,467 |
| 94. | 05602 | 2.7% | 2.4%(+0.345)#94 | 4.9%(-2.23)#21,502 |
| 95. | 05077 | 2.7% | 2.4%(+0.323)#95 | 4.9%(-2.26)#21,573 |
| 96. | 05680 | 2.7% | 2.4%(+0.309)#96 | 4.9%(-2.27)#21,640 |
| 97. | 05488 | 2.7% | 2.4%(+0.303)#97 | 4.9%(-2.28)#21,669 |
| 98. | 05156 | 2.6% | 2.4%(+0.266)#98 | 4.9%(-2.31)#21,831 |
| 99. | 05060 | 2.6% | 2.4%(+0.210)#99 | 4.9%(-2.37)#22,076 |
| 100. | 05408 | 2.6% | 2.4%(+0.207)#100 | 4.9%(-2.37)#22,085 |
Common Questions
What are the Top 10 Zip Codes with the Highest Percentage of Population Employed in Transportation & Warehousing in Vermont?
Top 10 Zip Codes with the Highest Percentage of Population Employed in Transportation & Warehousing in Vermont are:
What zip code has the Highest Percentage of Population Employed in Transportation & Warehousing in Vermont?
05907 has the Highest Percentage of Population Employed in Transportation & Warehousing in Vermont with 23.7%.
What is the Percentage of Population Employed in Transportation & Warehousing in the State of Vermont?
Percentage of Population Employed in Transportation & Warehousing in Vermont is 2.4%.
What is the Percentage of Population Employed in Transportation & Warehousing in the United States?
Percentage of Population Employed in Transportation & Warehousing in the United States is 4.9%.