Zip Codes with the Highest Percentage of Population Employed in Transportation in Roanoke, VA
RELATED REPORTS & OPTIONS
Transportation
Roanoke
Compare Zip Codes
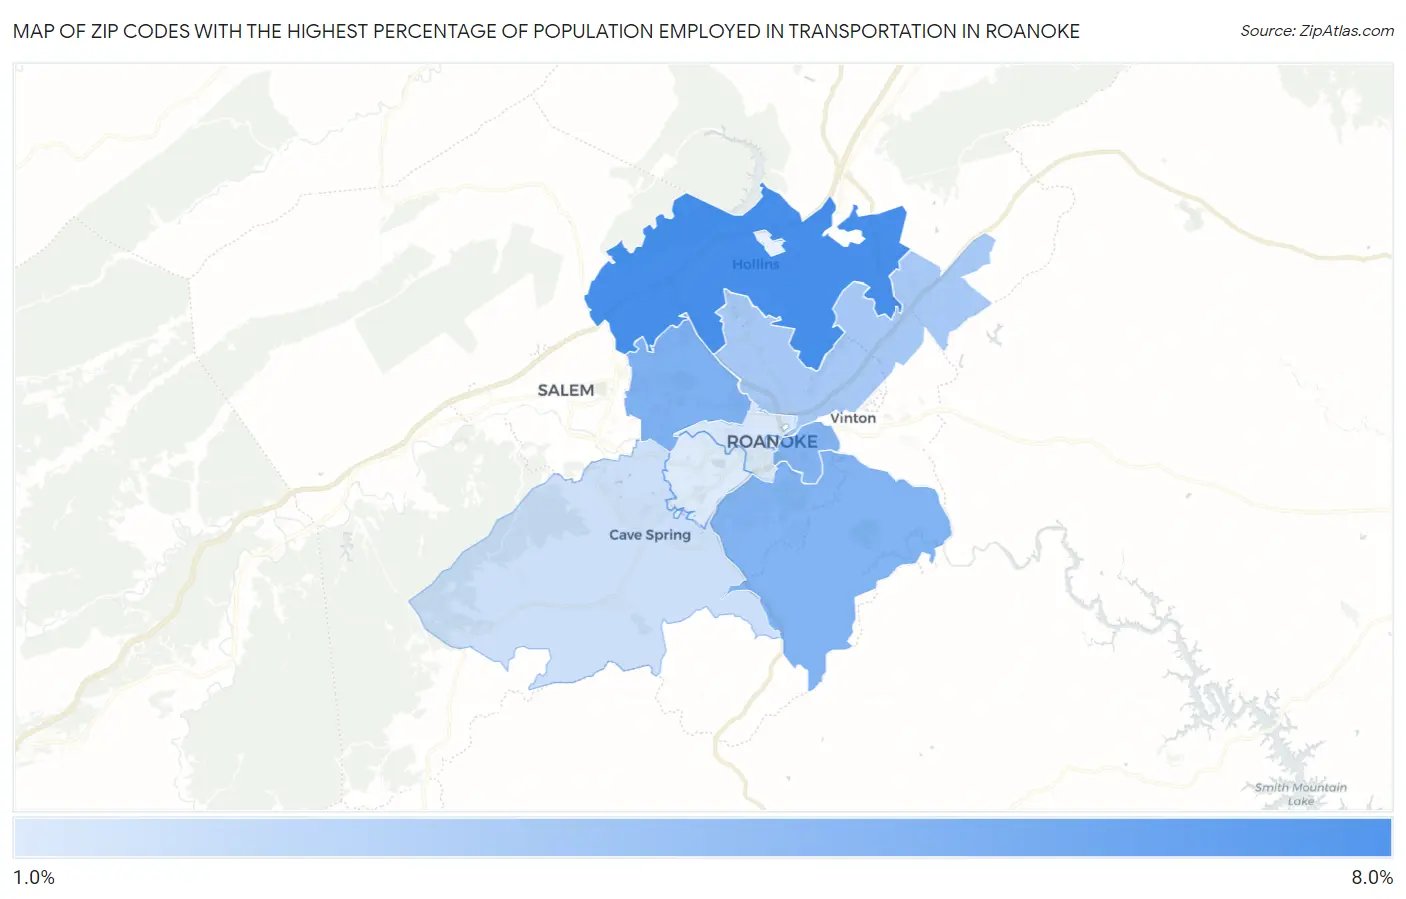
Map of Zip Codes with the Highest Percentage of Population Employed in Transportation in Roanoke
0.0%
8.0%
Zip Codes with the Highest Percentage of Population Employed in Transportation in Roanoke, VA
| Zip Code | % Employed | vs State | vs National | |
| 1. | 24019 | 7.3% | 3.4%(+3.89)#138 | 3.8%(+3.47)#4,825 |
| 2. | 24017 | 5.2% | 3.4%(+1.82)#217 | 3.8%(+1.40)#9,614 |
| 3. | 24014 | 5.1% | 3.4%(+1.73)#230 | 3.8%(+1.32)#9,908 |
| 4. | 24013 | 5.1% | 3.4%(+1.66)#232 | 3.8%(+1.25)#10,106 |
| 5. | 24012 | 3.8% | 3.4%(+0.350)#357 | 3.8%(-0.063)#15,560 |
| 6. | 24018 | 2.3% | 3.4%(-1.06)#523 | 3.8%(-1.48)#22,301 |
| 7. | 24016 | 1.9% | 3.4%(-1.49)#570 | 3.8%(-1.91)#23,998 |
| 8. | 24015 | 1.7% | 3.4%(-1.68)#586 | 3.8%(-2.10)#24,701 |
1
Common Questions
What are the Top 5 Zip Codes with the Highest Percentage of Population Employed in Transportation in Roanoke, VA?
Top 5 Zip Codes with the Highest Percentage of Population Employed in Transportation in Roanoke, VA are:
What zip code has the Highest Percentage of Population Employed in Transportation in Roanoke, VA?
24019 has the Highest Percentage of Population Employed in Transportation in Roanoke, VA with 7.3%.
What is the Percentage of Population Employed in Transportation in Roanoke, VA?
Percentage of Population Employed in Transportation in Roanoke is 3.7%.
What is the Percentage of Population Employed in Transportation in Virginia?
Percentage of Population Employed in Transportation in Virginia is 3.4%.
What is the Percentage of Population Employed in Transportation in the United States?
Percentage of Population Employed in Transportation in the United States is 3.8%.