Zip Codes with the Highest Percentage of Population Employed in Transportation in Lynchburg, VA
RELATED REPORTS & OPTIONS
Transportation
Lynchburg
Compare Zip Codes
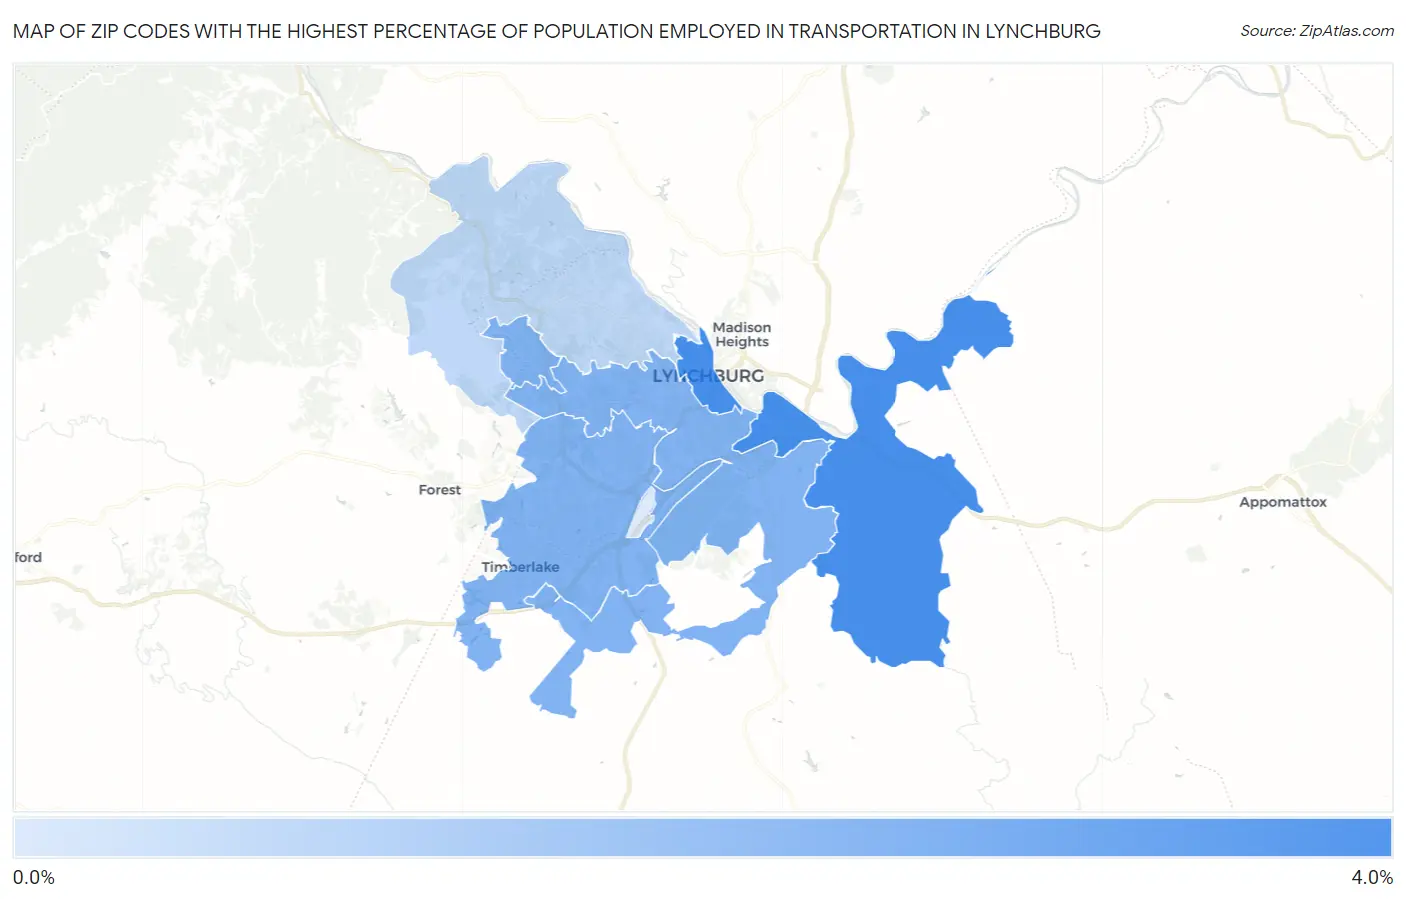
Map of Zip Codes with the Highest Percentage of Population Employed in Transportation in Lynchburg
0.0%
4.0%
Zip Codes with the Highest Percentage of Population Employed in Transportation in Lynchburg, VA
| Zip Code | % Employed | vs State | vs National | |
| 1. | 24504 | 3.3% | 3.4%(-0.080)#403 | 3.8%(-0.493)#17,695 |
| 2. | 24502 | 2.2% | 3.4%(-1.19)#538 | 3.8%(-1.60)#22,806 |
| 3. | 24501 | 2.2% | 3.4%(-1.21)#542 | 3.8%(-1.62)#22,910 |
| 4. | 24503 | 1.0% | 3.4%(-2.36)#651 | 3.8%(-2.78)#26,740 |
| 5. | 24515 | 0.46% | 3.4%(-2.95)#686 | 3.8%(-3.36)#27,868 |
1
Common Questions
What are the Top 3 Zip Codes with the Highest Percentage of Population Employed in Transportation in Lynchburg, VA?
Top 3 Zip Codes with the Highest Percentage of Population Employed in Transportation in Lynchburg, VA are:
What zip code has the Highest Percentage of Population Employed in Transportation in Lynchburg, VA?
24504 has the Highest Percentage of Population Employed in Transportation in Lynchburg, VA with 3.3%.
What is the Percentage of Population Employed in Transportation in Lynchburg, VA?
Percentage of Population Employed in Transportation in Lynchburg is 2.2%.
What is the Percentage of Population Employed in Transportation in Virginia?
Percentage of Population Employed in Transportation in Virginia is 3.4%.
What is the Percentage of Population Employed in Transportation in the United States?
Percentage of Population Employed in Transportation in the United States is 3.8%.