Zip Codes with the Highest Percentage of Population Employed in Agriculture, Fishing & Hunting in Lynchburg, VA
RELATED REPORTS & OPTIONS
Agriculture, Fishing & Hunting
Lynchburg
Compare Zip Codes
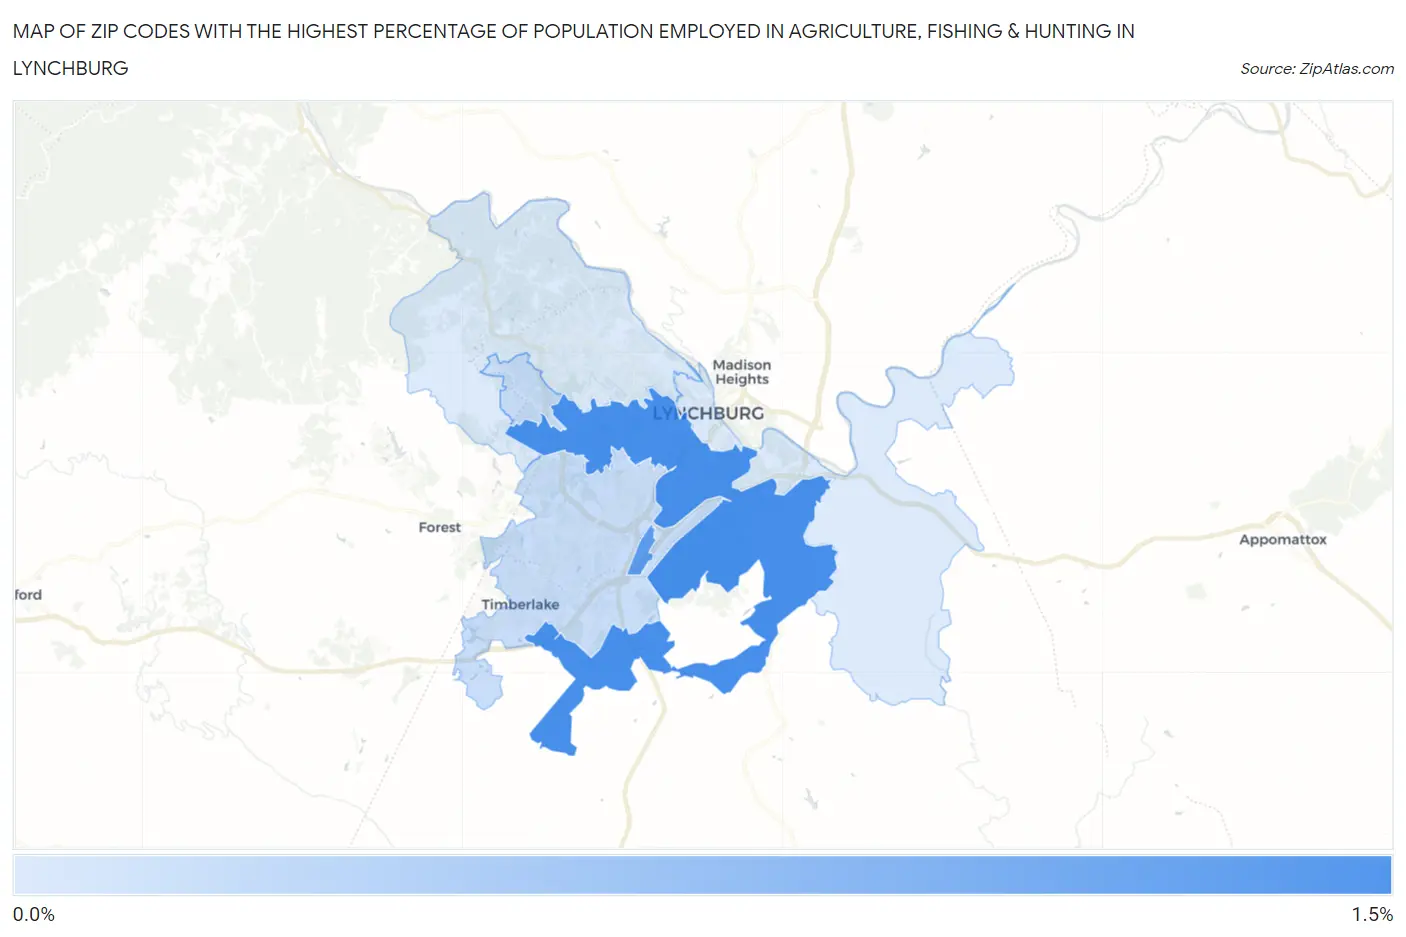
Map of Zip Codes with the Highest Percentage of Population Employed in Agriculture, Fishing & Hunting in Lynchburg
0.0%
1.5%
Zip Codes with the Highest Percentage of Population Employed in Agriculture, Fishing & Hunting in Lynchburg, VA
| Zip Code | % Employed | vs State | vs National | |
| 1. | 24501 | 1.2% | 0.69%(+0.494)#303 | 1.2%(-0.019)#15,465 |
| 2. | 24515 | 1.1% | 0.69%(+0.397)#312 | 1.2%(-0.117)#15,875 |
| 3. | 24502 | 0.54% | 0.69%(-0.149)#396 | 1.2%(-0.663)#18,964 |
| 4. | 24503 | 0.44% | 0.69%(-0.249)#419 | 1.2%(-0.762)#19,828 |
| 5. | 24504 | 0.43% | 0.69%(-0.255)#422 | 1.2%(-0.768)#19,882 |
1
Common Questions
What are the Top 3 Zip Codes with the Highest Percentage of Population Employed in Agriculture, Fishing & Hunting in Lynchburg, VA?
Top 3 Zip Codes with the Highest Percentage of Population Employed in Agriculture, Fishing & Hunting in Lynchburg, VA are:
What zip code has the Highest Percentage of Population Employed in Agriculture, Fishing & Hunting in Lynchburg, VA?
24501 has the Highest Percentage of Population Employed in Agriculture, Fishing & Hunting in Lynchburg, VA with 1.2%.
What is the Percentage of Population Employed in Agriculture, Fishing & Hunting in Lynchburg, VA?
Percentage of Population Employed in Agriculture, Fishing & Hunting in Lynchburg is 0.51%.
What is the Percentage of Population Employed in Agriculture, Fishing & Hunting in Virginia?
Percentage of Population Employed in Agriculture, Fishing & Hunting in Virginia is 0.69%.
What is the Percentage of Population Employed in Agriculture, Fishing & Hunting in the United States?
Percentage of Population Employed in Agriculture, Fishing & Hunting in the United States is 1.2%.