Zip Codes with the Highest Percentage of Population Employed in Agriculture, Fishing & Hunting in Leesburg, VA
RELATED REPORTS & OPTIONS
Agriculture, Fishing & Hunting
Leesburg
Compare Zip Codes
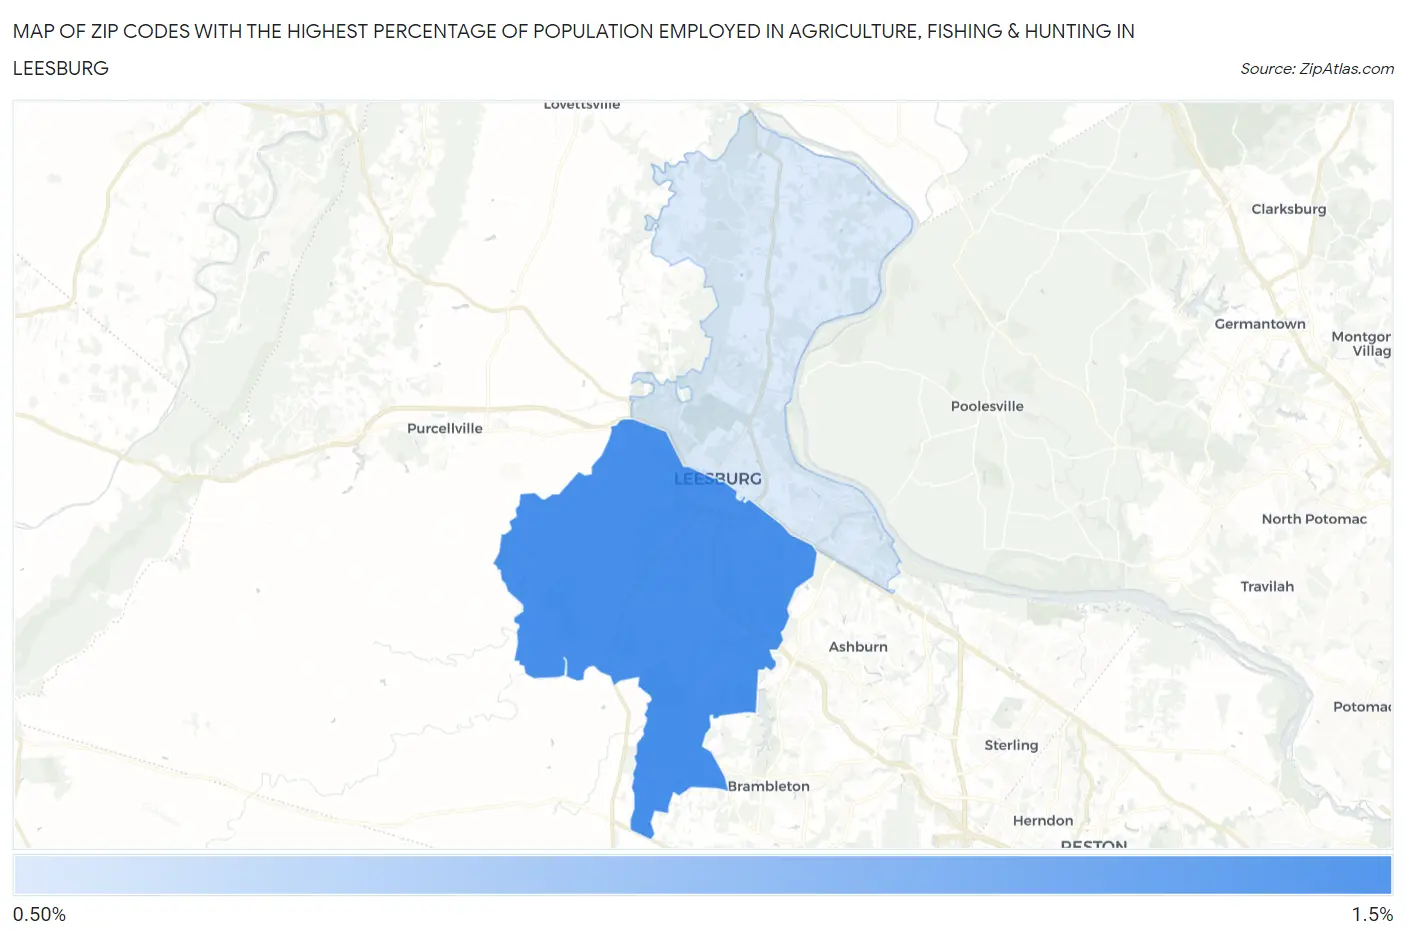
Map of Zip Codes with the Highest Percentage of Population Employed in Agriculture, Fishing & Hunting in Leesburg
0.0%
1.5%
Zip Codes with the Highest Percentage of Population Employed in Agriculture, Fishing & Hunting in Leesburg, VA
| Zip Code | % Employed | vs State | vs National | |
| 1. | 20175 | 1.0% | 0.69%(+0.338)#318 | 1.2%(-0.175)#16,111 |
| 2. | 20176 | 0.59% | 0.69%(-0.100)#381 | 1.2%(-0.613)#18,578 |
1
Common Questions
What are the Top Zip Codes with the Highest Percentage of Population Employed in Agriculture, Fishing & Hunting in Leesburg, VA?
Top Zip Codes with the Highest Percentage of Population Employed in Agriculture, Fishing & Hunting in Leesburg, VA are:
What zip code has the Highest Percentage of Population Employed in Agriculture, Fishing & Hunting in Leesburg, VA?
20175 has the Highest Percentage of Population Employed in Agriculture, Fishing & Hunting in Leesburg, VA with 1.0%.
What is the Percentage of Population Employed in Agriculture, Fishing & Hunting in Leesburg, VA?
Percentage of Population Employed in Agriculture, Fishing & Hunting in Leesburg is 0.66%.
What is the Percentage of Population Employed in Agriculture, Fishing & Hunting in Virginia?
Percentage of Population Employed in Agriculture, Fishing & Hunting in Virginia is 0.69%.
What is the Percentage of Population Employed in Agriculture, Fishing & Hunting in the United States?
Percentage of Population Employed in Agriculture, Fishing & Hunting in the United States is 1.2%.