Zip Codes with the Highest Percentage of Households Heated by Bottled Gas / Liquid Propane in Leesburg, VA
RELATED REPORTS & OPTIONS
Bottled Gas / LP Heating
Leesburg
Compare Zip Codes
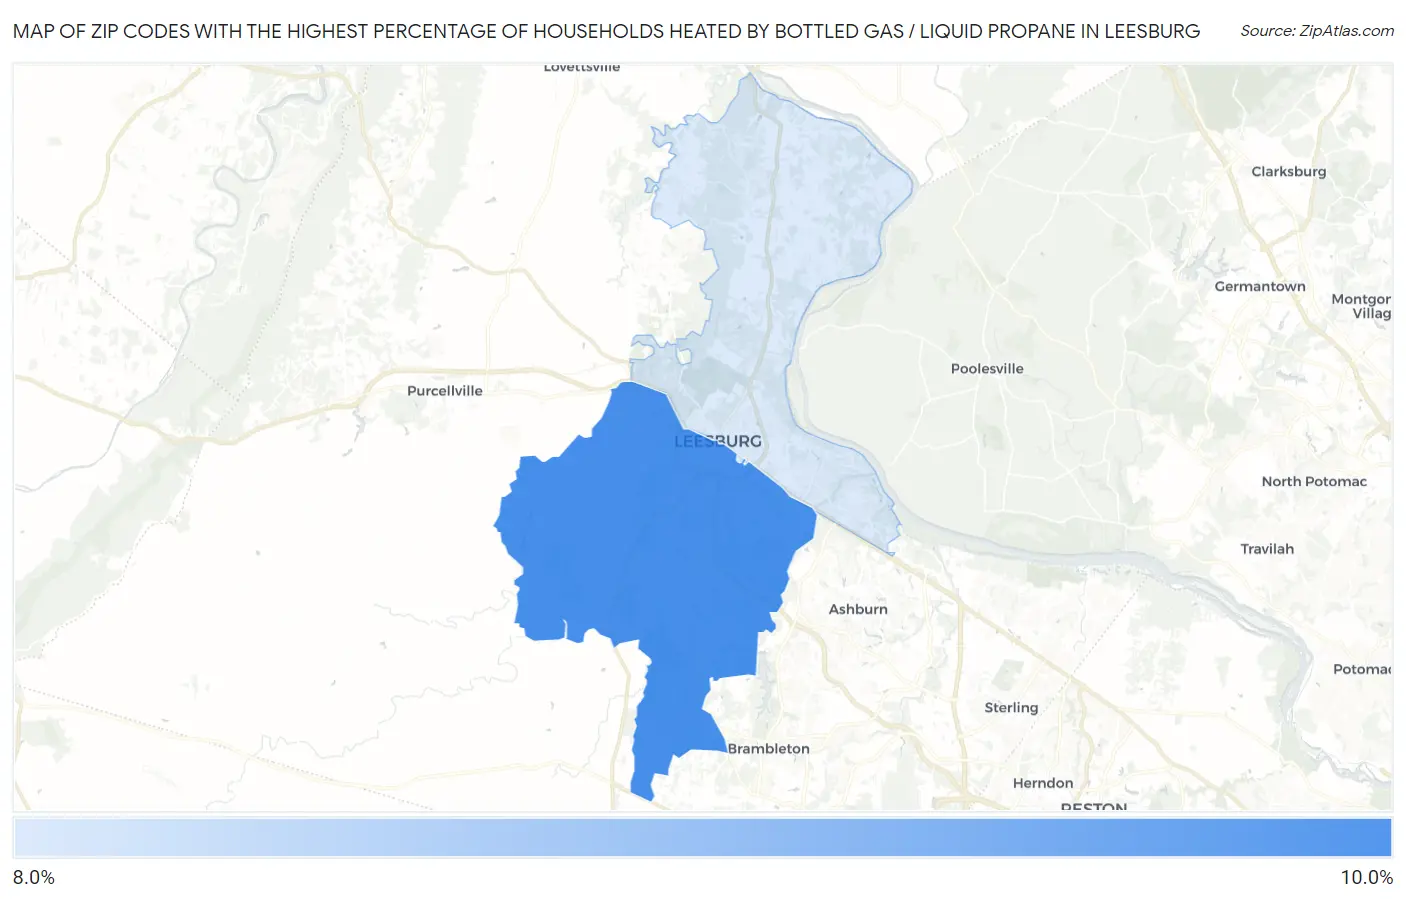
Map of Zip Codes with the Highest Percentage of Households Heated by Bottled Gas / Liquid Propane in Leesburg
0.0%
10.0%
Zip Codes with the Highest Percentage of Households Heated by Bottled Gas / Liquid Propane in Leesburg, VA
| Zip Code | Bottled Gas / LP Heating | vs State | vs National | |
| 1. | 20175 | 9.7% | 4.2%(+5.50)#319 | 4.9%(+4.80)#14,655 |
| 2. | 20176 | 8.5% | 4.2%(+4.30)#356 | 4.9%(+3.60)#15,524 |
1
Common Questions
What are the Top Zip Codes with the Highest Percentage of Households Heated by Bottled Gas / Liquid Propane in Leesburg, VA?
Top Zip Codes with the Highest Percentage of Households Heated by Bottled Gas / Liquid Propane in Leesburg, VA are:
What zip code has the Highest Percentage of Households Heated by Bottled Gas / Liquid Propane in Leesburg, VA?
20175 has the Highest Percentage of Households Heated by Bottled Gas / Liquid Propane in Leesburg, VA with 9.7%.
What is the Percentage of Households Heated by Bottled Gas / Liquid Propane in Leesburg, VA?
Percentage of Households Heated by Bottled Gas / Liquid Propane in Leesburg is 1.4%.
What is the Percentage of Households Heated by Bottled Gas / Liquid Propane in Virginia?
Percentage of Households Heated by Bottled Gas / Liquid Propane in Virginia is 4.2%.
What is the Percentage of Households Heated by Bottled Gas / Liquid Propane in the United States?
Percentage of Households Heated by Bottled Gas / Liquid Propane in the United States is 4.9%.