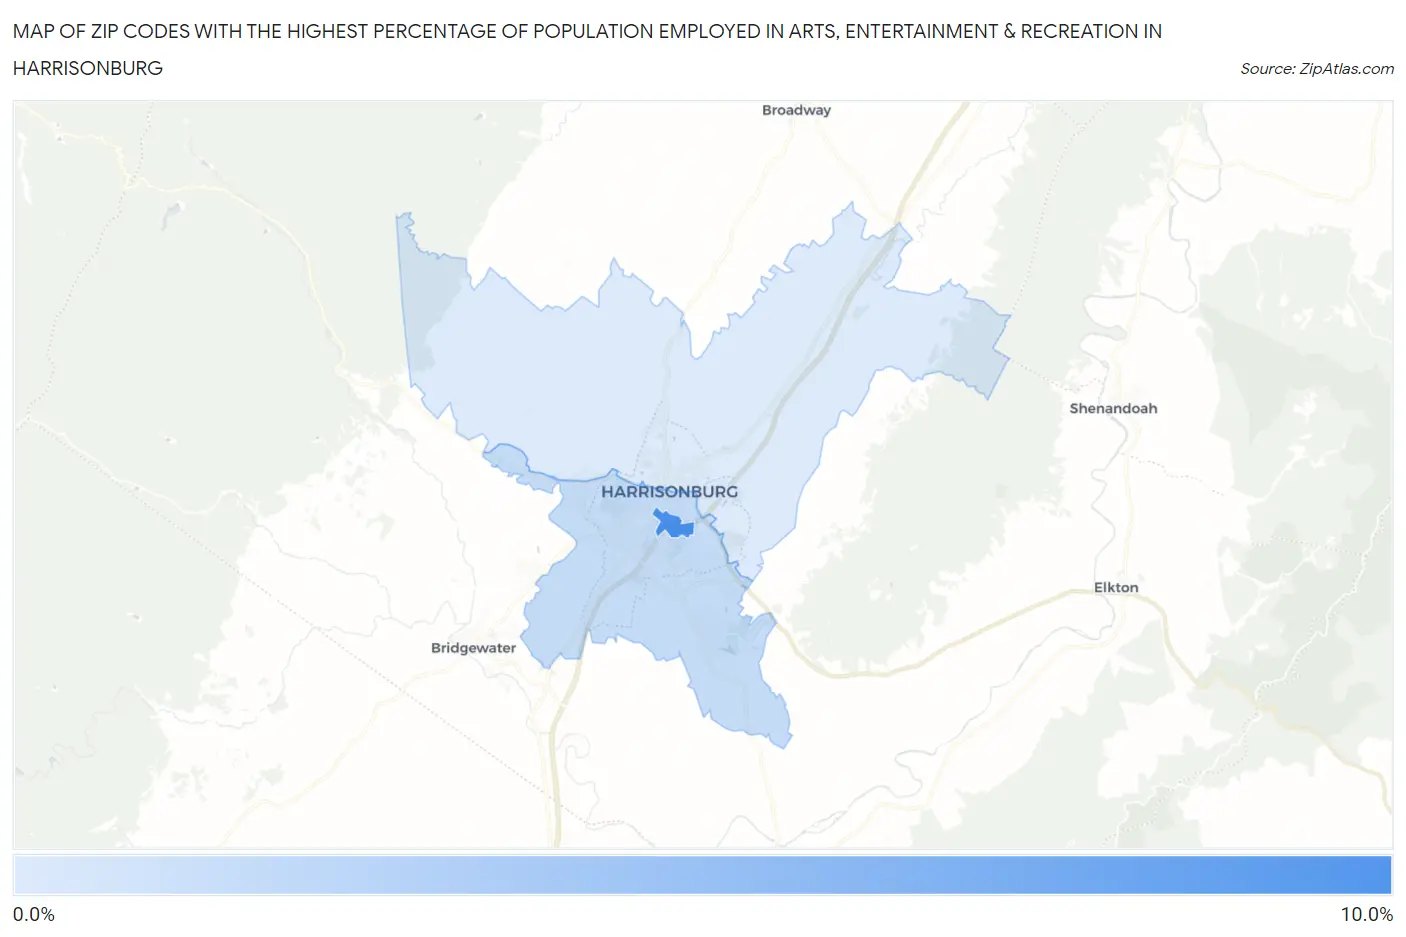
Zip Codes with the Highest Percentage of Population Employed in Arts, Entertainment & Recreation in Harrisonburg, VA
RELATED REPORTS & OPTIONS
Arts, Entertainment & Recreation
Harrisonburg
Compare Zip Codes
Map of Zip Codes with the Highest Percentage of Population Employed in Arts, Entertainment & Recreation in Harrisonburg
0.0%
10.0%
Zip Codes with the Highest Percentage of Population Employed in Arts, Entertainment & Recreation in Harrisonburg, VA
| Zip Code | % Employed | vs State | vs National | |
| 1. | 22807 | 9.8% | 1.9%(+7.96)#21 | 2.1%(+7.73)#732 |
| 2. | 22801 | 2.7% | 1.9%(+0.834)#149 | 2.1%(+0.601)#6,419 |
| 3. | 22802 | 1.4% | 1.9%(-0.414)#346 | 2.1%(-0.646)#13,714 |
1
Common Questions
What are the Top Zip Codes with the Highest Percentage of Population Employed in Arts, Entertainment & Recreation in Harrisonburg, VA?
Top Zip Codes with the Highest Percentage of Population Employed in Arts, Entertainment & Recreation in Harrisonburg, VA are:
What zip code has the Highest Percentage of Population Employed in Arts, Entertainment & Recreation in Harrisonburg, VA?
22807 has the Highest Percentage of Population Employed in Arts, Entertainment & Recreation in Harrisonburg, VA with 9.8%.
What is the Percentage of Population Employed in Arts, Entertainment & Recreation in Harrisonburg, VA?
Percentage of Population Employed in Arts, Entertainment & Recreation in Harrisonburg is 2.6%.
What is the Percentage of Population Employed in Arts, Entertainment & Recreation in Virginia?
Percentage of Population Employed in Arts, Entertainment & Recreation in Virginia is 1.9%.
What is the Percentage of Population Employed in Arts, Entertainment & Recreation in the United States?
Percentage of Population Employed in Arts, Entertainment & Recreation in the United States is 2.1%.