Zip Codes with the Highest Percentage of Population Employed in Health Care & Social Assistance in Falls Church, VA
RELATED REPORTS & OPTIONS
Health Care & Social Assistance
Falls Church
Compare Zip Codes
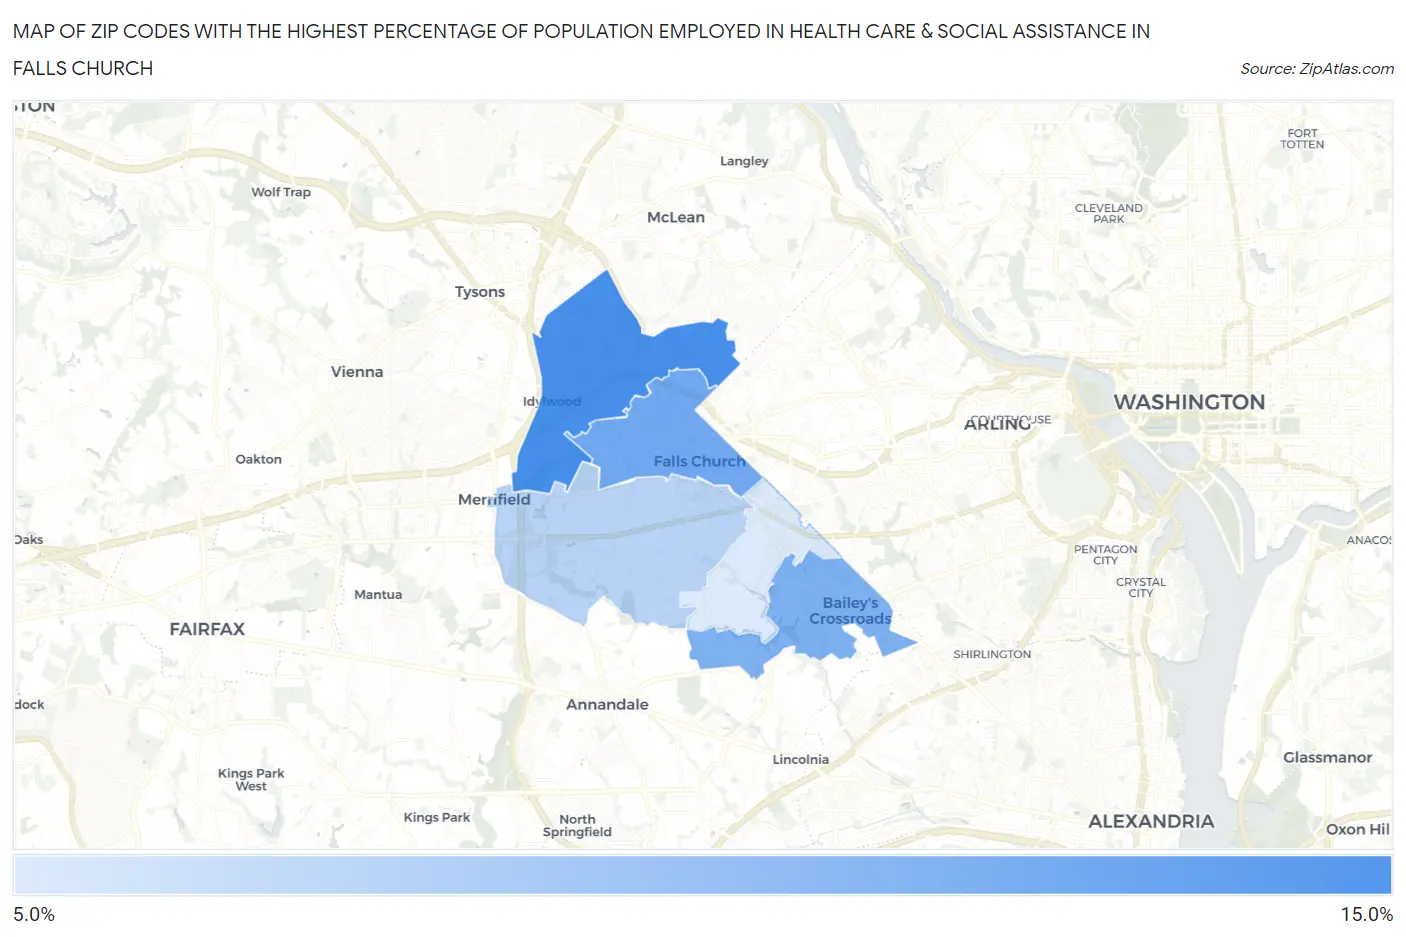
Map of Zip Codes with the Highest Percentage of Population Employed in Health Care & Social Assistance in Falls Church
0.0%
15.0%
Zip Codes with the Highest Percentage of Population Employed in Health Care & Social Assistance in Falls Church, VA
| Zip Code | % Employed | vs State | vs National | |
| 1. | 22043 | 10.7% | 12.3%(-1.62)#540 | 13.9%(-3.26)#22,070 |
| 2. | 22046 | 9.6% | 12.3%(-2.66)#594 | 13.9%(-4.31)#24,139 |
| 3. | 22041 | 9.3% | 12.3%(-2.99)#619 | 13.9%(-4.64)#24,703 |
| 4. | 22042 | 7.9% | 12.3%(-4.39)#683 | 13.9%(-6.04)#26,591 |
| 5. | 22044 | 7.0% | 12.3%(-5.29)#710 | 13.9%(-6.93)#27,506 |
1
Common Questions
What are the Top 3 Zip Codes with the Highest Percentage of Population Employed in Health Care & Social Assistance in Falls Church, VA?
Top 3 Zip Codes with the Highest Percentage of Population Employed in Health Care & Social Assistance in Falls Church, VA are:
What zip code has the Highest Percentage of Population Employed in Health Care & Social Assistance in Falls Church, VA?
22043 has the Highest Percentage of Population Employed in Health Care & Social Assistance in Falls Church, VA with 10.7%.
What is the Percentage of Population Employed in Health Care & Social Assistance in Falls Church, VA?
Percentage of Population Employed in Health Care & Social Assistance in Falls Church is 9.4%.
What is the Percentage of Population Employed in Health Care & Social Assistance in Virginia?
Percentage of Population Employed in Health Care & Social Assistance in Virginia is 12.3%.
What is the Percentage of Population Employed in Health Care & Social Assistance in the United States?
Percentage of Population Employed in Health Care & Social Assistance in the United States is 13.9%.