Zip Codes with the Highest Percentage of Population Employed in Arts, Entertainment & Recreation in Falls Church, VA
RELATED REPORTS & OPTIONS
Arts, Entertainment & Recreation
Falls Church
Compare Zip Codes
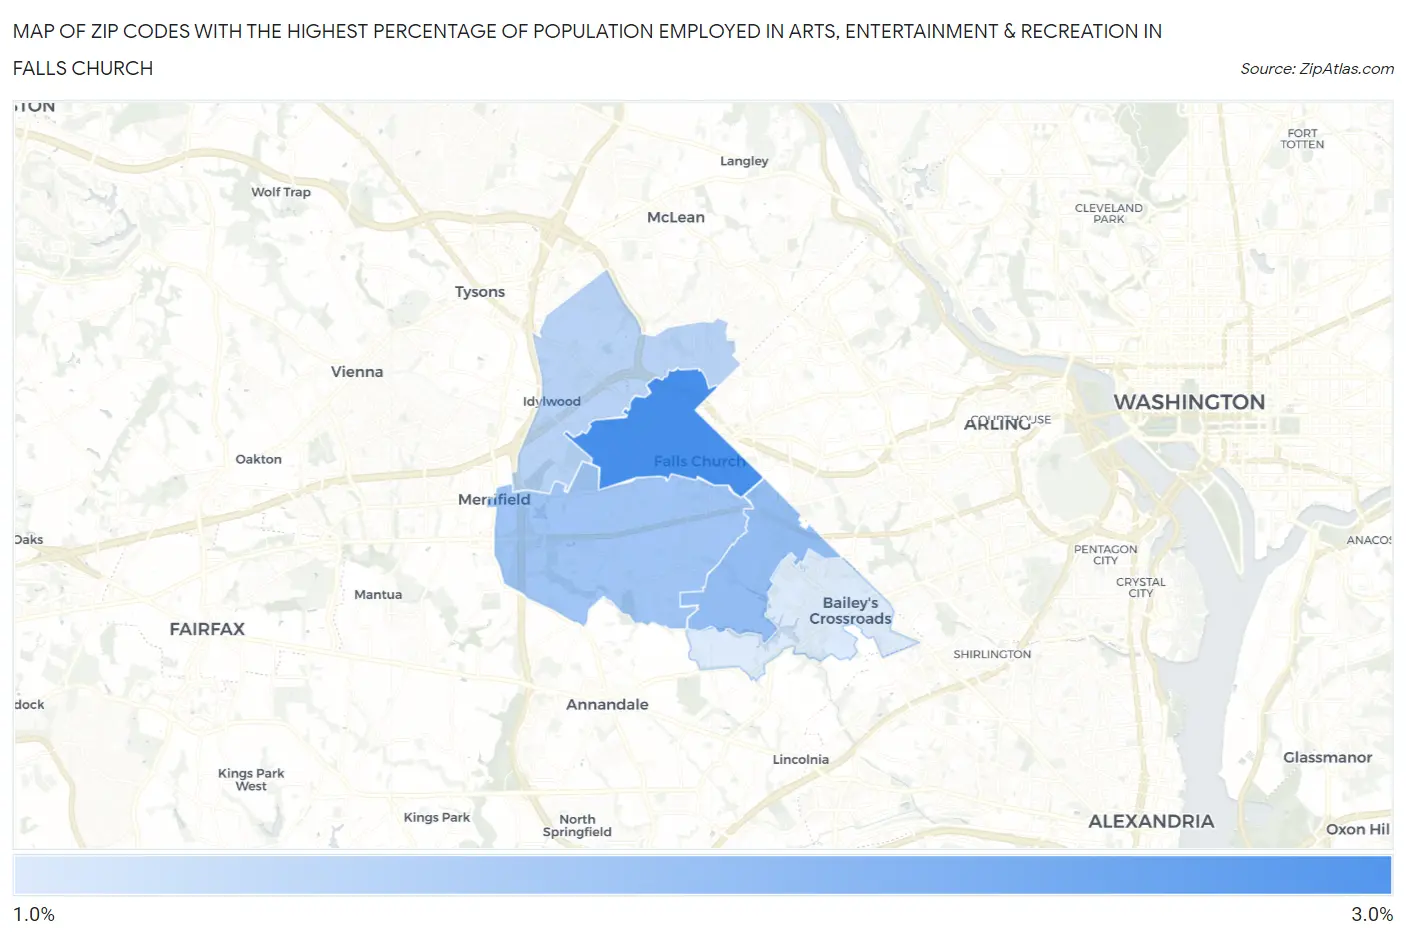
Map of Zip Codes with the Highest Percentage of Population Employed in Arts, Entertainment & Recreation in Falls Church
0.0%
3.0%
Zip Codes with the Highest Percentage of Population Employed in Arts, Entertainment & Recreation in Falls Church, VA
| Zip Code | % Employed | vs State | vs National | |
| 1. | 22046 | 2.6% | 1.9%(+0.737)#160 | 2.1%(+0.505)#6,810 |
| 2. | 22044 | 1.9% | 1.9%(+0.069)#252 | 2.1%(-0.163)#10,265 |
| 3. | 22042 | 1.8% | 1.9%(-0.065)#273 | 2.1%(-0.297)#11,120 |
| 4. | 22043 | 1.6% | 1.9%(-0.259)#313 | 2.1%(-0.491)#12,528 |
| 5. | 22041 | 1.3% | 1.9%(-0.589)#370 | 2.1%(-0.821)#15,010 |
1
Common Questions
What are the Top 3 Zip Codes with the Highest Percentage of Population Employed in Arts, Entertainment & Recreation in Falls Church, VA?
Top 3 Zip Codes with the Highest Percentage of Population Employed in Arts, Entertainment & Recreation in Falls Church, VA are:
What zip code has the Highest Percentage of Population Employed in Arts, Entertainment & Recreation in Falls Church, VA?
22046 has the Highest Percentage of Population Employed in Arts, Entertainment & Recreation in Falls Church, VA with 2.6%.
What is the Percentage of Population Employed in Arts, Entertainment & Recreation in Falls Church, VA?
Percentage of Population Employed in Arts, Entertainment & Recreation in Falls Church is 2.4%.
What is the Percentage of Population Employed in Arts, Entertainment & Recreation in Virginia?
Percentage of Population Employed in Arts, Entertainment & Recreation in Virginia is 1.9%.
What is the Percentage of Population Employed in Arts, Entertainment & Recreation in the United States?
Percentage of Population Employed in Arts, Entertainment & Recreation in the United States is 2.1%.