Zip Codes with the Highest Percentage of Black / African American Population in Danville, VA
RELATED REPORTS & OPTIONS
Black / African American
Danville
Compare Zip Codes
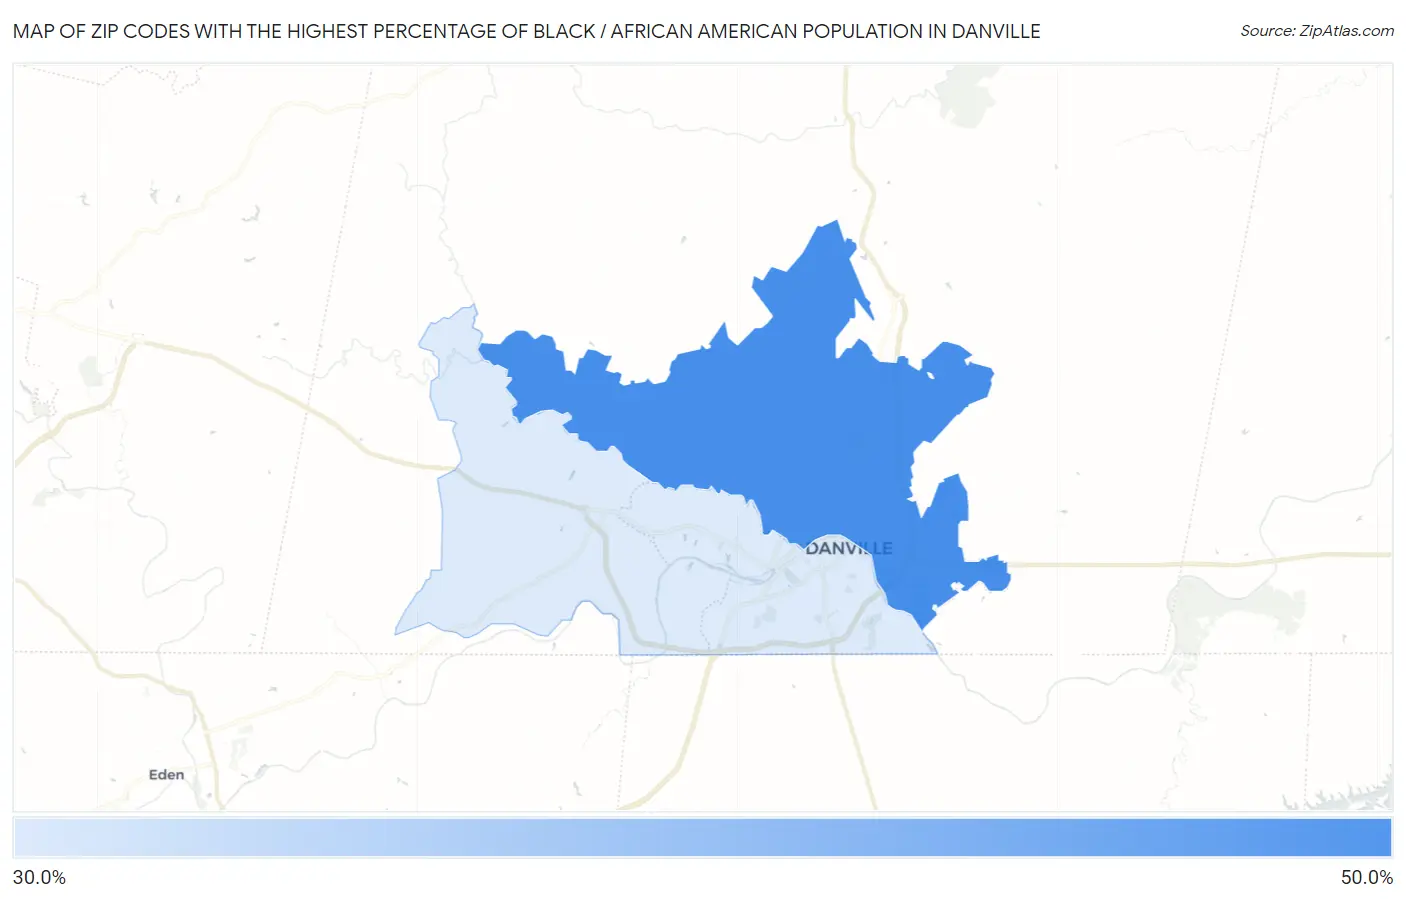
Map of Zip Codes with the Highest Percentage of Black / African American Population in Danville
39.9%
40.9%
Zip Codes with the Highest Percentage of Black / African American Population in Danville, VA
| Zip Code | Black / African American | vs State | vs National | |
| 1. | 24540 | 40.9% | 18.9%(+22.0)#97 | 12.5%(+28.4)#1,782 |
| 2. | 24541 | 39.9% | 18.9%(+21.0)#102 | 12.5%(+27.4)#1,859 |
1
Common Questions
What are the Top Zip Codes with the Highest Percentage of Black / African American Population in Danville, VA?
Top Zip Codes with the Highest Percentage of Black / African American Population in Danville, VA are:
What zip code has the Highest Percentage of Black / African American Population in Danville, VA?
24540 has the Highest Percentage of Black / African American Population in Danville, VA with 40.9%.
What is the Percentage of Black / African American Population in Danville, VA?
Percentage of Black / African American Population in Danville is 50.2%.
What is the Percentage of Black / African American Population in Virginia?
Percentage of Black / African American Population in Virginia is 18.9%.
What is the Percentage of Black / African American Population in the United States?
Percentage of Black / African American Population in the United States is 12.5%.