Zip Codes with the Highest Percentage of Population Employed in Arts, Entertainment & Recreation in Utah
RELATED REPORTS & OPTIONS
Arts, Entertainment & Recreation
Utah
Compare Zip Codes
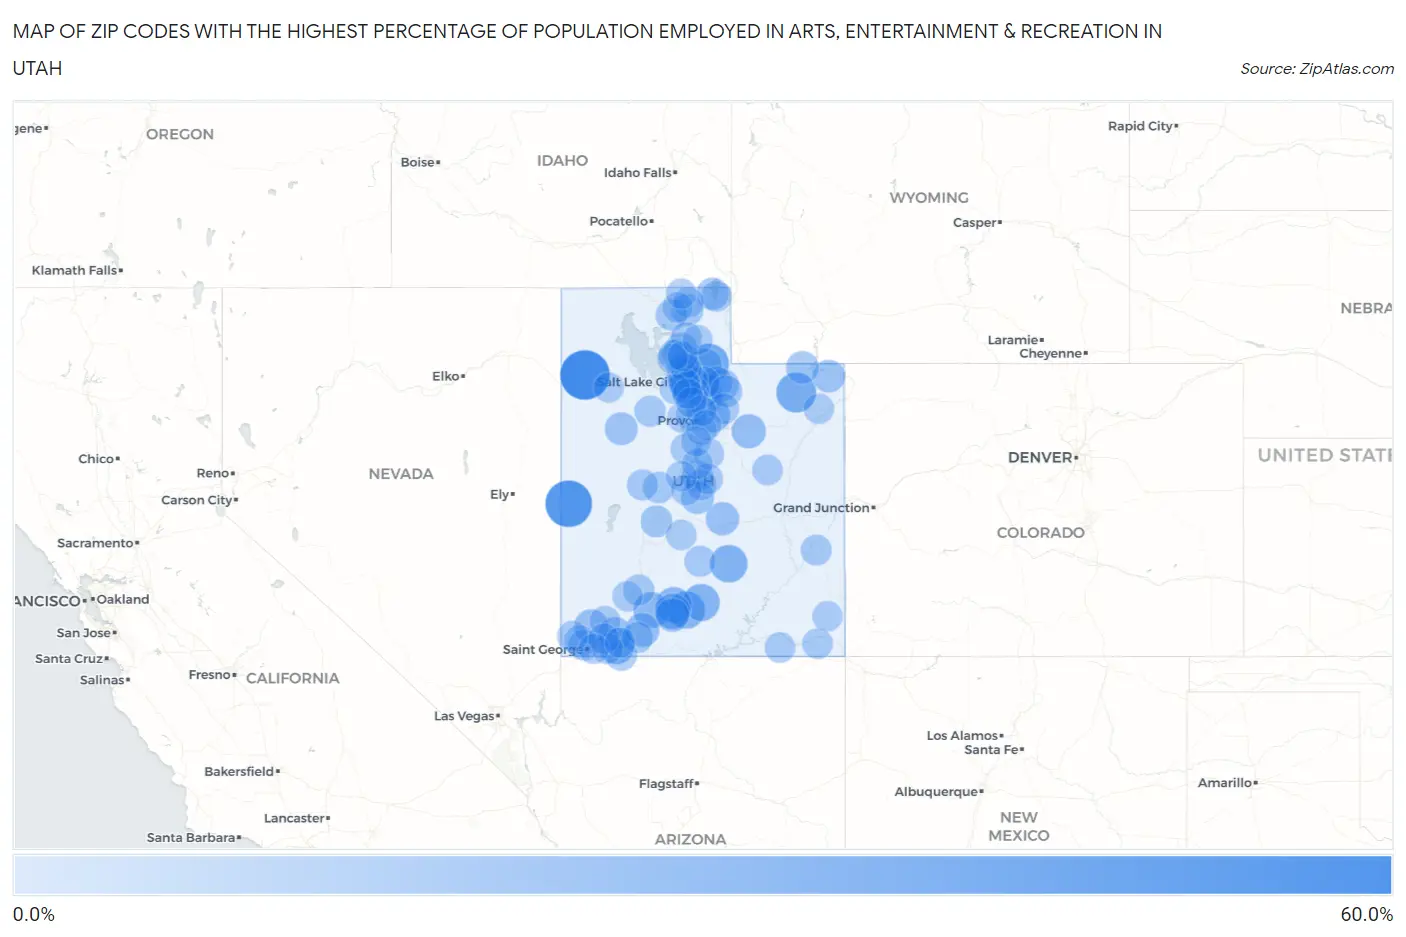
Map of Zip Codes with the Highest Percentage of Population Employed in Arts, Entertainment & Recreation in Utah
0.0%
60.0%
Zip Codes with the Highest Percentage of Population Employed in Arts, Entertainment & Recreation in Utah
| Zip Code | % Employed | vs State | vs National | |
| 1. | 84083 | 51.8% | 2.1%(+49.8)#1 | 2.1%(+49.8)#30 |
| 2. | 84728 | 44.2% | 2.1%(+42.1)#2 | 2.1%(+42.1)#44 |
| 3. | 84024 | 28.2% | 2.1%(+26.1)#3 | 2.1%(+26.1)#91 |
| 4. | 84085 | 26.5% | 2.1%(+24.4)#4 | 2.1%(+24.4)#107 |
| 5. | 84775 | 20.6% | 2.1%(+18.6)#5 | 2.1%(+18.6)#172 |
| 6. | 84736 | 20.0% | 2.1%(+17.9)#6 | 2.1%(+17.9)#183 |
| 7. | 84726 | 19.5% | 2.1%(+17.4)#7 | 2.1%(+17.4)#194 |
| 8. | 84764 | 16.3% | 2.1%(+14.2)#8 | 2.1%(+14.2)#277 |
| 9. | 84735 | 16.3% | 2.1%(+14.2)#9 | 2.1%(+14.2)#278 |
| 10. | 84763 | 16.2% | 2.1%(+14.1)#10 | 2.1%(+14.1)#284 |
| 11. | 84776 | 15.5% | 2.1%(+13.4)#11 | 2.1%(+13.4)#317 |
| 12. | 84082 | 14.3% | 2.1%(+12.2)#12 | 2.1%(+12.2)#370 |
| 13. | 84027 | 11.8% | 2.1%(+9.71)#13 | 2.1%(+9.71)#527 |
| 14. | 84781 | 11.3% | 2.1%(+9.19)#14 | 2.1%(+9.20)#573 |
| 15. | 84729 | 11.2% | 2.1%(+9.10)#15 | 2.1%(+9.10)#583 |
| 16. | 84049 | 11.1% | 2.1%(+9.04)#16 | 2.1%(+9.04)#590 |
| 17. | 84033 | 10.6% | 2.1%(+8.54)#17 | 2.1%(+8.54)#634 |
| 18. | 84779 | 10.1% | 2.1%(+8.06)#18 | 2.1%(+8.06)#688 |
| 19. | 84718 | 10.1% | 2.1%(+7.99)#19 | 2.1%(+7.99)#695 |
| 20. | 84060 | 9.8% | 2.1%(+7.73)#20 | 2.1%(+7.74)#730 |
| 21. | 84522 | 9.7% | 2.1%(+7.63)#21 | 2.1%(+7.63)#744 |
| 22. | 84665 | 9.0% | 2.1%(+6.91)#22 | 2.1%(+6.92)#857 |
| 23. | 84022 | 8.6% | 2.1%(+6.55)#23 | 2.1%(+6.56)#920 |
| 24. | 84023 | 8.2% | 2.1%(+6.11)#24 | 2.1%(+6.11)#1,006 |
| 25. | 84046 | 8.2% | 2.1%(+6.07)#25 | 2.1%(+6.07)#1,018 |
| 26. | 84055 | 7.9% | 2.1%(+5.82)#26 | 2.1%(+5.83)#1,084 |
| 27. | 84061 | 7.2% | 2.1%(+5.16)#27 | 2.1%(+5.16)#1,253 |
| 28. | 84098 | 7.2% | 2.1%(+5.07)#28 | 2.1%(+5.08)#1,282 |
| 29. | 84028 | 7.1% | 2.1%(+5.06)#29 | 2.1%(+5.06)#1,286 |
| 30. | 84408 | 7.1% | 2.1%(+5.06)#30 | 2.1%(+5.06)#1,293 |
| 31. | 84036 | 6.0% | 2.1%(+3.89)#31 | 2.1%(+3.89)#1,714 |
| 32. | 84644 | 5.9% | 2.1%(+3.80)#32 | 2.1%(+3.80)#1,766 |
| 33. | 84332 | 5.7% | 2.1%(+3.59)#33 | 2.1%(+3.59)#1,873 |
| 34. | 84738 | 5.6% | 2.1%(+3.50)#34 | 2.1%(+3.50)#1,917 |
| 35. | 84784 | 5.6% | 2.1%(+3.48)#35 | 2.1%(+3.49)#1,926 |
| 36. | 84667 | 5.4% | 2.1%(+3.28)#36 | 2.1%(+3.29)#2,043 |
| 37. | 84649 | 5.1% | 2.1%(+2.96)#37 | 2.1%(+2.97)#2,250 |
| 38. | 84314 | 4.9% | 2.1%(+2.83)#38 | 2.1%(+2.84)#2,347 |
| 39. | 84645 | 4.5% | 2.1%(+2.41)#39 | 2.1%(+2.41)#2,755 |
| 40. | 84102 | 4.4% | 2.1%(+2.34)#40 | 2.1%(+2.34)#2,819 |
| 41. | 84758 | 4.4% | 2.1%(+2.33)#41 | 2.1%(+2.34)#2,826 |
| 42. | 84069 | 4.4% | 2.1%(+2.31)#42 | 2.1%(+2.31)#2,851 |
| 43. | 84715 | 4.3% | 2.1%(+2.23)#43 | 2.1%(+2.23)#2,944 |
| 44. | 84760 | 4.2% | 2.1%(+2.10)#44 | 2.1%(+2.11)#3,096 |
| 45. | 84124 | 4.0% | 2.1%(+1.90)#45 | 2.1%(+1.91)#3,360 |
| 46. | 84103 | 3.9% | 2.1%(+1.85)#46 | 2.1%(+1.85)#3,434 |
| 47. | 84624 | 3.9% | 2.1%(+1.84)#47 | 2.1%(+1.85)#3,437 |
| 48. | 84532 | 3.9% | 2.1%(+1.81)#48 | 2.1%(+1.82)#3,486 |
| 49. | 84121 | 3.8% | 2.1%(+1.74)#49 | 2.1%(+1.74)#3,599 |
| 50. | 84038 | 3.6% | 2.1%(+1.49)#50 | 2.1%(+1.49)#4,001 |
| 51. | 84770 | 3.5% | 2.1%(+1.44)#51 | 2.1%(+1.44)#4,078 |
| 52. | 84106 | 3.4% | 2.1%(+1.29)#52 | 2.1%(+1.30)#4,404 |
| 53. | 84720 | 3.4% | 2.1%(+1.27)#53 | 2.1%(+1.27)#4,452 |
| 54. | 84765 | 3.3% | 2.1%(+1.22)#54 | 2.1%(+1.23)#4,550 |
| 55. | 84629 | 3.3% | 2.1%(+1.20)#55 | 2.1%(+1.21)#4,593 |
| 56. | 84310 | 3.2% | 2.1%(+1.13)#56 | 2.1%(+1.13)#4,760 |
| 57. | 84737 | 3.2% | 2.1%(+1.11)#57 | 2.1%(+1.11)#4,814 |
| 58. | 84774 | 3.2% | 2.1%(+1.07)#58 | 2.1%(+1.08)#4,904 |
| 59. | 84627 | 3.1% | 2.1%(+1.06)#59 | 2.1%(+1.07)#4,927 |
| 60. | 84662 | 3.1% | 2.1%(+1.04)#60 | 2.1%(+1.05)#4,986 |
| 61. | 84780 | 3.1% | 2.1%(+1.01)#61 | 2.1%(+1.02)#5,063 |
| 62. | 84111 | 3.1% | 2.1%(+1.01)#62 | 2.1%(+1.01)#5,079 |
| 63. | 84032 | 3.0% | 2.1%(+0.939)#63 | 2.1%(+0.942)#5,288 |
| 64. | 84512 | 3.0% | 2.1%(+0.929)#64 | 2.1%(+0.933)#5,316 |
| 65. | 84059 | 2.9% | 2.1%(+0.859)#65 | 2.1%(+0.862)#5,520 |
| 66. | 84539 | 2.9% | 2.1%(+0.856)#66 | 2.1%(+0.859)#5,533 |
| 67. | 84630 | 2.9% | 2.1%(+0.821)#67 | 2.1%(+0.824)#5,627 |
| 68. | 84087 | 2.9% | 2.1%(+0.809)#68 | 2.1%(+0.812)#5,663 |
| 69. | 84045 | 2.9% | 2.1%(+0.806)#69 | 2.1%(+0.809)#5,673 |
| 70. | 84632 | 2.8% | 2.1%(+0.764)#70 | 2.1%(+0.767)#5,821 |
| 71. | 84092 | 2.8% | 2.1%(+0.753)#71 | 2.1%(+0.757)#5,858 |
| 72. | 84664 | 2.8% | 2.1%(+0.694)#72 | 2.1%(+0.697)#6,066 |
| 73. | 84117 | 2.8% | 2.1%(+0.693)#73 | 2.1%(+0.696)#6,069 |
| 74. | 84010 | 2.8% | 2.1%(+0.692)#74 | 2.1%(+0.695)#6,081 |
| 75. | 84604 | 2.8% | 2.1%(+0.671)#75 | 2.1%(+0.674)#6,159 |
| 76. | 84536 | 2.7% | 2.1%(+0.663)#76 | 2.1%(+0.666)#6,192 |
| 77. | 84108 | 2.7% | 2.1%(+0.632)#77 | 2.1%(+0.635)#6,293 |
| 78. | 84639 | 2.7% | 2.1%(+0.609)#78 | 2.1%(+0.612)#6,387 |
| 79. | 84701 | 2.7% | 2.1%(+0.593)#79 | 2.1%(+0.597)#6,441 |
| 80. | 84318 | 2.7% | 2.1%(+0.586)#80 | 2.1%(+0.590)#6,476 |
| 81. | 84014 | 2.6% | 2.1%(+0.549)#81 | 2.1%(+0.552)#6,626 |
| 82. | 84056 | 2.6% | 2.1%(+0.541)#82 | 2.1%(+0.544)#6,653 |
| 83. | 84761 | 2.5% | 2.1%(+0.426)#83 | 2.1%(+0.429)#7,132 |
| 84. | 84037 | 2.5% | 2.1%(+0.403)#84 | 2.1%(+0.406)#7,226 |
| 85. | 84105 | 2.4% | 2.1%(+0.364)#85 | 2.1%(+0.367)#7,411 |
| 86. | 84015 | 2.4% | 2.1%(+0.352)#86 | 2.1%(+0.355)#7,475 |
| 87. | 84075 | 2.4% | 2.1%(+0.337)#87 | 2.1%(+0.340)#7,543 |
| 88. | 84325 | 2.4% | 2.1%(+0.330)#88 | 2.1%(+0.333)#7,572 |
| 89. | 84029 | 2.4% | 2.1%(+0.313)#89 | 2.1%(+0.317)#7,651 |
| 90. | 84118 | 2.4% | 2.1%(+0.293)#90 | 2.1%(+0.296)#7,752 |
| 91. | 84004 | 2.4% | 2.1%(+0.284)#91 | 2.1%(+0.287)#7,790 |
| 92. | 84663 | 2.4% | 2.1%(+0.273)#92 | 2.1%(+0.276)#7,844 |
| 93. | 84078 | 2.3% | 2.1%(+0.261)#93 | 2.1%(+0.264)#7,891 |
| 94. | 84040 | 2.3% | 2.1%(+0.255)#94 | 2.1%(+0.258)#7,924 |
| 95. | 84338 | 2.3% | 2.1%(+0.248)#95 | 2.1%(+0.251)#7,966 |
| 96. | 84093 | 2.3% | 2.1%(+0.247)#96 | 2.1%(+0.250)#7,969 |
| 97. | 84511 | 2.3% | 2.1%(+0.181)#97 | 2.1%(+0.184)#8,287 |
| 98. | 84767 | 2.2% | 2.1%(+0.151)#98 | 2.1%(+0.154)#8,434 |
| 99. | 84651 | 2.2% | 2.1%(+0.140)#99 | 2.1%(+0.143)#8,486 |
| 100. | 84317 | 2.2% | 2.1%(+0.106)#100 | 2.1%(+0.109)#8,690 |
Common Questions
What are the Top 10 Zip Codes with the Highest Percentage of Population Employed in Arts, Entertainment & Recreation in Utah?
Top 10 Zip Codes with the Highest Percentage of Population Employed in Arts, Entertainment & Recreation in Utah are:
What zip code has the Highest Percentage of Population Employed in Arts, Entertainment & Recreation in Utah?
84083 has the Highest Percentage of Population Employed in Arts, Entertainment & Recreation in Utah with 51.8%.
What is the Percentage of Population Employed in Arts, Entertainment & Recreation in the State of Utah?
Percentage of Population Employed in Arts, Entertainment & Recreation in Utah is 2.1%.
What is the Percentage of Population Employed in Arts, Entertainment & Recreation in the United States?
Percentage of Population Employed in Arts, Entertainment & Recreation in the United States is 2.1%.