Zip Codes with the Highest Percentage of Population Employed in Arts, Entertainment & Recreation in West Jordan, UT
RELATED REPORTS & OPTIONS
Arts, Entertainment & Recreation
West Jordan
Compare Zip Codes
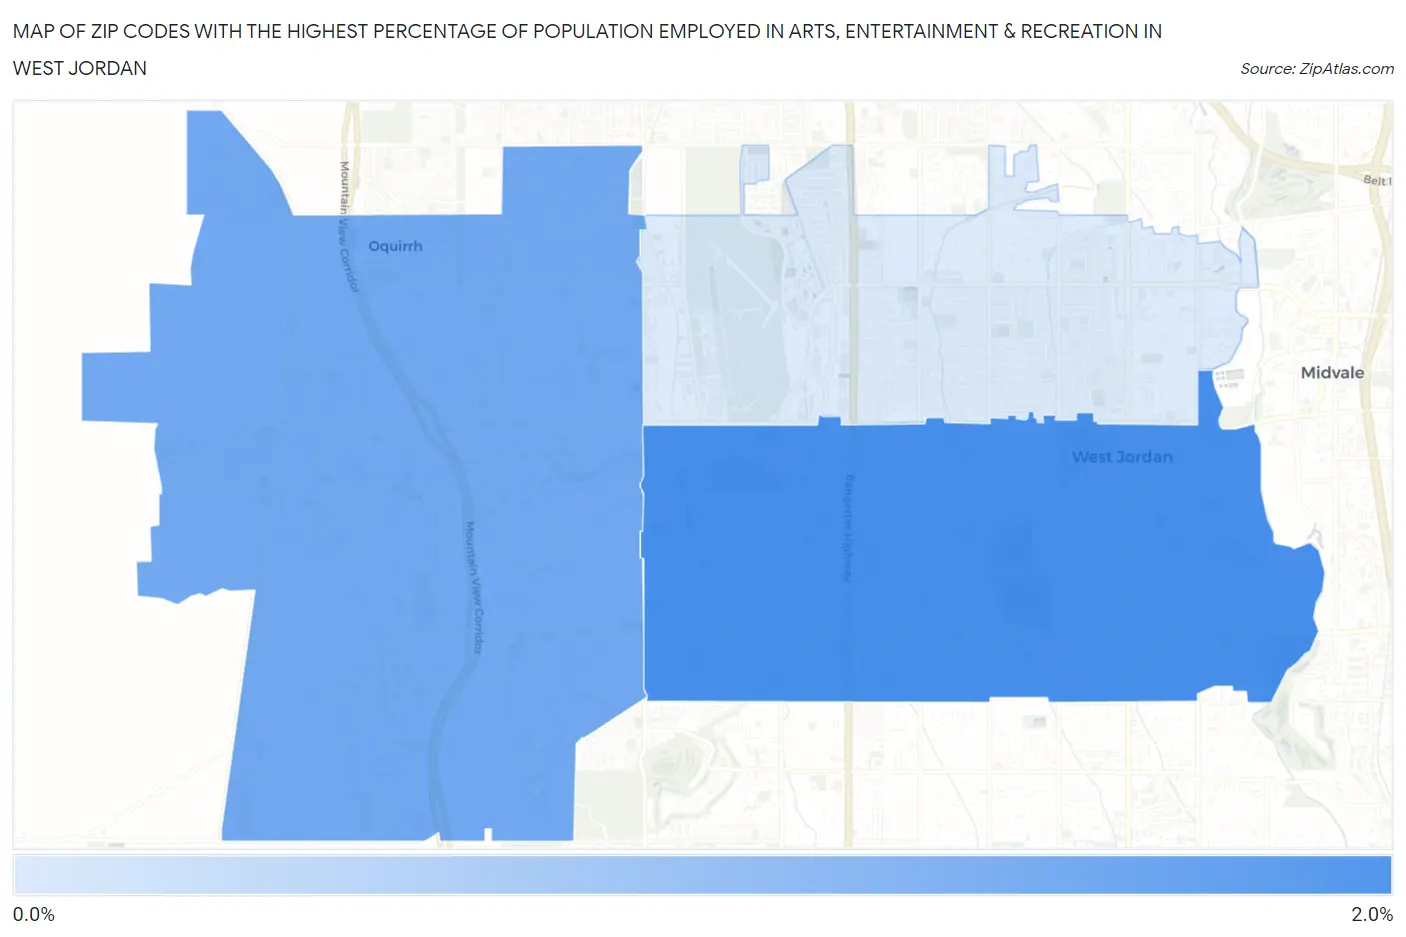
Map of Zip Codes with the Highest Percentage of Population Employed in Arts, Entertainment & Recreation in West Jordan
0.0%
2.0%
Zip Codes with the Highest Percentage of Population Employed in Arts, Entertainment & Recreation in West Jordan, UT
| Zip Code | % Employed | vs State | vs National | |
| 1. | 84088 | 1.6% | 2.1%(-0.513)#138 | 2.1%(-0.510)#12,686 |
| 2. | 84081 | 1.3% | 2.1%(-0.744)#154 | 2.1%(-0.741)#14,435 |
| 3. | 84084 | 0.74% | 2.1%(-1.34)#190 | 2.1%(-1.34)#18,810 |
1
Common Questions
What are the Top Zip Codes with the Highest Percentage of Population Employed in Arts, Entertainment & Recreation in West Jordan, UT?
Top Zip Codes with the Highest Percentage of Population Employed in Arts, Entertainment & Recreation in West Jordan, UT are:
What zip code has the Highest Percentage of Population Employed in Arts, Entertainment & Recreation in West Jordan, UT?
84088 has the Highest Percentage of Population Employed in Arts, Entertainment & Recreation in West Jordan, UT with 1.6%.
What is the Percentage of Population Employed in Arts, Entertainment & Recreation in West Jordan, UT?
Percentage of Population Employed in Arts, Entertainment & Recreation in West Jordan is 1.3%.
What is the Percentage of Population Employed in Arts, Entertainment & Recreation in Utah?
Percentage of Population Employed in Arts, Entertainment & Recreation in Utah is 2.1%.
What is the Percentage of Population Employed in Arts, Entertainment & Recreation in the United States?
Percentage of Population Employed in Arts, Entertainment & Recreation in the United States is 2.1%.