Brian Head, UT
Brian Head Map
Brian Head Overview
60
TOTAL POPULATION
36
MALE POPULATION
24
FEMALE POPULATION
150.00
MALES / 100 FEMALES
66.67
FEMALES / 100 MALES
51.4
MEDIAN AGE
2.6
AVG FAMILY SIZE
1.7
AVG HOUSEHOLD SIZE
$36,067
PER CAPITA INCOME
$80,625
AVG FAMILY INCOME
$63,000
AVG HOUSEHOLD INCOME
0.36
INEQUALITY / GINI INDEX
25
LABOR FORCE [ PEOPLE ]
48.1%
PERCENT IN LABOR FORCE
Brian Head Zip Codes
Brian Head Area Codes
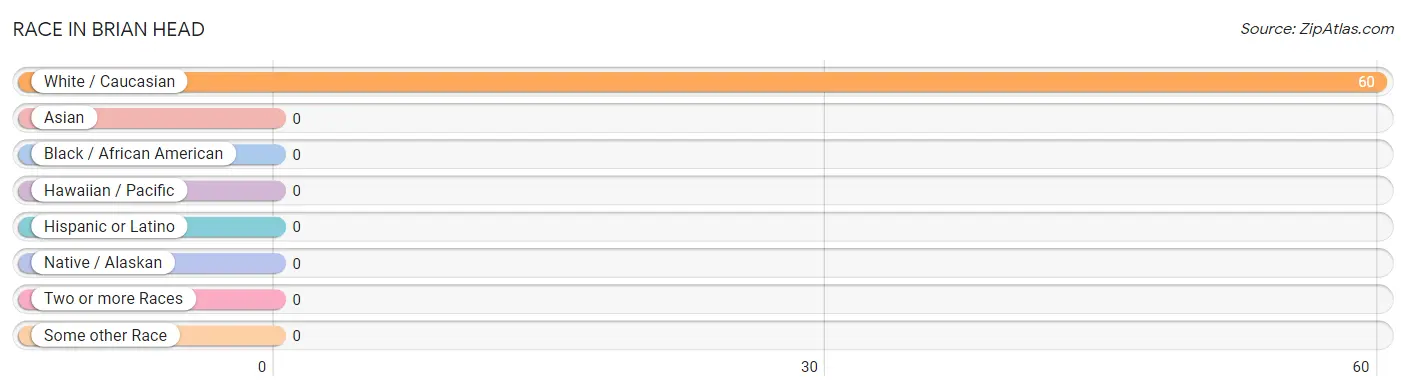
Race in Brian Head
The most populous races in Brian Head are , and White / Caucasian (60 | 100.0%).
| Race | # Population | % Population |
| Asian | 0 | 0.0% |
| Black / African American | 0 | 0.0% |
| Hawaiian / Pacific | 0 | 0.0% |
| Hispanic or Latino | 0 | 0.0% |
| Native / Alaskan | 0 | 0.0% |
| White / Caucasian | 60 | 100.0% |
| Two or more Races | 0 | 0.0% |
| Some other Race | 0 | 0.0% |
| Total | 60 | 100.0% |
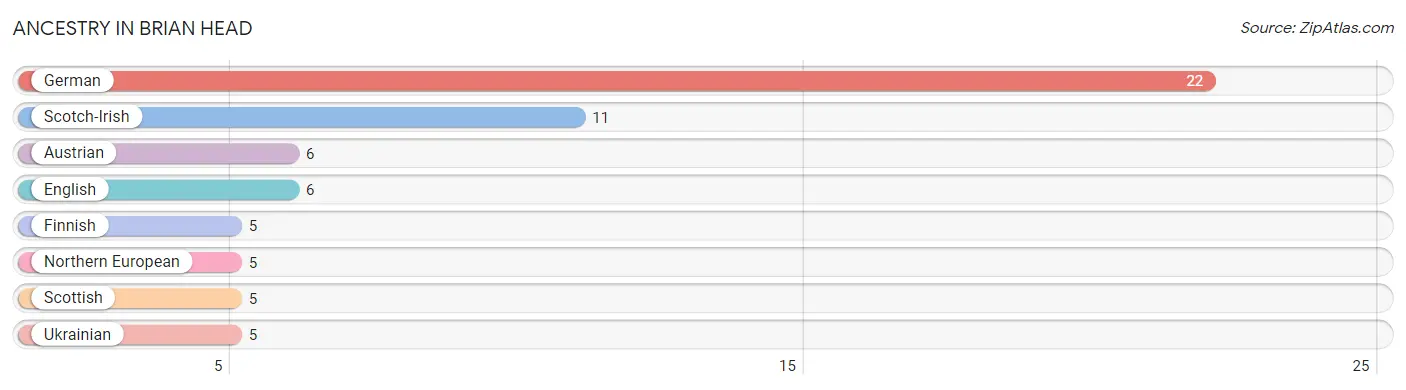
Ancestry in Brian Head
The most populous ancestries reported in Brian Head are German (22 | 36.7%), Scotch-Irish (11 | 18.3%), Austrian (6 | 10.0%), English (6 | 10.0%), and Finnish (5 | 8.3%), together accounting for 83.3% of all Brian Head residents.
| Ancestry | # Population | % Population |
| Austrian | 6 | 10.0% |
| English | 6 | 10.0% |
| Finnish | 5 | 8.3% |
| German | 22 | 36.7% |
| Northern European | 5 | 8.3% |
| Scotch-Irish | 11 | 18.3% |
| Scottish | 5 | 8.3% |
| Ukrainian | 5 | 8.3% | View All 8 Rows |
Immigrants in Brian Head

| Immigration Origin | # Population | % Population | View All 0 Rows |
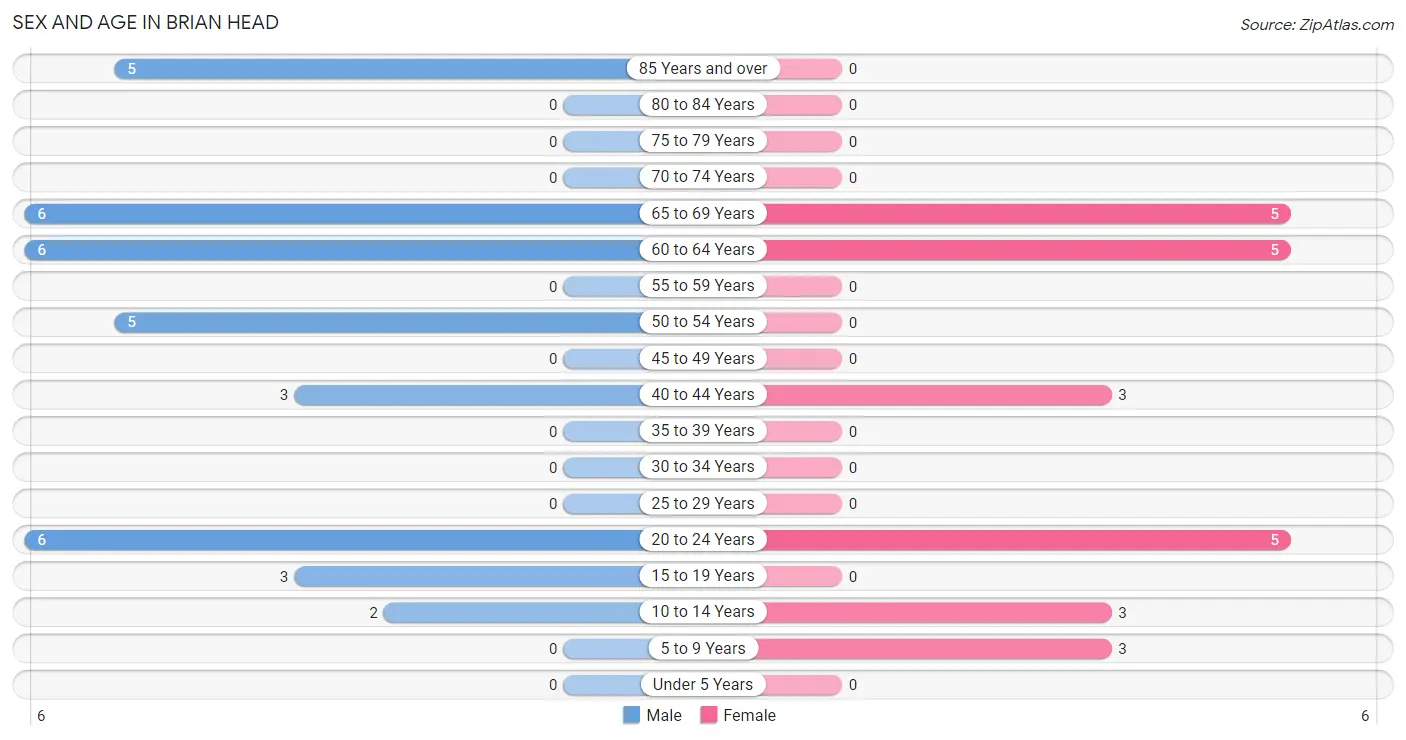
Sex and Age in Brian Head
Sex and Age in Brian Head
The most populous age groups in Brian Head are 20 to 24 Years (6 | 16.7%) for men and 20 to 24 Years (5 | 20.8%) for women.
| Age Bracket | Male | Female |
| Under 5 Years | 0 (0.0%) | 0 (0.0%) |
| 5 to 9 Years | 0 (0.0%) | 3 (12.5%) |
| 10 to 14 Years | 2 (5.6%) | 3 (12.5%) |
| 15 to 19 Years | 3 (8.3%) | 0 (0.0%) |
| 20 to 24 Years | 6 (16.7%) | 5 (20.8%) |
| 25 to 29 Years | 0 (0.0%) | 0 (0.0%) |
| 30 to 34 Years | 0 (0.0%) | 0 (0.0%) |
| 35 to 39 Years | 0 (0.0%) | 0 (0.0%) |
| 40 to 44 Years | 3 (8.3%) | 3 (12.5%) |
| 45 to 49 Years | 0 (0.0%) | 0 (0.0%) |
| 50 to 54 Years | 5 (13.9%) | 0 (0.0%) |
| 55 to 59 Years | 0 (0.0%) | 0 (0.0%) |
| 60 to 64 Years | 6 (16.7%) | 5 (20.8%) |
| 65 to 69 Years | 6 (16.7%) | 5 (20.8%) |
| 70 to 74 Years | 0 (0.0%) | 0 (0.0%) |
| 75 to 79 Years | 0 (0.0%) | 0 (0.0%) |
| 80 to 84 Years | 0 (0.0%) | 0 (0.0%) |
| 85 Years and over | 5 (13.9%) | 0 (0.0%) |
| Total | 36 (100.0%) | 24 (100.0%) |
Families and Households in Brian Head
Median Family Size in Brian Head
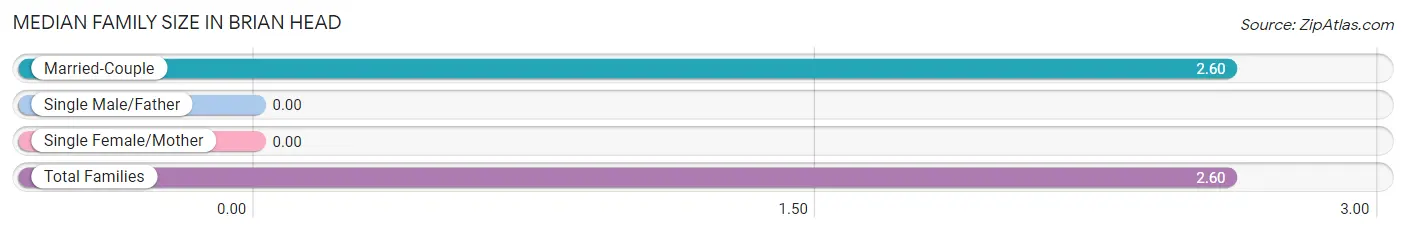
| Family Type | # Families | Family Size |
| Married-Couple | 15 (100.0%) | 2.60 |
| Single Male/Father | 0 (0.0%) | - |
| Single Female/Mother | 0 (0.0%) | - |
| Total Families | 15 (100.0%) | 2.60 |
Median Household Size in Brian Head
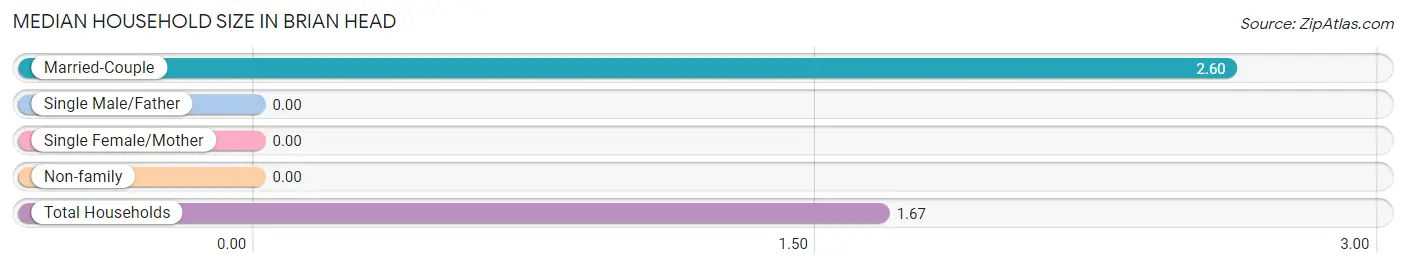
| Household Type | # Households | Household Size |
| Married-Couple | 15 (41.7%) | 2.60 |
| Single Male/Father | 0 (0.0%) | - |
| Single Female/Mother | 0 (0.0%) | - |
| Non-family | 21 (58.3%) | - |
| Total Households | 36 (100.0%) | 1.67 |
Household Size by Marriage Status in Brian Head
Out of a total of 36 households in Brian Head, 15 (41.7%) are family households, while 21 (58.3%) are nonfamily households. The most numerous type of family households are 2-person households, comprising 12, and the most common type of nonfamily households are 1-person households, comprising 21.
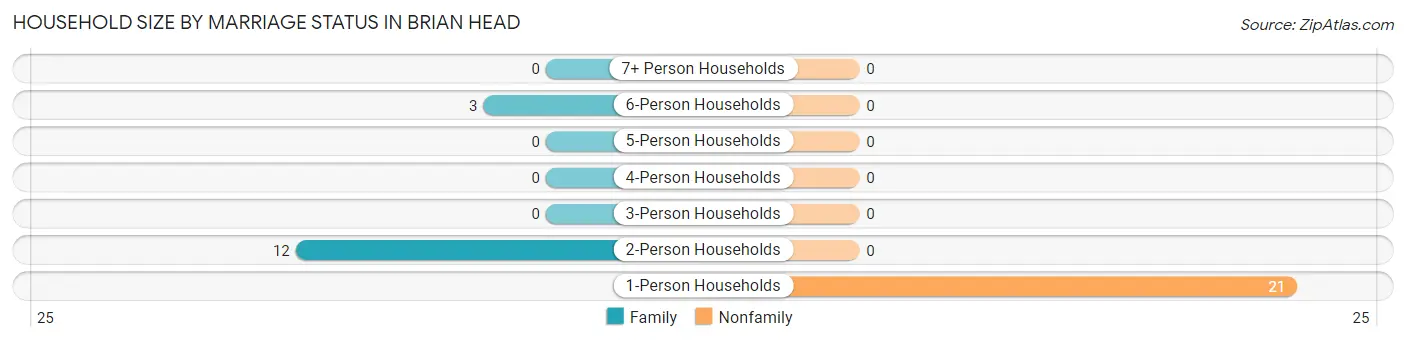
| Household Size | Family Households | Nonfamily Households |
| 1-Person Households | - | 21 (58.3%) |
| 2-Person Households | 12 (33.3%) | 0 (0.0%) |
| 3-Person Households | 0 (0.0%) | 0 (0.0%) |
| 4-Person Households | 0 (0.0%) | 0 (0.0%) |
| 5-Person Households | 0 (0.0%) | 0 (0.0%) |
| 6-Person Households | 3 (8.3%) | 0 (0.0%) |
| 7+ Person Households | 0 (0.0%) | 0 (0.0%) |
| Total | 15 (41.7%) | 21 (58.3%) |
Female Fertility in Brian Head
Fertility by Age in Brian Head
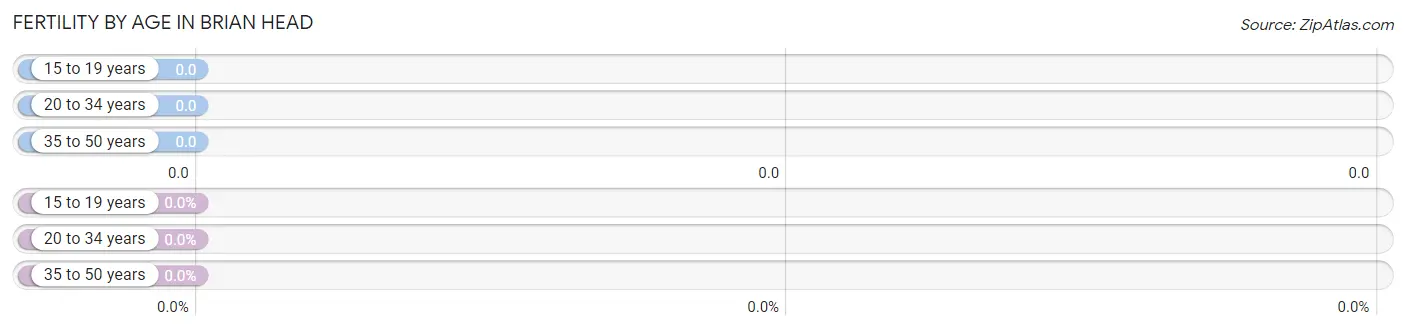
| Age Bracket | Women with Births | Births / 1,000 Women |
| 15 to 19 years | 0 (0.0%) | 0.0 |
| 20 to 34 years | 0 (0.0%) | 0.0 |
| 35 to 50 years | 0 (0.0%) | 0.0 |
| Total | 0 (0.0%) | 0.0 |
Fertility by Age by Marriage Status in Brian Head
| Age Bracket | Married | Unmarried |
| 15 to 19 years | 0 (0.0%) | 0 (0.0%) |
| 20 to 34 years | 0 (0.0%) | 0 (0.0%) |
| 35 to 50 years | 0 (0.0%) | 0 (0.0%) |
| Total | 0 (0.0%) | 0 (0.0%) |
Fertility by Education in Brian Head
| Educational Attainment | Women with Births | Births / 1,000 Women |
| Less than High School | 0 (0.0%) | 0.0 |
| High School Diploma | 0 (0.0%) | 0.0 |
| College or Associate's Degree | 0 (0.0%) | 0.0 |
| Bachelor's Degree | 0 (0.0%) | 0.0 |
| Graduate Degree | 0 (0.0%) | 0.0 |
| Total | 0 (0.0%) | 0.0 |
Fertility by Education by Marriage Status in Brian Head
| Educational Attainment | Married | Unmarried |
| Less than High School | 0 (0.0%) | 0 (0.0%) |
| High School Diploma | 0 (0.0%) | 0 (0.0%) |
| College or Associate's Degree | 0 (0.0%) | 0 (0.0%) |
| Bachelor's Degree | 0 (0.0%) | 0 (0.0%) |
| Graduate Degree | 0 (0.0%) | 0 (0.0%) |
| Total | 0 (0.0%) | 0 (0.0%) |
Income in Brian Head
Income Overview in Brian Head
Per Capita Income in Brian Head is $36,067, while median incomes of families and households are $80,625 and $63,000 respectively.
| Characteristic | Number | Measure |
| Per Capita Income | 60 | $36,067 |
| Median Family Income | 15 | $80,625 |
| Mean Family Income | 15 | $87,100 |
| Median Household Income | 36 | $63,000 |
| Mean Household Income | 36 | $61,389 |
| Income Deficit | 15 | $0 |
| Wage / Income Gap (%) | 60 | 0.00% |
| Wage / Income Gap ($) | 60 | 100.00¢ per $1 |
| Gini / Inequality Index | 60 | 0.36 |
Earnings by Sex in Brian Head
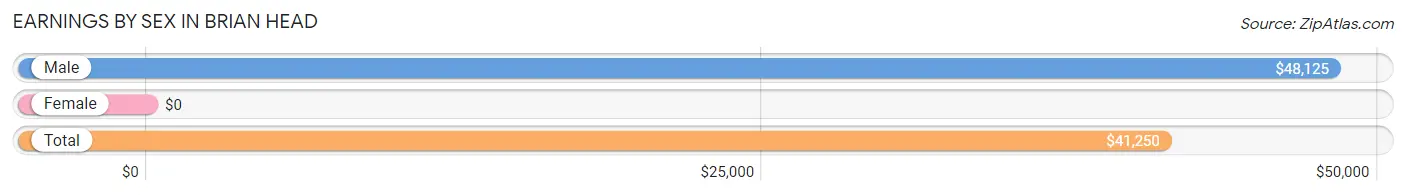
| Sex | Number | Average Earnings |
| Male | 15 (50.0%) | $48,125 |
| Female | 15 (50.0%) | $0 |
| Total | 30 (100.0%) | $41,250 |
Earnings by Sex by Income Bracket in Brian Head
The most common earnings brackets in Brian Head are $45,000 to $49,999 for men (12 | 80.0%) and $7,500 to $9,999 for women (5 | 33.3%).
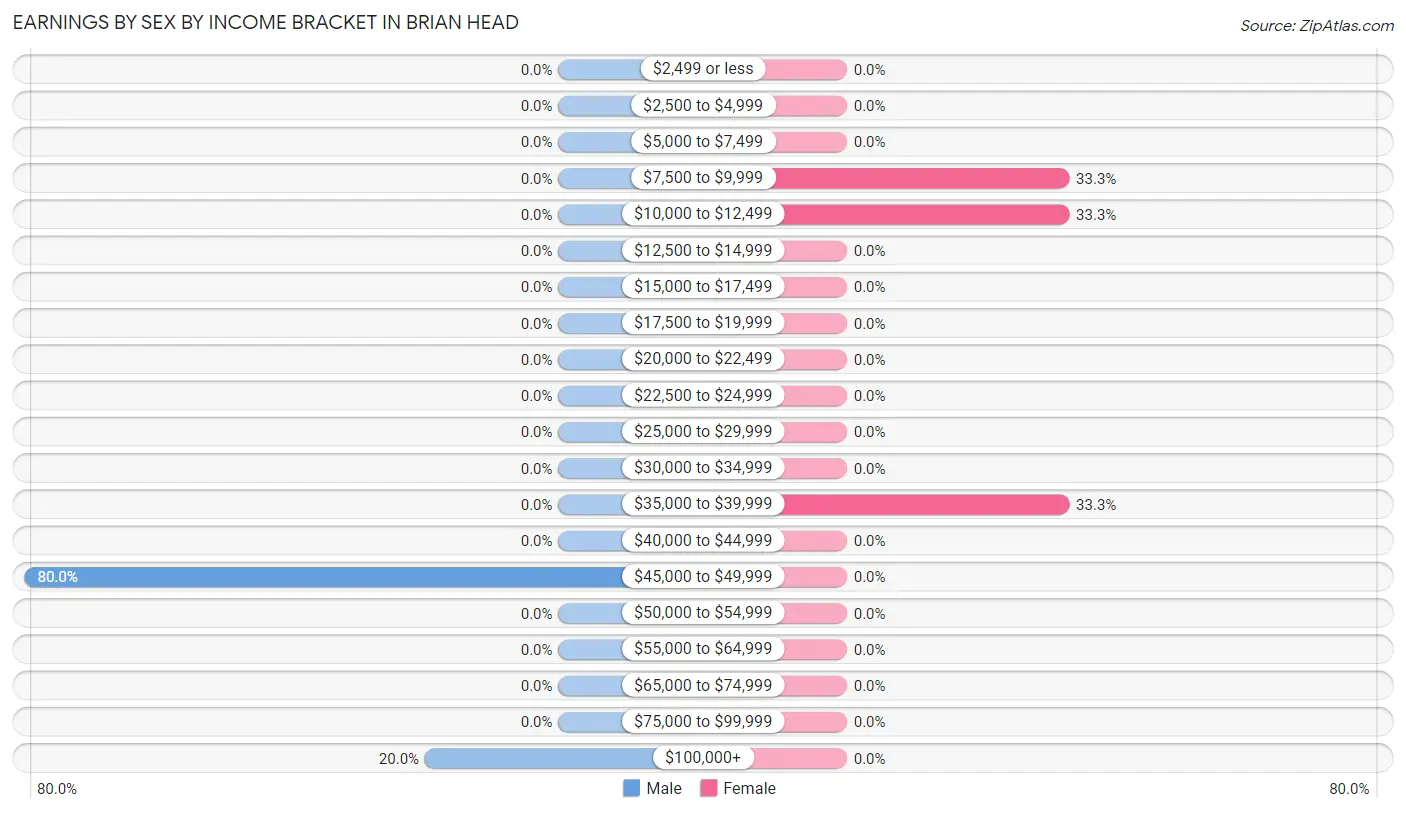
| Income | Male | Female |
| $2,499 or less | 0 (0.0%) | 0 (0.0%) |
| $2,500 to $4,999 | 0 (0.0%) | 0 (0.0%) |
| $5,000 to $7,499 | 0 (0.0%) | 0 (0.0%) |
| $7,500 to $9,999 | 0 (0.0%) | 5 (33.3%) |
| $10,000 to $12,499 | 0 (0.0%) | 5 (33.3%) |
| $12,500 to $14,999 | 0 (0.0%) | 0 (0.0%) |
| $15,000 to $17,499 | 0 (0.0%) | 0 (0.0%) |
| $17,500 to $19,999 | 0 (0.0%) | 0 (0.0%) |
| $20,000 to $22,499 | 0 (0.0%) | 0 (0.0%) |
| $22,500 to $24,999 | 0 (0.0%) | 0 (0.0%) |
| $25,000 to $29,999 | 0 (0.0%) | 0 (0.0%) |
| $30,000 to $34,999 | 0 (0.0%) | 0 (0.0%) |
| $35,000 to $39,999 | 0 (0.0%) | 5 (33.3%) |
| $40,000 to $44,999 | 0 (0.0%) | 0 (0.0%) |
| $45,000 to $49,999 | 12 (80.0%) | 0 (0.0%) |
| $50,000 to $54,999 | 0 (0.0%) | 0 (0.0%) |
| $55,000 to $64,999 | 0 (0.0%) | 0 (0.0%) |
| $65,000 to $74,999 | 0 (0.0%) | 0 (0.0%) |
| $75,000 to $99,999 | 0 (0.0%) | 0 (0.0%) |
| $100,000+ | 3 (20.0%) | 0 (0.0%) |
| Total | 15 (100.0%) | 15 (100.0%) |
Earnings by Sex by Educational Attainment in Brian Head
| Educational Attainment | Male Income | Female Income |
| Less than High School | - | - |
| High School Diploma | - | - |
| College or Associate's Degree | - | - |
| Bachelor's Degree | - | - |
| Graduate Degree | - | - |
| Total | - | - |
Family Income in Brian Head
Family Income Brackets in Brian Head
According to the Brian Head family income data, there are 6 families falling into the $50,000 to $74,999 income range, which is the most common income bracket and makes up 40.0% of all families.
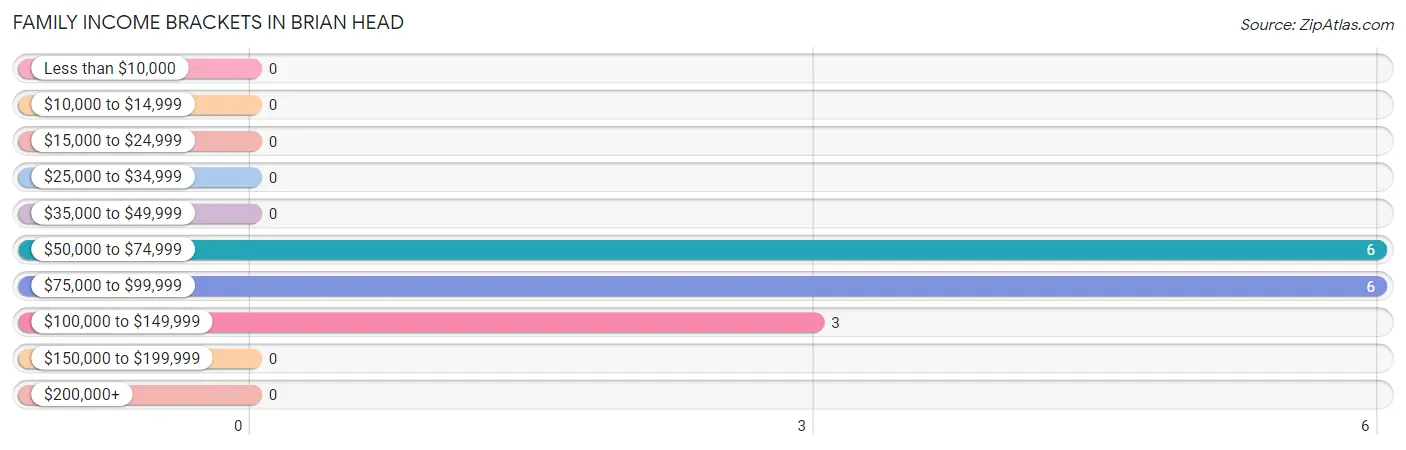
| Income Bracket | # Families | % Families |
| Less than $10,000 | 0 | 0.0% |
| $10,000 to $14,999 | 0 | 0.0% |
| $15,000 to $24,999 | 0 | 0.0% |
| $25,000 to $34,999 | 0 | 0.0% |
| $35,000 to $49,999 | 0 | 0.0% |
| $50,000 to $74,999 | 6 | 40.0% |
| $75,000 to $99,999 | 6 | 40.0% |
| $100,000 to $149,999 | 3 | 20.0% |
| $150,000 to $199,999 | 0 | 0.0% |
| $200,000+ | 0 | 0.0% |
Family Income by Famaliy Size in Brian Head
| Income Bracket | # Families | Median Income |
| 2-Person Families | 12 (80.0%) | $0 |
| 3-Person Families | 0 (0.0%) | $0 |
| 4-Person Families | 0 (0.0%) | $0 |
| 5-Person Families | 0 (0.0%) | $0 |
| 6-Person Families | 3 (20.0%) | $0 |
| 7+ Person Families | 0 (0.0%) | $0 |
| Total | 15 (100.0%) | $80,625 |
Family Income by Number of Earners in Brian Head
| Number of Earners | # Families | Median Income |
| No Earners | 0 (0.0%) | $0 |
| 1 Earner | 3 (20.0%) | $0 |
| 2 Earners | 12 (80.0%) | $0 |
| 3+ Earners | 0 (0.0%) | $0 |
| Total | 15 (100.0%) | $80,625 |
Household Income in Brian Head
Household Income Brackets in Brian Head
With 11 households falling in the category, the $50,000 to $74,999 income range is the most frequent in Brian Head, accounting for 30.6% of all households.
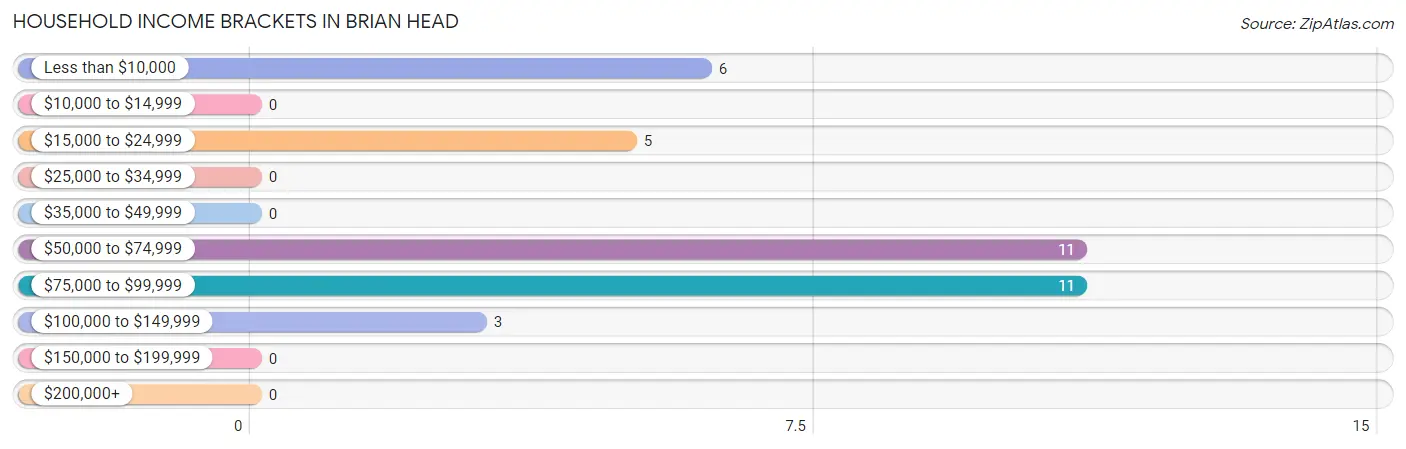
| Income Bracket | # Households | % Households |
| Less than $10,000 | 6 | 16.7% |
| $10,000 to $14,999 | 0 | 0.0% |
| $15,000 to $24,999 | 5 | 13.9% |
| $25,000 to $34,999 | 0 | 0.0% |
| $35,000 to $49,999 | 0 | 0.0% |
| $50,000 to $74,999 | 11 | 30.6% |
| $75,000 to $99,999 | 11 | 30.6% |
| $100,000 to $149,999 | 3 | 8.3% |
| $150,000 to $199,999 | 0 | 0.0% |
| $200,000+ | 0 | 0.0% |
Household Income by Householder Age in Brian Head
| Income Bracket | # Households | Median Income |
| 15 to 24 Years | 6 (16.7%) | $0 |
| 25 to 44 Years | 3 (8.3%) | $0 |
| 45 to 64 Years | 11 (30.6%) | $0 |
| 65+ Years | 16 (44.4%) | $0 |
| Total | 36 (100.0%) | $63,000 |
Poverty in Brian Head
Income Below Poverty by Sex and Age in Brian Head
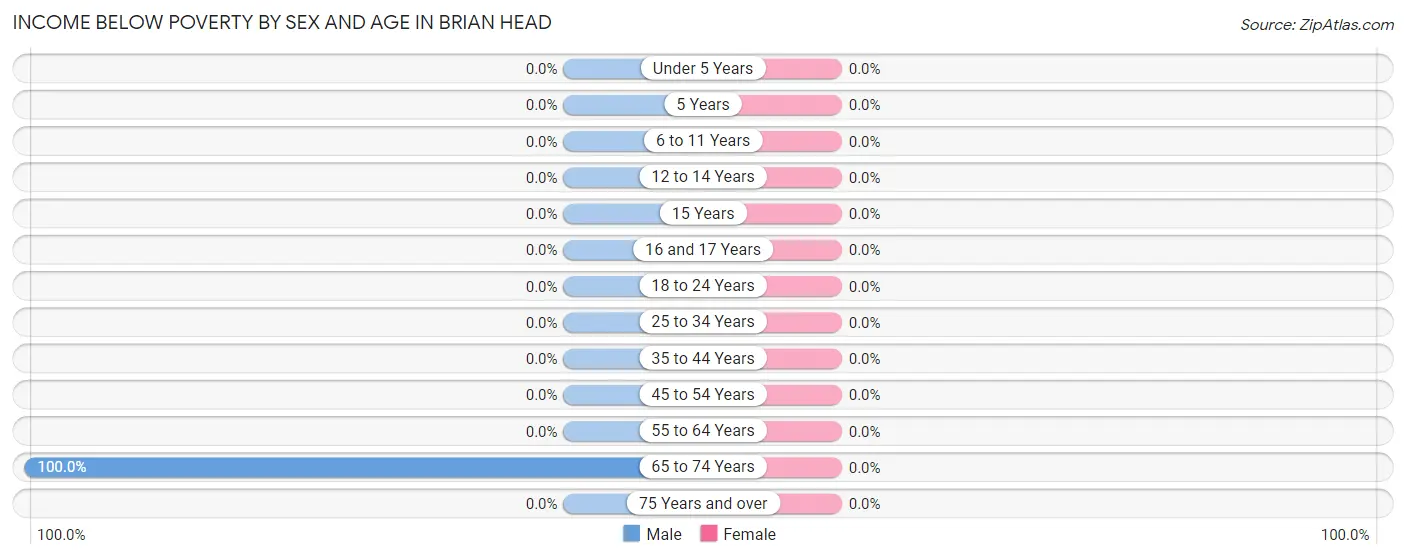
| Age Bracket | Male | Female |
| Under 5 Years | 0 (0.0%) | 0 (0.0%) |
| 5 Years | 0 (0.0%) | 0 (0.0%) |
| 6 to 11 Years | 0 (0.0%) | 0 (0.0%) |
| 12 to 14 Years | 0 (0.0%) | 0 (0.0%) |
| 15 Years | 0 (0.0%) | 0 (0.0%) |
| 16 and 17 Years | 0 (0.0%) | 0 (0.0%) |
| 18 to 24 Years | 0 (0.0%) | 0 (0.0%) |
| 25 to 34 Years | 0 (0.0%) | 0 (0.0%) |
| 35 to 44 Years | 0 (0.0%) | 0 (0.0%) |
| 45 to 54 Years | 0 (0.0%) | 0 (0.0%) |
| 55 to 64 Years | 0 (0.0%) | 0 (0.0%) |
| 65 to 74 Years | 6 (100.0%) | 0 (0.0%) |
| 75 Years and over | 0 (0.0%) | 0 (0.0%) |
| Total | 6 (16.7%) | 0 (0.0%) |
Income Above Poverty by Sex and Age in Brian Head
According to the poverty statistics in Brian Head, males aged 12 to 14 years and females aged 6 to 11 years are the age groups that are most secure financially, with 100.0% of males and 100.0% of females in these age groups living above the poverty line.
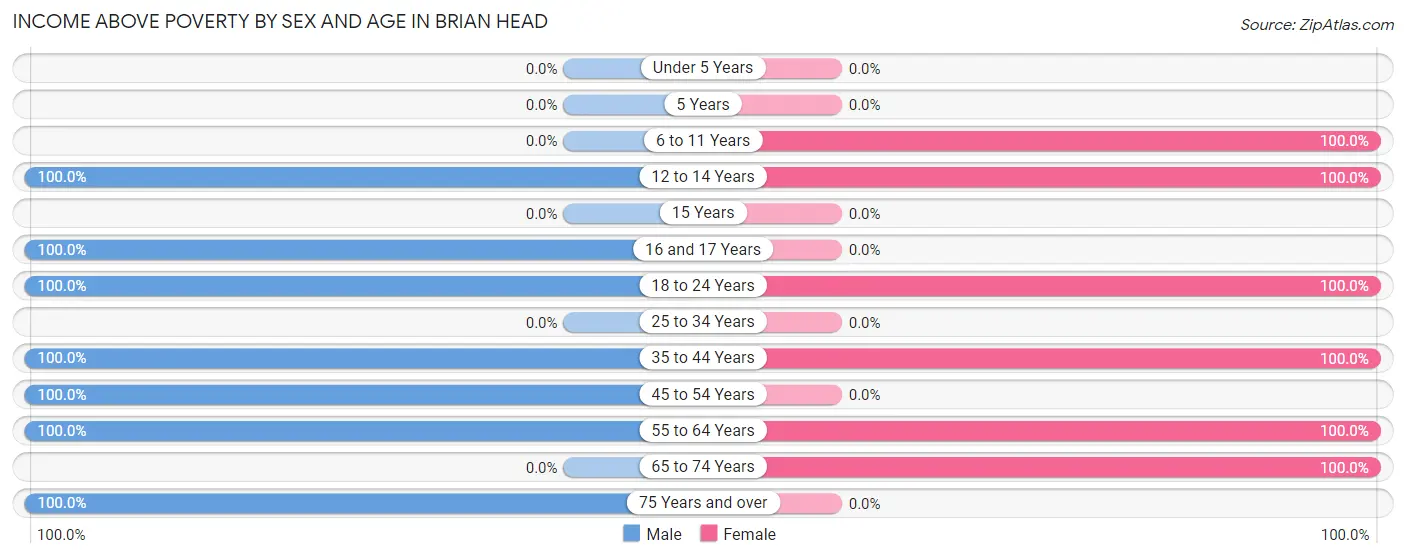
| Age Bracket | Male | Female |
| Under 5 Years | 0 (0.0%) | 0 (0.0%) |
| 5 Years | 0 (0.0%) | 0 (0.0%) |
| 6 to 11 Years | 0 (0.0%) | 3 (100.0%) |
| 12 to 14 Years | 2 (100.0%) | 3 (100.0%) |
| 15 Years | 0 (0.0%) | 0 (0.0%) |
| 16 and 17 Years | 3 (100.0%) | 0 (0.0%) |
| 18 to 24 Years | 6 (100.0%) | 5 (100.0%) |
| 25 to 34 Years | 0 (0.0%) | 0 (0.0%) |
| 35 to 44 Years | 3 (100.0%) | 3 (100.0%) |
| 45 to 54 Years | 5 (100.0%) | 0 (0.0%) |
| 55 to 64 Years | 6 (100.0%) | 5 (100.0%) |
| 65 to 74 Years | 0 (0.0%) | 5 (100.0%) |
| 75 Years and over | 5 (100.0%) | 0 (0.0%) |
| Total | 30 (83.3%) | 24 (100.0%) |
Income Below Poverty Among Married-Couple Families in Brian Head
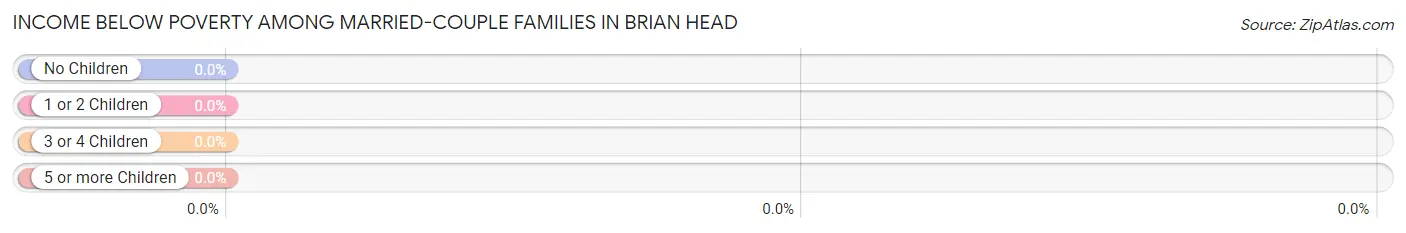
| Children | Above Poverty | Below Poverty |
| No Children | 12 (100.0%) | 0 (0.0%) |
| 1 or 2 Children | 0 (0.0%) | 0 (0.0%) |
| 3 or 4 Children | 3 (100.0%) | 0 (0.0%) |
| 5 or more Children | 0 (0.0%) | 0 (0.0%) |
| Total | 15 (100.0%) | 0 (0.0%) |
Income Below Poverty Among Single-Parent Households in Brian Head
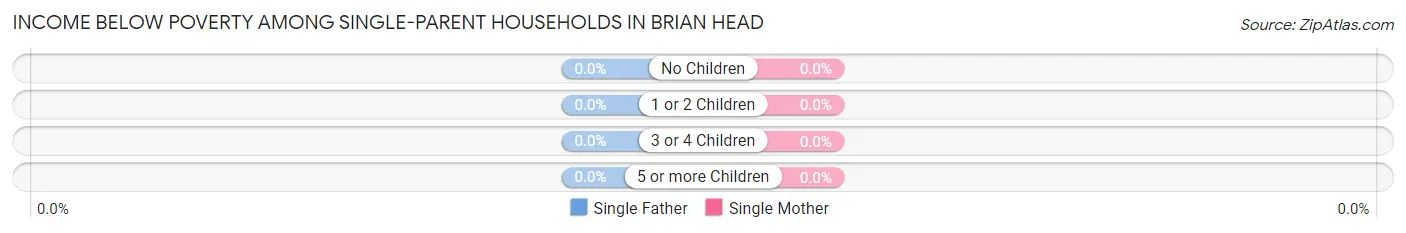
| Children | Single Father | Single Mother |
| No Children | 0 (0.0%) | 0 (0.0%) |
| 1 or 2 Children | 0 (0.0%) | 0 (0.0%) |
| 3 or 4 Children | 0 (0.0%) | 0 (0.0%) |
| 5 or more Children | 0 (0.0%) | 0 (0.0%) |
| Total | 0 (0.0%) | 0 (0.0%) |
Income Below Poverty Among Married-Couple vs Single-Parent Households in Brian Head
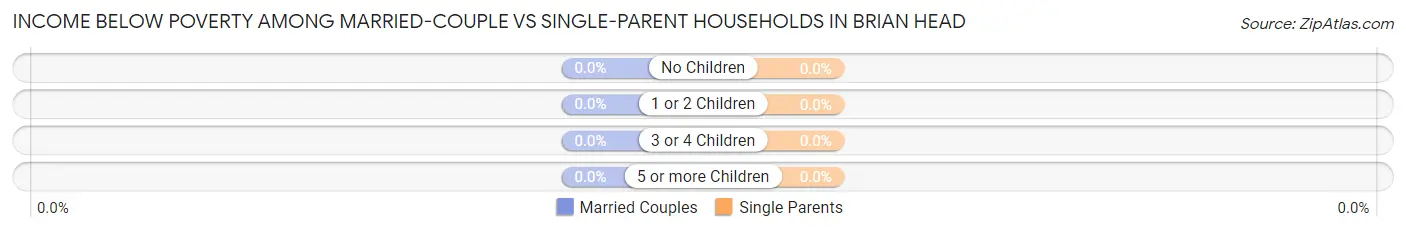
| Children | Married-Couple Families | Single-Parent Households |
| No Children | 0 (0.0%) | 0 (0.0%) |
| 1 or 2 Children | 0 (0.0%) | 0 (0.0%) |
| 3 or 4 Children | 0 (0.0%) | 0 (0.0%) |
| 5 or more Children | 0 (0.0%) | 0 (0.0%) |
| Total | 0 (0.0%) | 0 (0.0%) |
Employment Characteristics in Brian Head
Employment by Class of Employer in Brian Head
Among the 25 employed individuals in Brian Head, private company employees (14 | 56.0%), self-employed (incorporated) (6 | 24.0%), and local government employees (5 | 20.0%) make up the most common classes of employment.
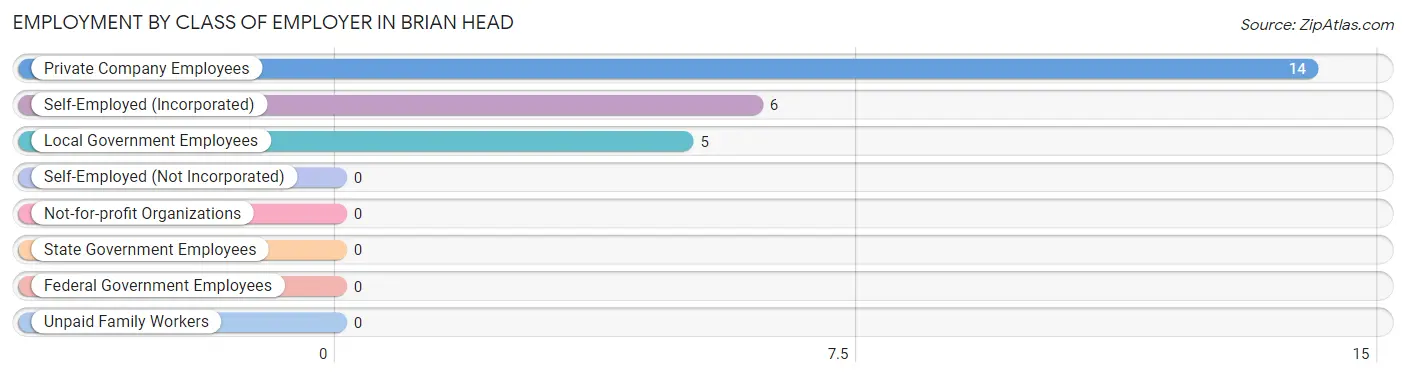
| Employer Class | # Employees | % Employees |
| Private Company Employees | 14 | 56.0% |
| Self-Employed (Incorporated) | 6 | 24.0% |
| Self-Employed (Not Incorporated) | 0 | 0.0% |
| Not-for-profit Organizations | 0 | 0.0% |
| Local Government Employees | 5 | 20.0% |
| State Government Employees | 0 | 0.0% |
| Federal Government Employees | 0 | 0.0% |
| Unpaid Family Workers | 0 | 0.0% |
| Total | 25 | 100.0% |
Employment Status by Age in Brian Head
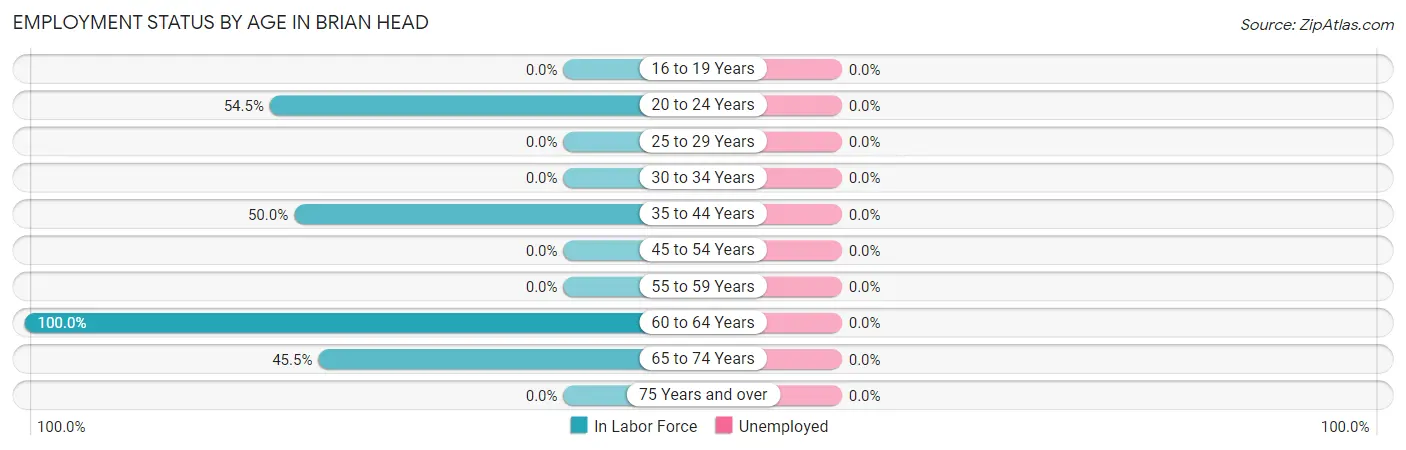
| Age Bracket | In Labor Force | Unemployed |
| 16 to 19 Years | 0 (0.0%) | 0 (0.0%) |
| 20 to 24 Years | 6 (54.5%) | 0 (0.0%) |
| 25 to 29 Years | 0 (0.0%) | 0 (0.0%) |
| 30 to 34 Years | 0 (0.0%) | 0 (0.0%) |
| 35 to 44 Years | 3 (50.0%) | 0 (0.0%) |
| 45 to 54 Years | 0 (0.0%) | 0 (0.0%) |
| 55 to 59 Years | 0 (0.0%) | 0 (0.0%) |
| 60 to 64 Years | 11 (100.0%) | 0 (0.0%) |
| 65 to 74 Years | 5 (45.5%) | 0 (0.0%) |
| 75 Years and over | 0 (0.0%) | 0 (0.0%) |
| Total | 25 (48.1%) | 0 (0.0%) |
Employment Status by Educational Attainment in Brian Head
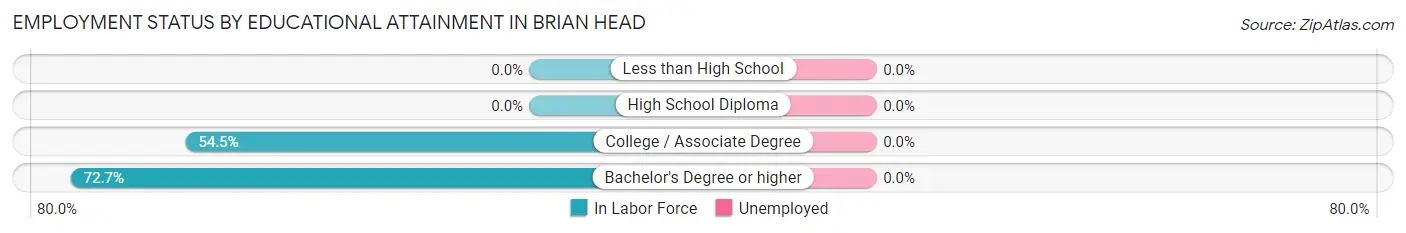
| Educational Attainment | In Labor Force | Unemployed |
| Less than High School | 0 (0.0%) | 0 (0.0%) |
| High School Diploma | 0 (0.0%) | 0 (0.0%) |
| College / Associate Degree | 6 (54.5%) | 0 (0.0%) |
| Bachelor's Degree or higher | 8 (72.7%) | 0 (0.0%) |
| Total | 14 (63.6%) | 0 (0.0%) |
Employment Occupations by Sex in Brian Head
Management, Business, Science and Arts Occupations
The most common Management, Business, Science and Arts occupations in Brian Head are Computers, Engineering & Science (6 | 24.0%), and Computers & Mathematics (6 | 24.0%).
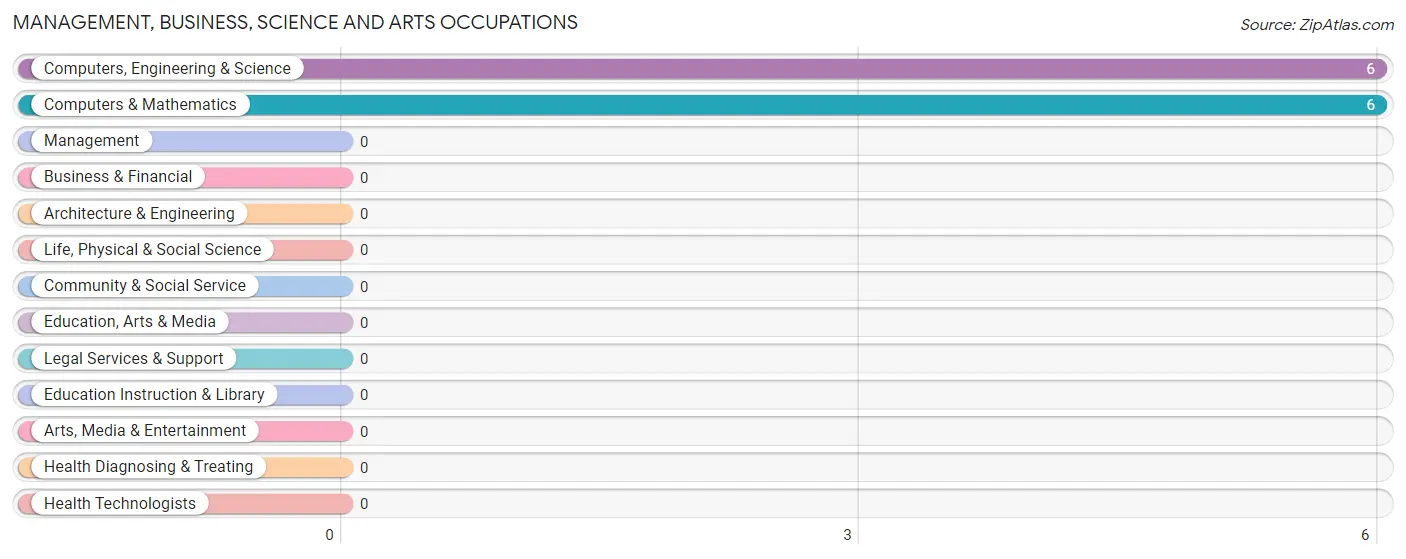
Management, Business, Science and Arts Occupations by Sex
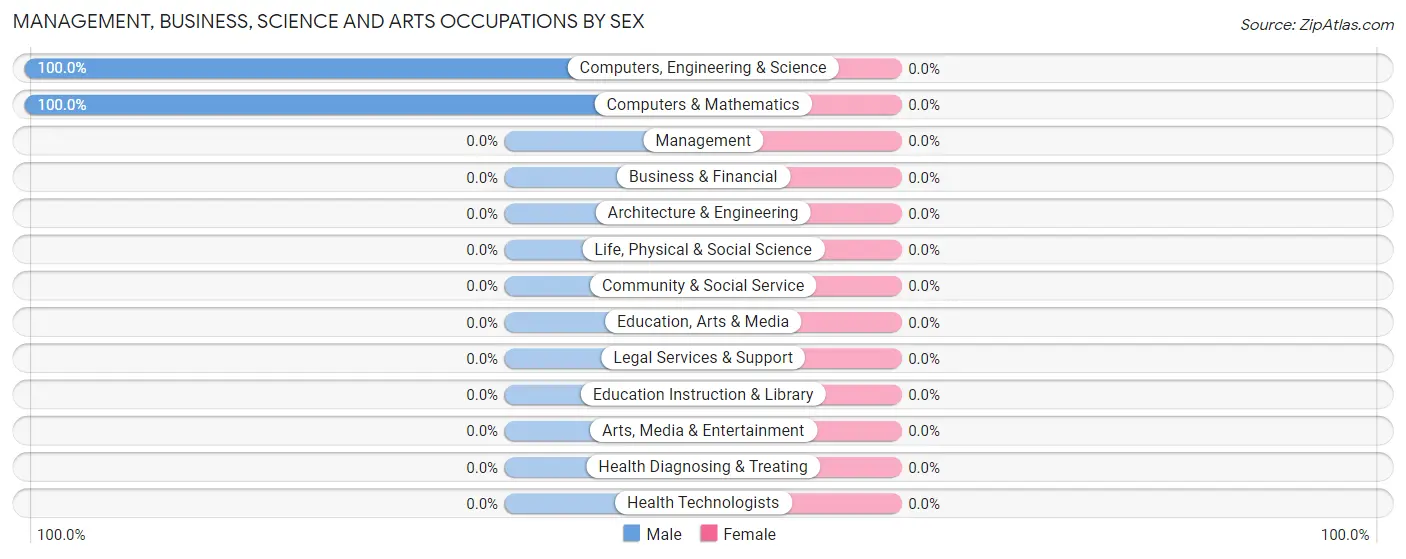
| Occupation | Male | Female |
| Management | 0 (0.0%) | 0 (0.0%) |
| Business & Financial | 0 (0.0%) | 0 (0.0%) |
| Computers, Engineering & Science | 6 (100.0%) | 0 (0.0%) |
| Computers & Mathematics | 6 (100.0%) | 0 (0.0%) |
| Architecture & Engineering | 0 (0.0%) | 0 (0.0%) |
| Life, Physical & Social Science | 0 (0.0%) | 0 (0.0%) |
| Community & Social Service | 0 (0.0%) | 0 (0.0%) |
| Education, Arts & Media | 0 (0.0%) | 0 (0.0%) |
| Legal Services & Support | 0 (0.0%) | 0 (0.0%) |
| Education Instruction & Library | 0 (0.0%) | 0 (0.0%) |
| Arts, Media & Entertainment | 0 (0.0%) | 0 (0.0%) |
| Health Diagnosing & Treating | 0 (0.0%) | 0 (0.0%) |
| Health Technologists | 0 (0.0%) | 0 (0.0%) |
| Total (Category) | 6 (100.0%) | 0 (0.0%) |
| Total (Overall) | 15 (60.0%) | 10 (40.0%) |
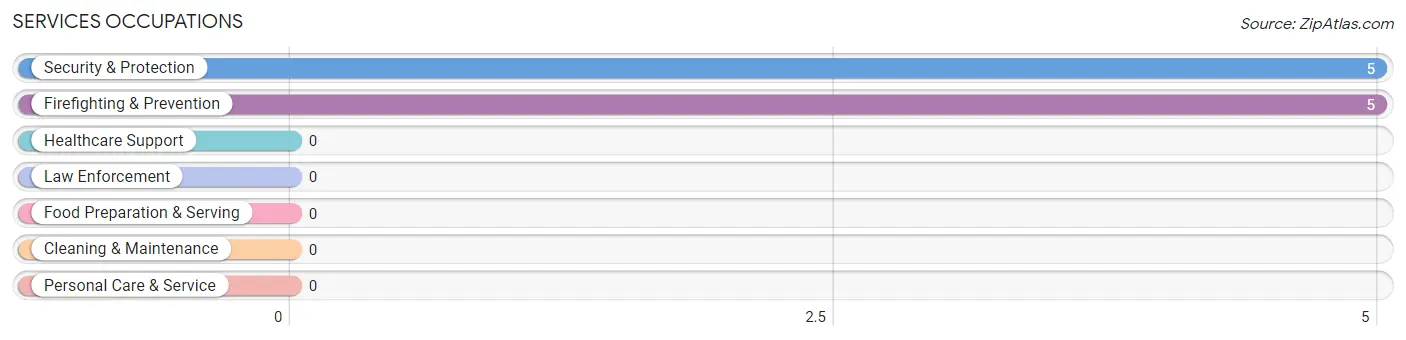
Services Occupations
The most common Services occupations in Brian Head are Security & Protection (5 | 20.0%), and Firefighting & Prevention (5 | 20.0%).
Services Occupations by Sex
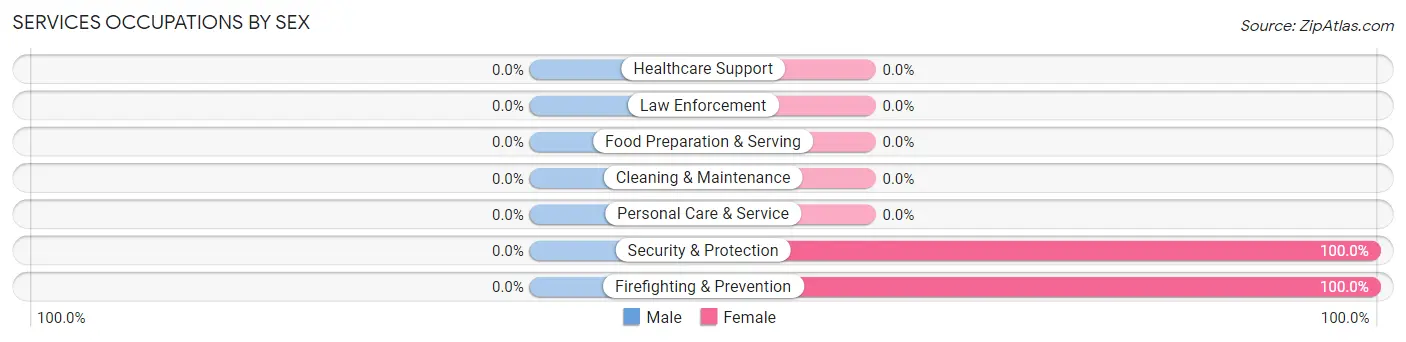
| Occupation | Male | Female |
| Healthcare Support | 0 (0.0%) | 0 (0.0%) |
| Security & Protection | 0 (0.0%) | 5 (100.0%) |
| Firefighting & Prevention | 0 (0.0%) | 5 (100.0%) |
| Law Enforcement | 0 (0.0%) | 0 (0.0%) |
| Food Preparation & Serving | 0 (0.0%) | 0 (0.0%) |
| Cleaning & Maintenance | 0 (0.0%) | 0 (0.0%) |
| Personal Care & Service | 0 (0.0%) | 0 (0.0%) |
| Total (Category) | 0 (0.0%) | 5 (100.0%) |
| Total (Overall) | 15 (60.0%) | 10 (40.0%) |
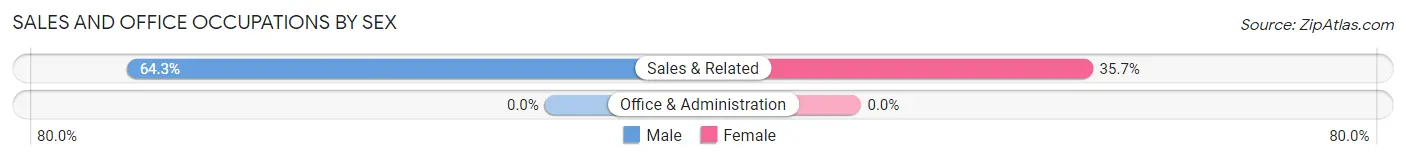
Sales and Office Occupations
The most common Sales and Office occupations in Brian Head are , and Sales & Related (14 | 56.0%).
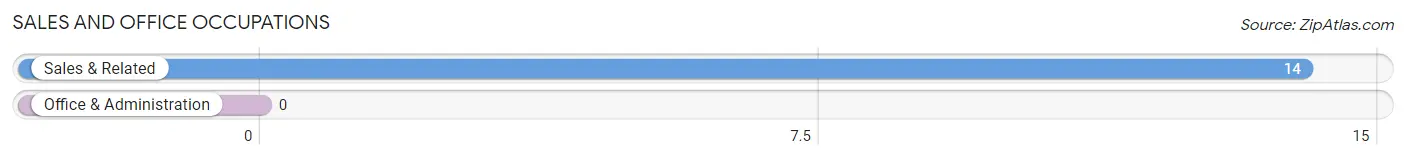
Sales and Office Occupations by Sex
| Occupation | Male | Female |
| Sales & Related | 9 (64.3%) | 5 (35.7%) |
| Office & Administration | 0 (0.0%) | 0 (0.0%) |
| Total (Category) | 9 (64.3%) | 5 (35.7%) |
| Total (Overall) | 15 (60.0%) | 10 (40.0%) |
Natural Resources, Construction and Maintenance Occupations
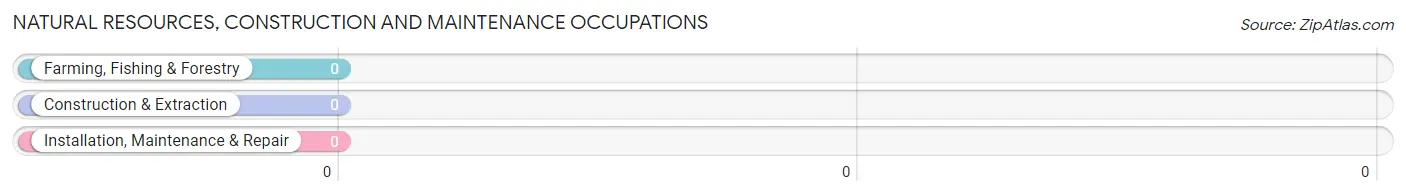
Natural Resources, Construction and Maintenance Occupations by Sex
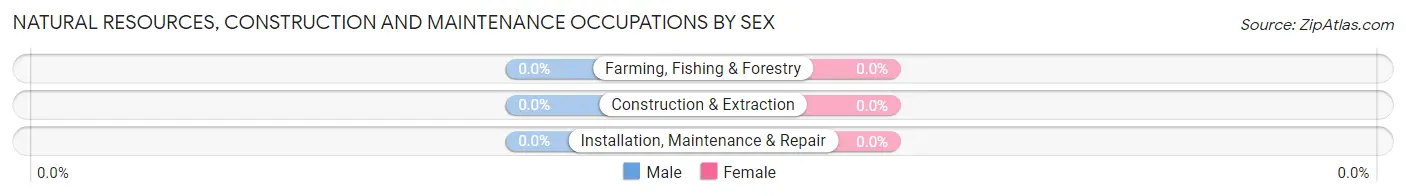
| Occupation | Male | Female |
| Farming, Fishing & Forestry | 0 (0.0%) | 0 (0.0%) |
| Construction & Extraction | 0 (0.0%) | 0 (0.0%) |
| Installation, Maintenance & Repair | 0 (0.0%) | 0 (0.0%) |
| Total (Category) | 0 (0.0%) | 0 (0.0%) |
| Total (Overall) | 15 (60.0%) | 10 (40.0%) |
Production, Transportation and Moving Occupations
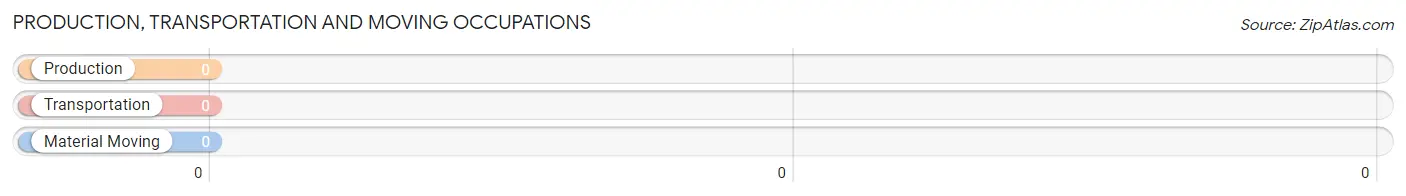
Production, Transportation and Moving Occupations by Sex
| Occupation | Male | Female |
| Production | 0 (0.0%) | 0 (0.0%) |
| Transportation | 0 (0.0%) | 0 (0.0%) |
| Material Moving | 0 (0.0%) | 0 (0.0%) |
| Total (Category) | 0 (0.0%) | 0 (0.0%) |
| Total (Overall) | 15 (60.0%) | 10 (40.0%) |
Employment Industries by Sex in Brian Head
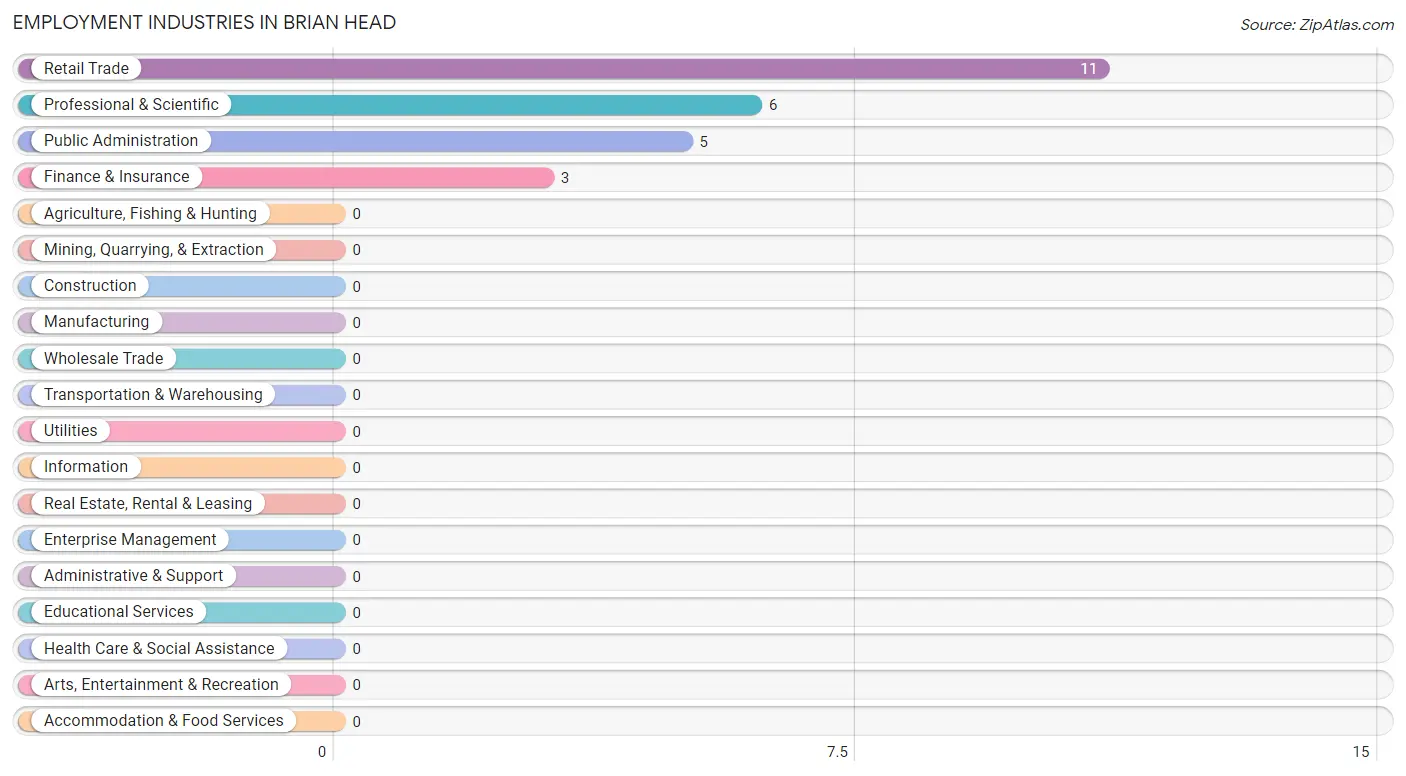
Employment Industries in Brian Head
The major employment industries in Brian Head include Retail Trade (11 | 44.0%), Professional & Scientific (6 | 24.0%), Public Administration (5 | 20.0%), and Finance & Insurance (3 | 12.0%).
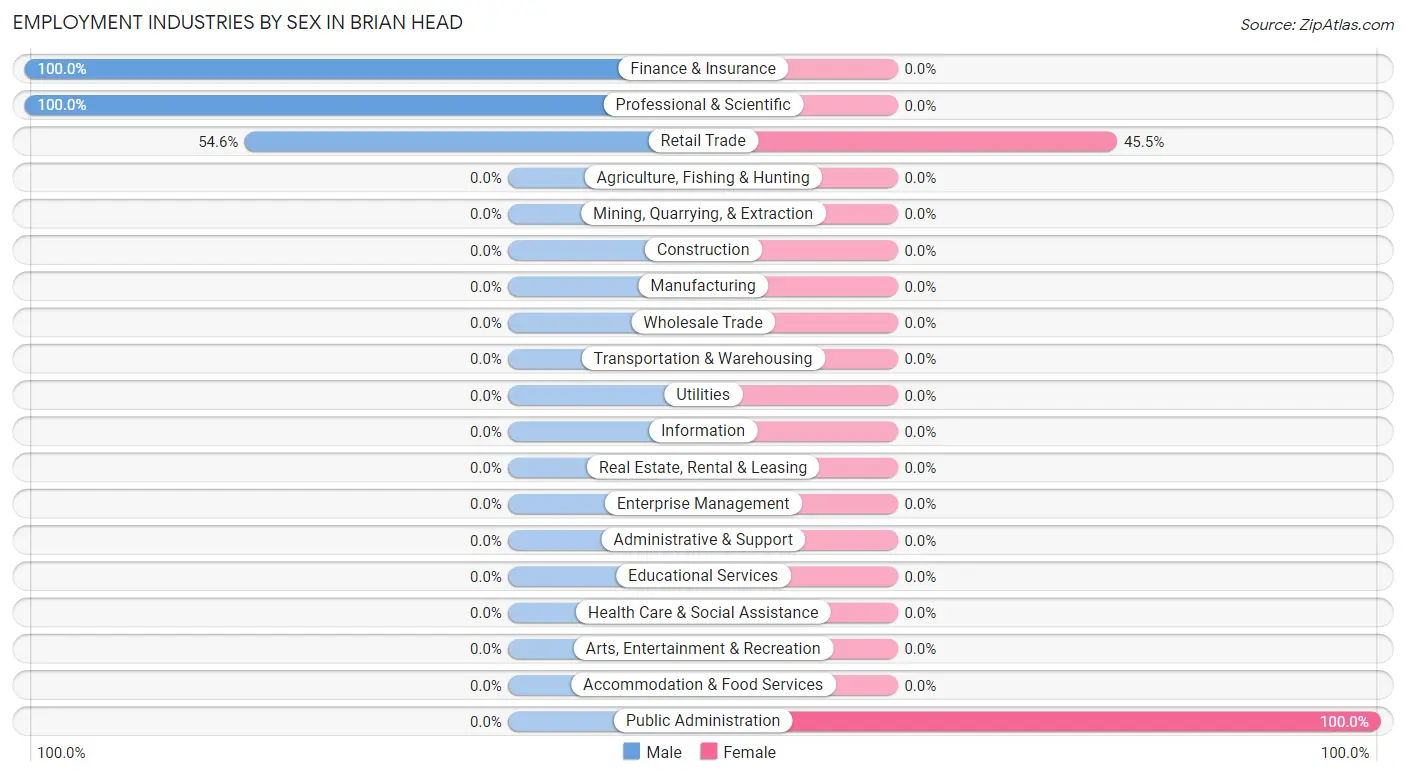
Employment Industries by Sex in Brian Head
The Brian Head industries that see more men than women are Finance & Insurance (100.0%), Professional & Scientific (100.0%), and Retail Trade (54.5%), whereas the industries that tend to have a higher number of women are Public Administration (100.0%), and Retail Trade (45.5%).
| Industry | Male | Female |
| Agriculture, Fishing & Hunting | 0 (0.0%) | 0 (0.0%) |
| Mining, Quarrying, & Extraction | 0 (0.0%) | 0 (0.0%) |
| Construction | 0 (0.0%) | 0 (0.0%) |
| Manufacturing | 0 (0.0%) | 0 (0.0%) |
| Wholesale Trade | 0 (0.0%) | 0 (0.0%) |
| Retail Trade | 6 (54.5%) | 5 (45.5%) |
| Transportation & Warehousing | 0 (0.0%) | 0 (0.0%) |
| Utilities | 0 (0.0%) | 0 (0.0%) |
| Information | 0 (0.0%) | 0 (0.0%) |
| Finance & Insurance | 3 (100.0%) | 0 (0.0%) |
| Real Estate, Rental & Leasing | 0 (0.0%) | 0 (0.0%) |
| Professional & Scientific | 6 (100.0%) | 0 (0.0%) |
| Enterprise Management | 0 (0.0%) | 0 (0.0%) |
| Administrative & Support | 0 (0.0%) | 0 (0.0%) |
| Educational Services | 0 (0.0%) | 0 (0.0%) |
| Health Care & Social Assistance | 0 (0.0%) | 0 (0.0%) |
| Arts, Entertainment & Recreation | 0 (0.0%) | 0 (0.0%) |
| Accommodation & Food Services | 0 (0.0%) | 0 (0.0%) |
| Public Administration | 0 (0.0%) | 5 (100.0%) |
| Total | 15 (60.0%) | 10 (40.0%) |
Education in Brian Head
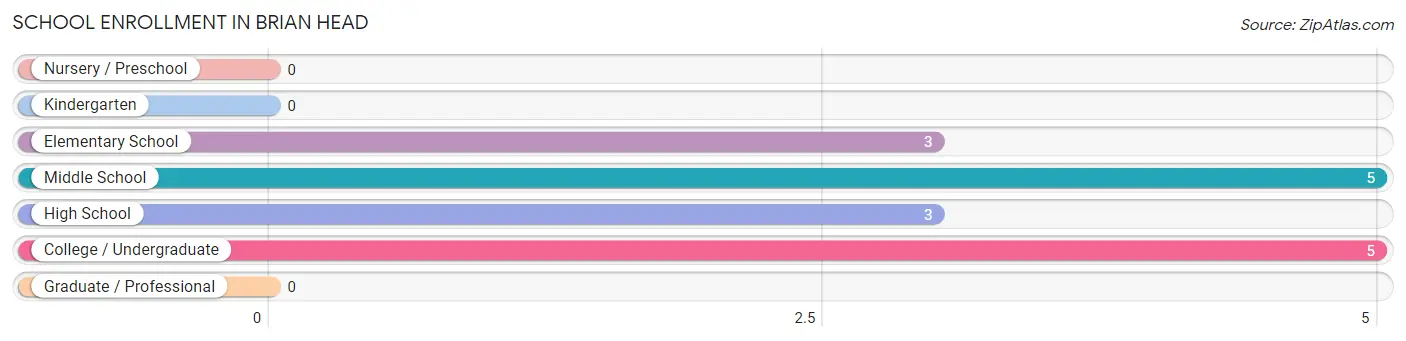
School Enrollment in Brian Head
The most common levels of schooling among the 16 students in Brian Head are middle school (5 | 31.2%), college / undergraduate (5 | 31.2%), and elementary school (3 | 18.8%).
| School Level | # Students | % Students |
| Nursery / Preschool | 0 | 0.0% |
| Kindergarten | 0 | 0.0% |
| Elementary School | 3 | 18.8% |
| Middle School | 5 | 31.2% |
| High School | 3 | 18.8% |
| College / Undergraduate | 5 | 31.2% |
| Graduate / Professional | 0 | 0.0% |
| Total | 16 | 100.0% |
School Enrollment by Age by Funding Source in Brian Head
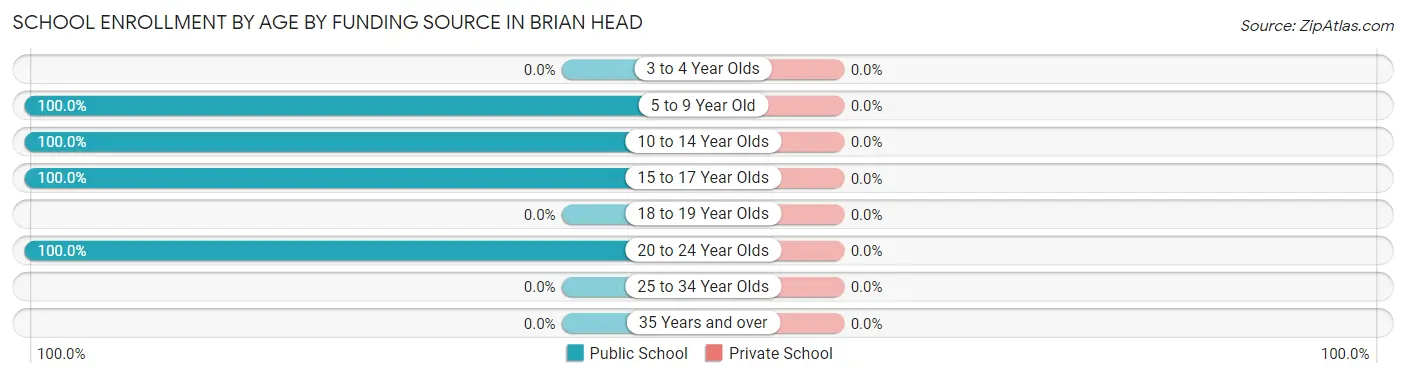
| Age Bracket | Public School | Private School |
| 3 to 4 Year Olds | 0 (0.0%) | 0 (0.0%) |
| 5 to 9 Year Old | 3 (100.0%) | 0 (0.0%) |
| 10 to 14 Year Olds | 5 (100.0%) | 0 (0.0%) |
| 15 to 17 Year Olds | 3 (100.0%) | 0 (0.0%) |
| 18 to 19 Year Olds | 0 (0.0%) | 0 (0.0%) |
| 20 to 24 Year Olds | 5 (100.0%) | 0 (0.0%) |
| 25 to 34 Year Olds | 0 (0.0%) | 0 (0.0%) |
| 35 Years and over | 0 (0.0%) | 0 (0.0%) |
| Total | 16 (100.0%) | 0 (0.0%) |
Educational Attainment by Field of Study in Brian Head
Bio, nature & agricultural (10 | 45.5%), science & technology (6 | 27.3%), social sciences (3 | 13.6%), and liberal arts & history (3 | 13.6%) are the most common fields of study among 22 individuals in Brian Head who have obtained a bachelor's degree or higher.
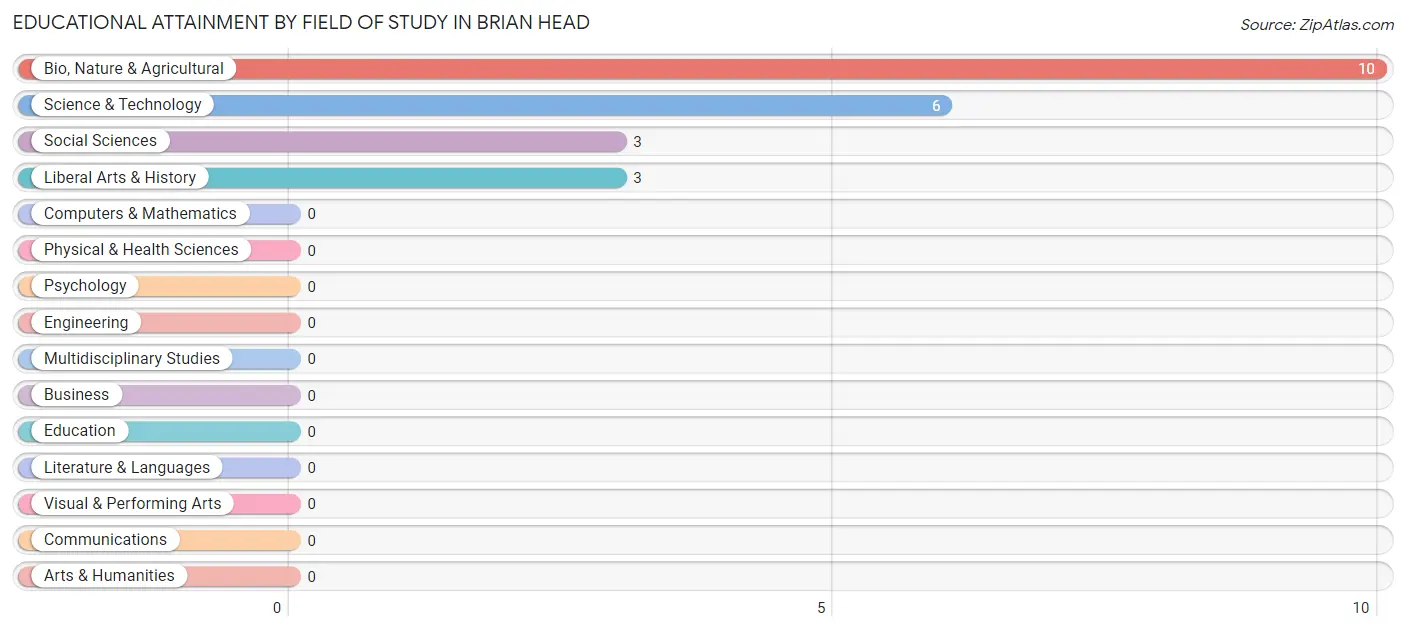
| Field of Study | # Graduates | % Graduates |
| Computers & Mathematics | 0 | 0.0% |
| Bio, Nature & Agricultural | 10 | 45.5% |
| Physical & Health Sciences | 0 | 0.0% |
| Psychology | 0 | 0.0% |
| Social Sciences | 3 | 13.6% |
| Engineering | 0 | 0.0% |
| Multidisciplinary Studies | 0 | 0.0% |
| Science & Technology | 6 | 27.3% |
| Business | 0 | 0.0% |
| Education | 0 | 0.0% |
| Literature & Languages | 0 | 0.0% |
| Liberal Arts & History | 3 | 13.6% |
| Visual & Performing Arts | 0 | 0.0% |
| Communications | 0 | 0.0% |
| Arts & Humanities | 0 | 0.0% |
| Total | 22 | 100.0% |
Transportation & Commute in Brian Head
Vehicle Availability by Sex in Brian Head
The most prevalent vehicle ownership categories in Brian Head are males with 3 vehicles (9, accounting for 60.0%) and females with 3 vehicles (0, making up 90.0%).
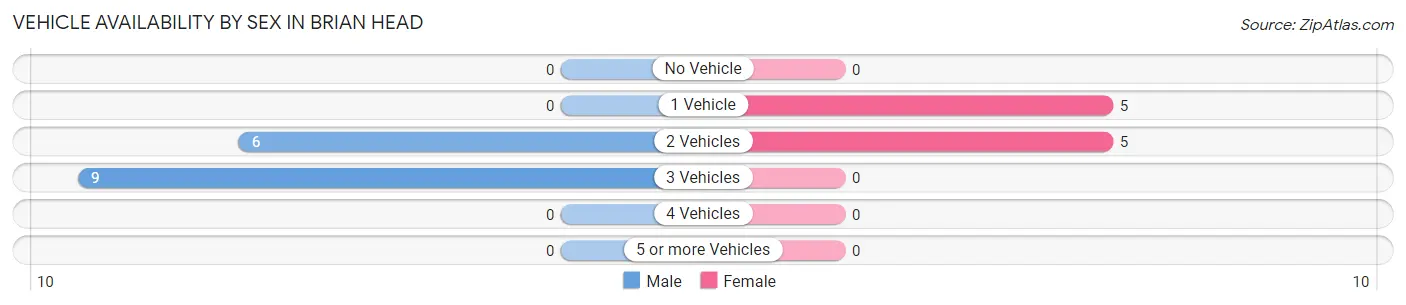
| Vehicles Available | Male | Female |
| No Vehicle | 0 (0.0%) | 0 (0.0%) |
| 1 Vehicle | 0 (0.0%) | 5 (50.0%) |
| 2 Vehicles | 6 (40.0%) | 5 (50.0%) |
| 3 Vehicles | 9 (60.0%) | 0 (0.0%) |
| 4 Vehicles | 0 (0.0%) | 0 (0.0%) |
| 5 or more Vehicles | 0 (0.0%) | 0 (0.0%) |
| Total | 15 (100.0%) | 10 (100.0%) |
Commute Time in Brian Head
The most frequently occuring commute durations in Brian Head are 15 to 19 minutes (6 commuters, 42.9%), 10 to 14 minutes (5 commuters, 35.7%), and 30 to 34 minutes (3 commuters, 21.4%).
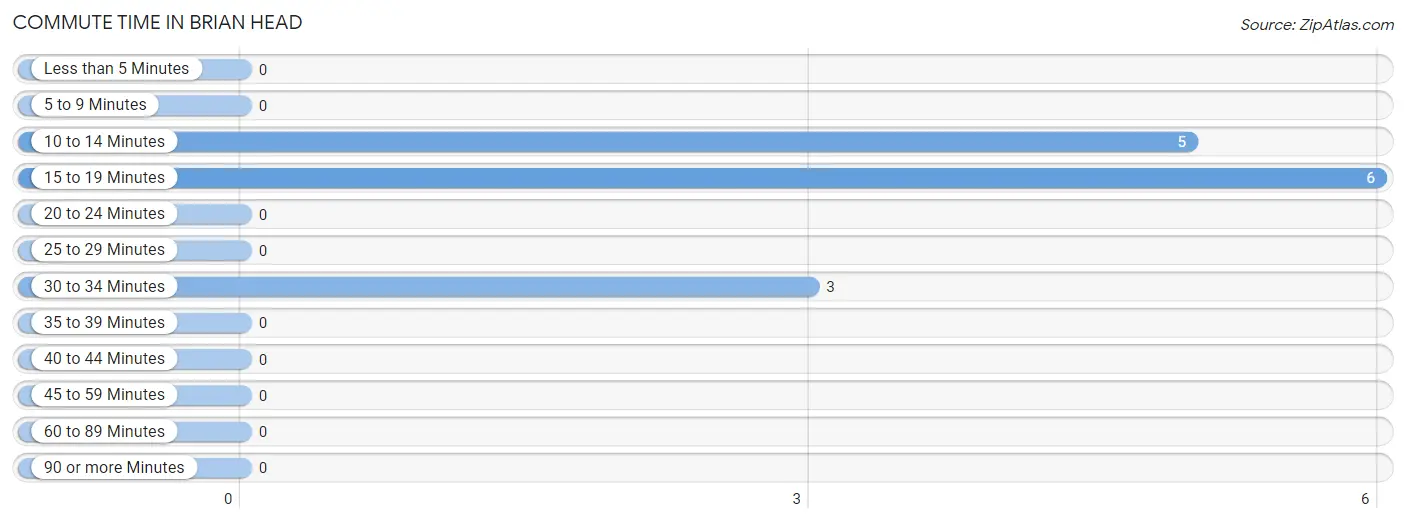
| Commute Time | # Commuters | % Commuters |
| Less than 5 Minutes | 0 | 0.0% |
| 5 to 9 Minutes | 0 | 0.0% |
| 10 to 14 Minutes | 5 | 35.7% |
| 15 to 19 Minutes | 6 | 42.9% |
| 20 to 24 Minutes | 0 | 0.0% |
| 25 to 29 Minutes | 0 | 0.0% |
| 30 to 34 Minutes | 3 | 21.4% |
| 35 to 39 Minutes | 0 | 0.0% |
| 40 to 44 Minutes | 0 | 0.0% |
| 45 to 59 Minutes | 0 | 0.0% |
| 60 to 89 Minutes | 0 | 0.0% |
| 90 or more Minutes | 0 | 0.0% |
Commute Time by Sex in Brian Head
The most common commute times in Brian Head are 15 to 19 minutes (6 commuters, 66.7%) for males and 10 to 14 minutes (5 commuters, 100.0%) for females.
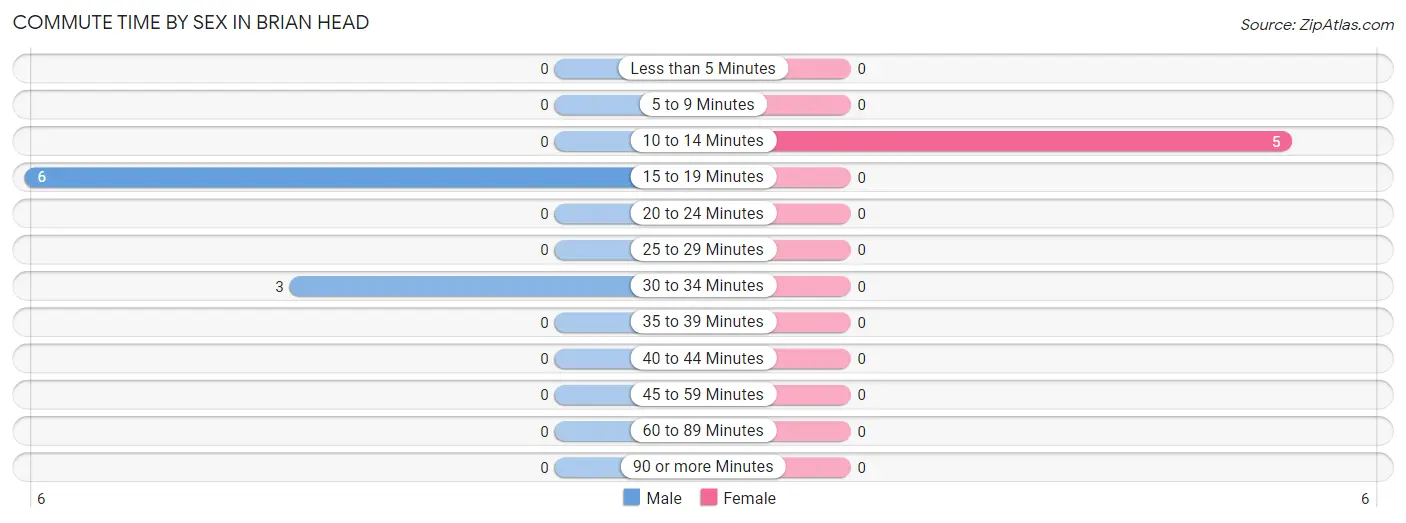
| Commute Time | Male | Female |
| Less than 5 Minutes | 0 (0.0%) | 0 (0.0%) |
| 5 to 9 Minutes | 0 (0.0%) | 0 (0.0%) |
| 10 to 14 Minutes | 0 (0.0%) | 5 (100.0%) |
| 15 to 19 Minutes | 6 (66.7%) | 0 (0.0%) |
| 20 to 24 Minutes | 0 (0.0%) | 0 (0.0%) |
| 25 to 29 Minutes | 0 (0.0%) | 0 (0.0%) |
| 30 to 34 Minutes | 3 (33.3%) | 0 (0.0%) |
| 35 to 39 Minutes | 0 (0.0%) | 0 (0.0%) |
| 40 to 44 Minutes | 0 (0.0%) | 0 (0.0%) |
| 45 to 59 Minutes | 0 (0.0%) | 0 (0.0%) |
| 60 to 89 Minutes | 0 (0.0%) | 0 (0.0%) |
| 90 or more Minutes | 0 (0.0%) | 0 (0.0%) |
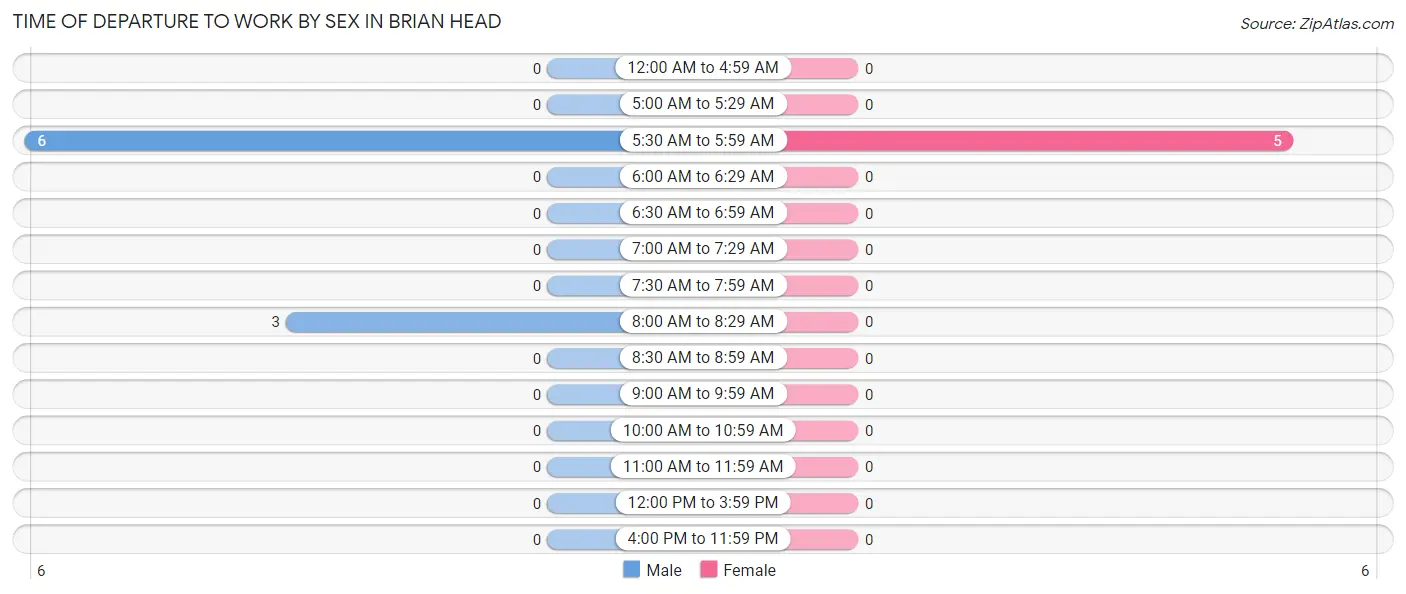
Time of Departure to Work by Sex in Brian Head
The most frequent times of departure to work in Brian Head are 5:30 AM to 5:59 AM (6, 66.7%) for males and 5:30 AM to 5:59 AM (5, 100.0%) for females.
| Time of Departure | Male | Female |
| 12:00 AM to 4:59 AM | 0 (0.0%) | 0 (0.0%) |
| 5:00 AM to 5:29 AM | 0 (0.0%) | 0 (0.0%) |
| 5:30 AM to 5:59 AM | 6 (66.7%) | 5 (100.0%) |
| 6:00 AM to 6:29 AM | 0 (0.0%) | 0 (0.0%) |
| 6:30 AM to 6:59 AM | 0 (0.0%) | 0 (0.0%) |
| 7:00 AM to 7:29 AM | 0 (0.0%) | 0 (0.0%) |
| 7:30 AM to 7:59 AM | 0 (0.0%) | 0 (0.0%) |
| 8:00 AM to 8:29 AM | 3 (33.3%) | 0 (0.0%) |
| 8:30 AM to 8:59 AM | 0 (0.0%) | 0 (0.0%) |
| 9:00 AM to 9:59 AM | 0 (0.0%) | 0 (0.0%) |
| 10:00 AM to 10:59 AM | 0 (0.0%) | 0 (0.0%) |
| 11:00 AM to 11:59 AM | 0 (0.0%) | 0 (0.0%) |
| 12:00 PM to 3:59 PM | 0 (0.0%) | 0 (0.0%) |
| 4:00 PM to 11:59 PM | 0 (0.0%) | 0 (0.0%) |
| Total | 9 (100.0%) | 5 (100.0%) |
Housing Occupancy in Brian Head
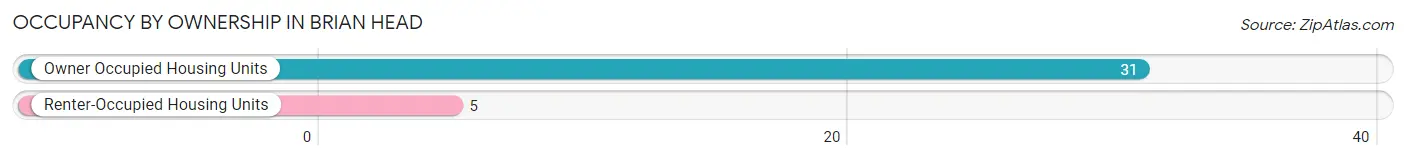
Occupancy by Ownership in Brian Head
Of the total 36 dwellings in Brian Head, owner-occupied units account for 31 (86.1%), while renter-occupied units make up 5 (13.9%).
| Occupancy | # Housing Units | % Housing Units |
| Owner Occupied Housing Units | 31 | 86.1% |
| Renter-Occupied Housing Units | 5 | 13.9% |
| Total Occupied Housing Units | 36 | 100.0% |
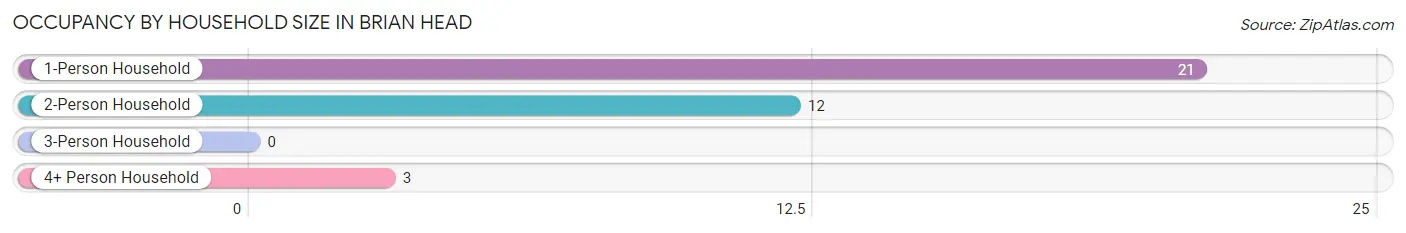
Occupancy by Household Size in Brian Head
| Household Size | # Housing Units | % Housing Units |
| 1-Person Household | 21 | 58.3% |
| 2-Person Household | 12 | 33.3% |
| 3-Person Household | 0 | 0.0% |
| 4+ Person Household | 3 | 8.3% |
| Total Housing Units | 36 | 100.0% |
Occupancy by Ownership by Household Size in Brian Head
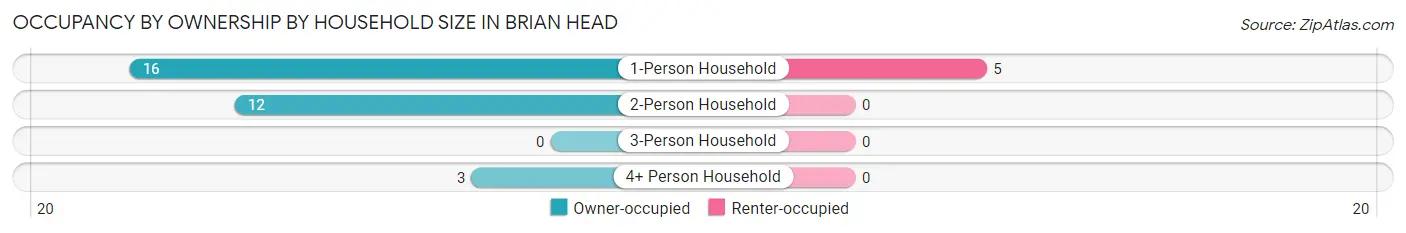
| Household Size | Owner-occupied | Renter-occupied |
| 1-Person Household | 16 (76.2%) | 5 (23.8%) |
| 2-Person Household | 12 (100.0%) | 0 (0.0%) |
| 3-Person Household | 0 (0.0%) | 0 (0.0%) |
| 4+ Person Household | 3 (100.0%) | 0 (0.0%) |
| Total Housing Units | 31 (86.1%) | 5 (13.9%) |
Occupancy by Educational Attainment in Brian Head
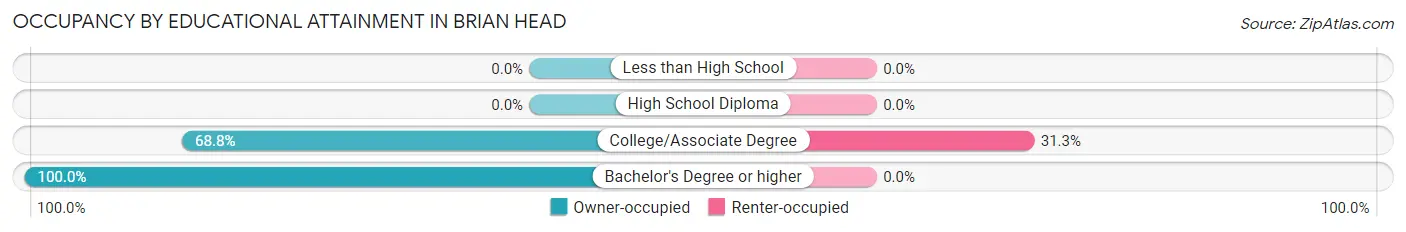
| Household Size | Owner-occupied | Renter-occupied |
| Less than High School | 0 (0.0%) | 0 (0.0%) |
| High School Diploma | 0 (0.0%) | 0 (0.0%) |
| College/Associate Degree | 11 (68.8%) | 5 (31.2%) |
| Bachelor's Degree or higher | 20 (100.0%) | 0 (0.0%) |
Occupancy by Age of Householder in Brian Head
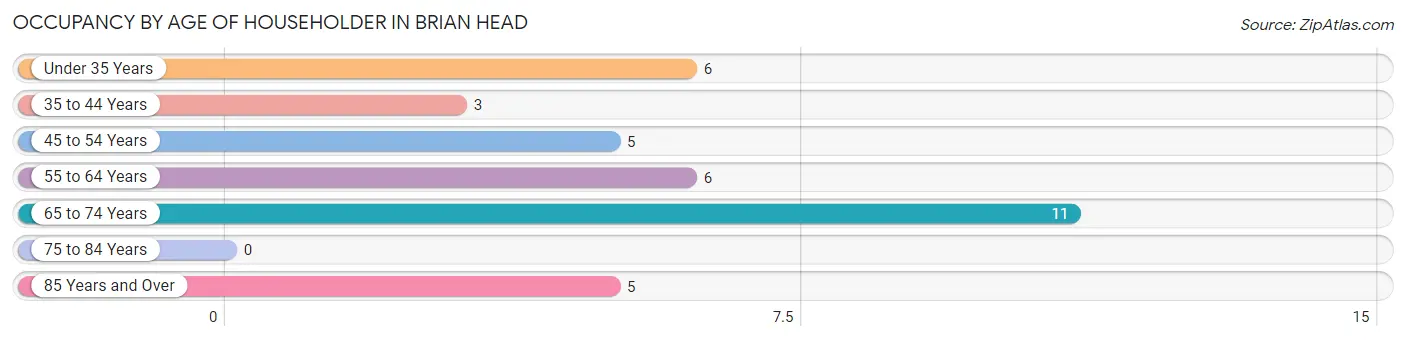
| Age Bracket | # Households | % Households |
| Under 35 Years | 6 | 16.7% |
| 35 to 44 Years | 3 | 8.3% |
| 45 to 54 Years | 5 | 13.9% |
| 55 to 64 Years | 6 | 16.7% |
| 65 to 74 Years | 11 | 30.6% |
| 75 to 84 Years | 0 | 0.0% |
| 85 Years and Over | 5 | 13.9% |
| Total | 36 | 100.0% |
Housing Finances in Brian Head
Median Income by Occupancy in Brian Head
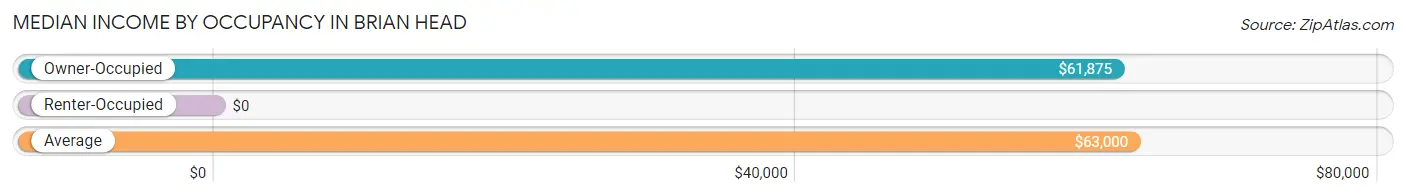
| Occupancy Type | # Households | Median Income |
| Owner-Occupied | 31 (86.1%) | $61,875 |
| Renter-Occupied | 5 (13.9%) | $0 |
| Average | 36 (100.0%) | $63,000 |
Occupancy by Householder Income Bracket in Brian Head
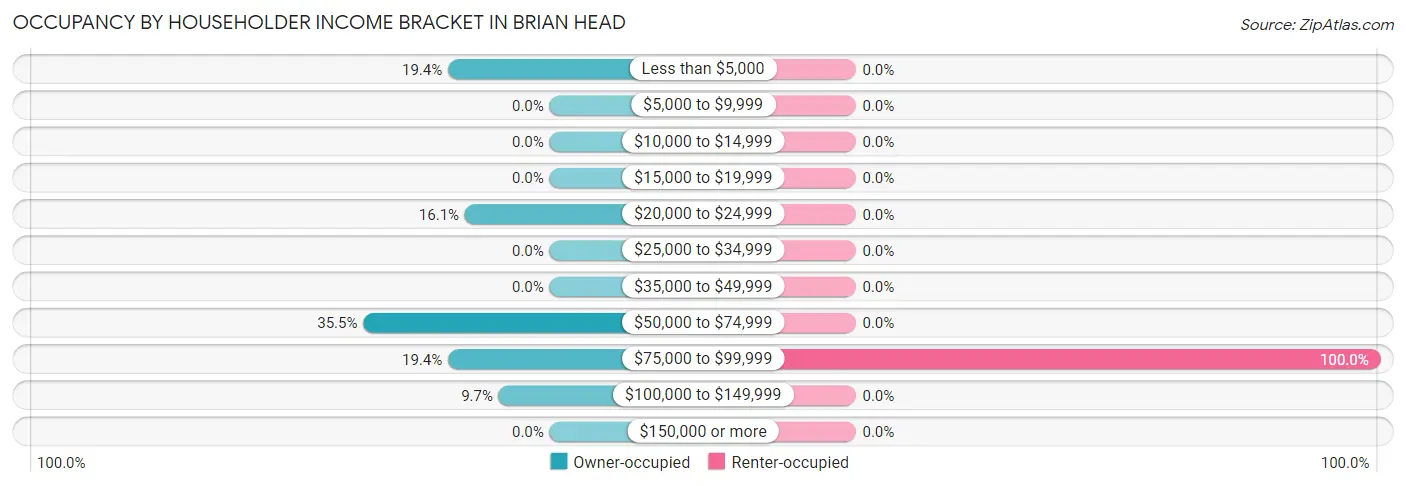
| Income Bracket | Owner-occupied | Renter-occupied |
| Less than $5,000 | 6 (19.4%) | 0 (0.0%) |
| $5,000 to $9,999 | 0 (0.0%) | 0 (0.0%) |
| $10,000 to $14,999 | 0 (0.0%) | 0 (0.0%) |
| $15,000 to $19,999 | 0 (0.0%) | 0 (0.0%) |
| $20,000 to $24,999 | 5 (16.1%) | 0 (0.0%) |
| $25,000 to $34,999 | 0 (0.0%) | 0 (0.0%) |
| $35,000 to $49,999 | 0 (0.0%) | 0 (0.0%) |
| $50,000 to $74,999 | 11 (35.5%) | 0 (0.0%) |
| $75,000 to $99,999 | 6 (19.4%) | 5 (100.0%) |
| $100,000 to $149,999 | 3 (9.7%) | 0 (0.0%) |
| $150,000 or more | 0 (0.0%) | 0 (0.0%) |
| Total | 31 (100.0%) | 5 (100.0%) |
Monthly Housing Cost Tiers in Brian Head
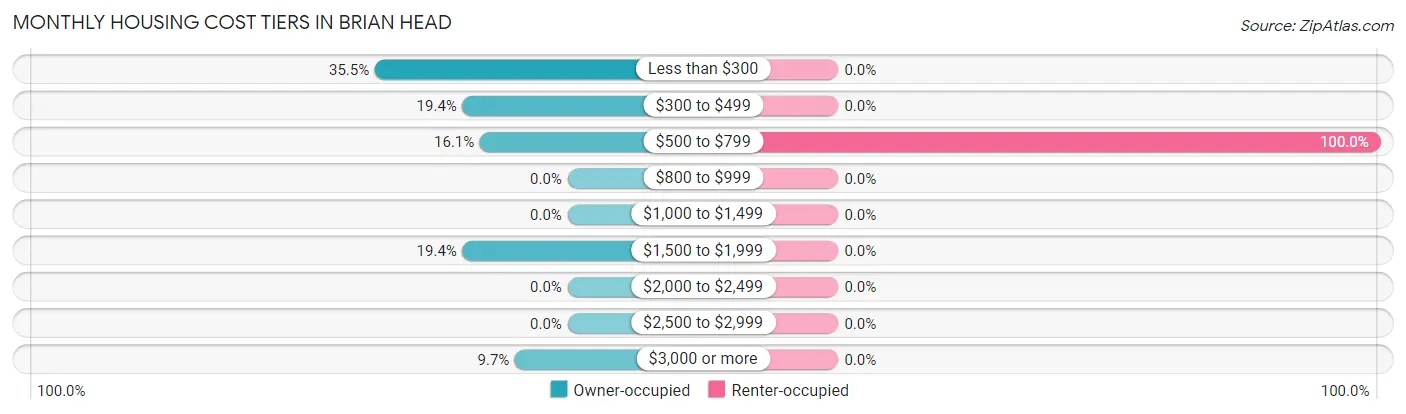
| Monthly Cost | Owner-occupied | Renter-occupied |
| Less than $300 | 11 (35.5%) | 0 (0.0%) |
| $300 to $499 | 6 (19.4%) | 0 (0.0%) |
| $500 to $799 | 5 (16.1%) | 5 (100.0%) |
| $800 to $999 | 0 (0.0%) | 0 (0.0%) |
| $1,000 to $1,499 | 0 (0.0%) | 0 (0.0%) |
| $1,500 to $1,999 | 6 (19.4%) | 0 (0.0%) |
| $2,000 to $2,499 | 0 (0.0%) | 0 (0.0%) |
| $2,500 to $2,999 | 0 (0.0%) | 0 (0.0%) |
| $3,000 or more | 3 (9.7%) | 0 (0.0%) |
| Total | 31 (100.0%) | 5 (100.0%) |
Physical Housing Characteristics in Brian Head
Housing Structures in Brian Head
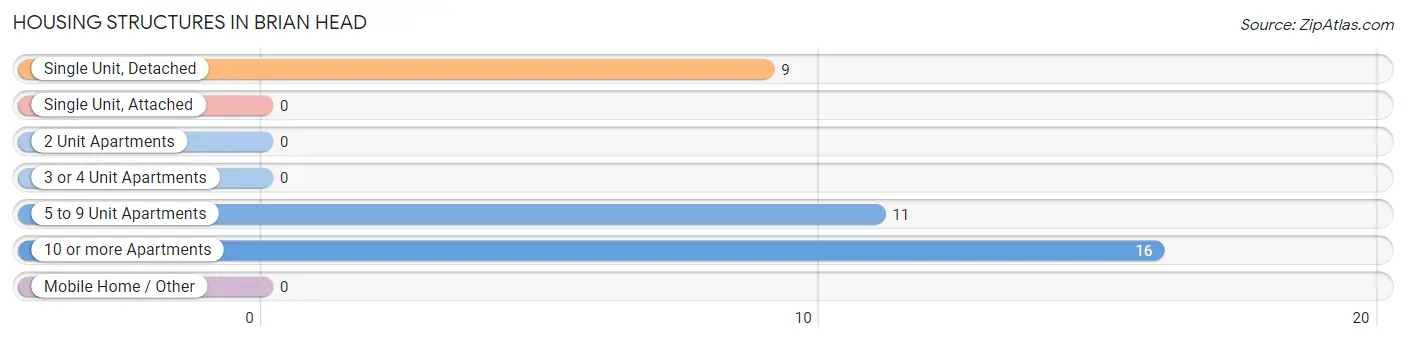
| Structure Type | # Housing Units | % Housing Units |
| Single Unit, Detached | 9 | 25.0% |
| Single Unit, Attached | 0 | 0.0% |
| 2 Unit Apartments | 0 | 0.0% |
| 3 or 4 Unit Apartments | 0 | 0.0% |
| 5 to 9 Unit Apartments | 11 | 30.6% |
| 10 or more Apartments | 16 | 44.4% |
| Mobile Home / Other | 0 | 0.0% |
| Total | 36 | 100.0% |
Housing Structures by Occupancy in Brian Head
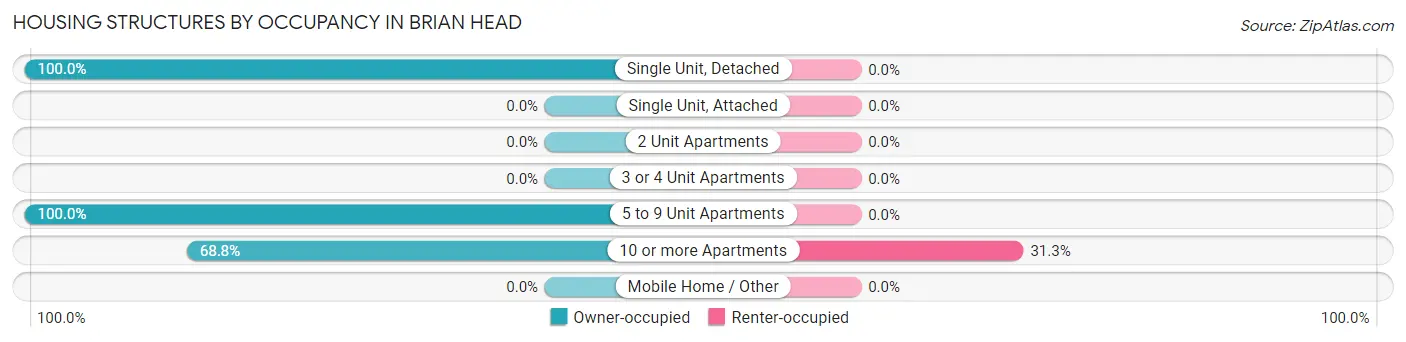
| Structure Type | Owner-occupied | Renter-occupied |
| Single Unit, Detached | 9 (100.0%) | 0 (0.0%) |
| Single Unit, Attached | 0 (0.0%) | 0 (0.0%) |
| 2 Unit Apartments | 0 (0.0%) | 0 (0.0%) |
| 3 or 4 Unit Apartments | 0 (0.0%) | 0 (0.0%) |
| 5 to 9 Unit Apartments | 11 (100.0%) | 0 (0.0%) |
| 10 or more Apartments | 11 (68.8%) | 5 (31.2%) |
| Mobile Home / Other | 0 (0.0%) | 0 (0.0%) |
| Total | 31 (86.1%) | 5 (13.9%) |
Housing Structures by Number of Rooms in Brian Head
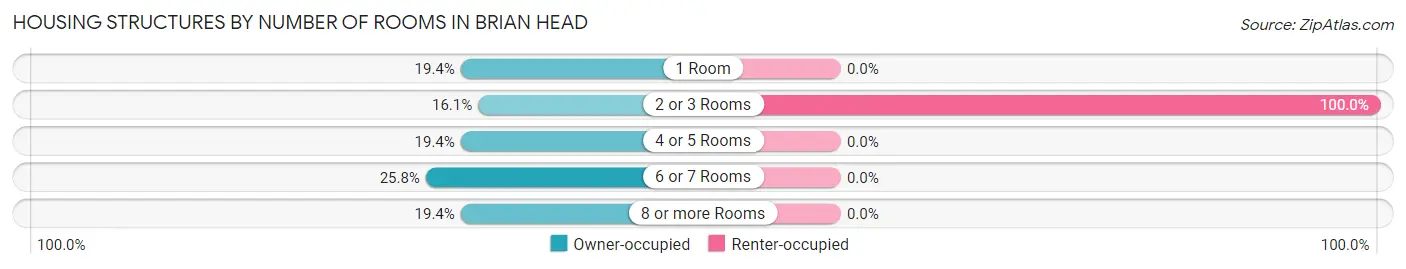
| Number of Rooms | Owner-occupied | Renter-occupied |
| 1 Room | 6 (19.4%) | 0 (0.0%) |
| 2 or 3 Rooms | 5 (16.1%) | 5 (100.0%) |
| 4 or 5 Rooms | 6 (19.4%) | 0 (0.0%) |
| 6 or 7 Rooms | 8 (25.8%) | 0 (0.0%) |
| 8 or more Rooms | 6 (19.4%) | 0 (0.0%) |
| Total | 31 (100.0%) | 5 (100.0%) |
Housing Structure by Heating Type in Brian Head
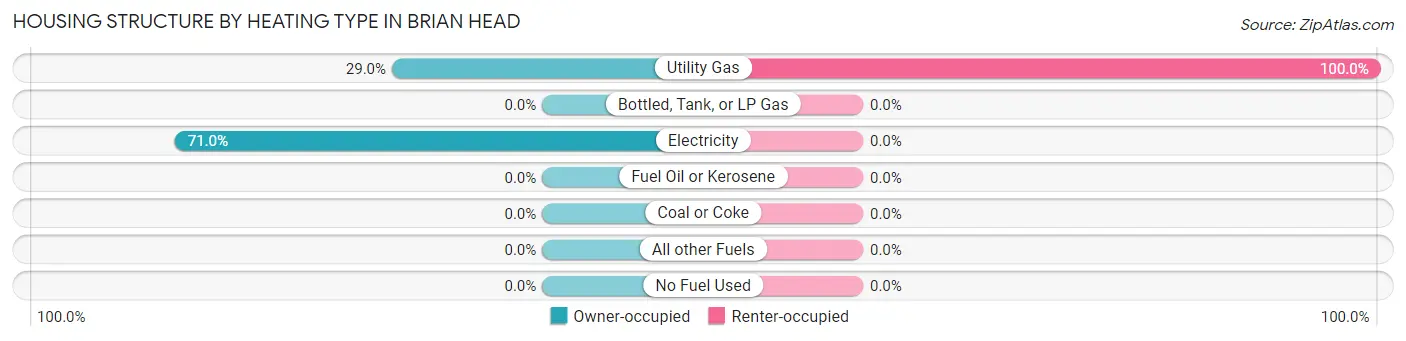
| Heating Type | Owner-occupied | Renter-occupied |
| Utility Gas | 9 (29.0%) | 5 (100.0%) |
| Bottled, Tank, or LP Gas | 0 (0.0%) | 0 (0.0%) |
| Electricity | 22 (71.0%) | 0 (0.0%) |
| Fuel Oil or Kerosene | 0 (0.0%) | 0 (0.0%) |
| Coal or Coke | 0 (0.0%) | 0 (0.0%) |
| All other Fuels | 0 (0.0%) | 0 (0.0%) |
| No Fuel Used | 0 (0.0%) | 0 (0.0%) |
| Total | 31 (100.0%) | 5 (100.0%) |
Household Vehicle Usage in Brian Head
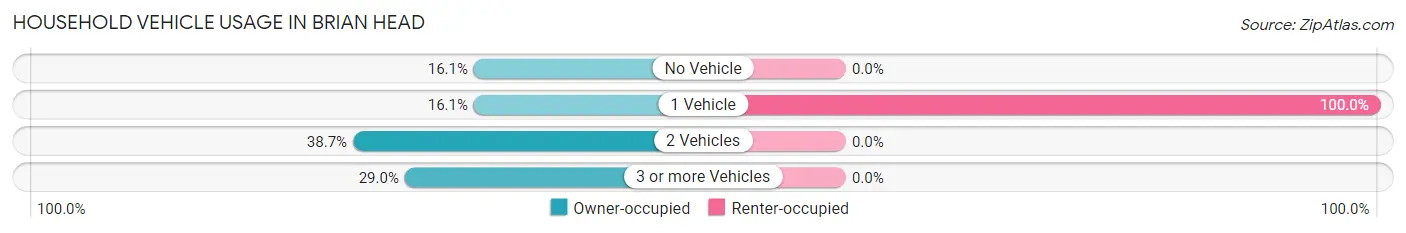
| Vehicles per Household | Owner-occupied | Renter-occupied |
| No Vehicle | 5 (16.1%) | 0 (0.0%) |
| 1 Vehicle | 5 (16.1%) | 5 (100.0%) |
| 2 Vehicles | 12 (38.7%) | 0 (0.0%) |
| 3 or more Vehicles | 9 (29.0%) | 0 (0.0%) |
| Total | 31 (100.0%) | 5 (100.0%) |
Real Estate & Mortgages in Brian Head
Real Estate and Mortgage Overview in Brian Head
| Characteristic | Without Mortgage | With Mortgage |
| Housing Units | 22 | 9 |
| Median Property Value | $316,700 | $0 |
| Median Household Income | - | - |
| Monthly Housing Costs | - | - |
| Real Estate Taxes | $1,000 | $0 |
Property Value by Mortgage Status in Brian Head
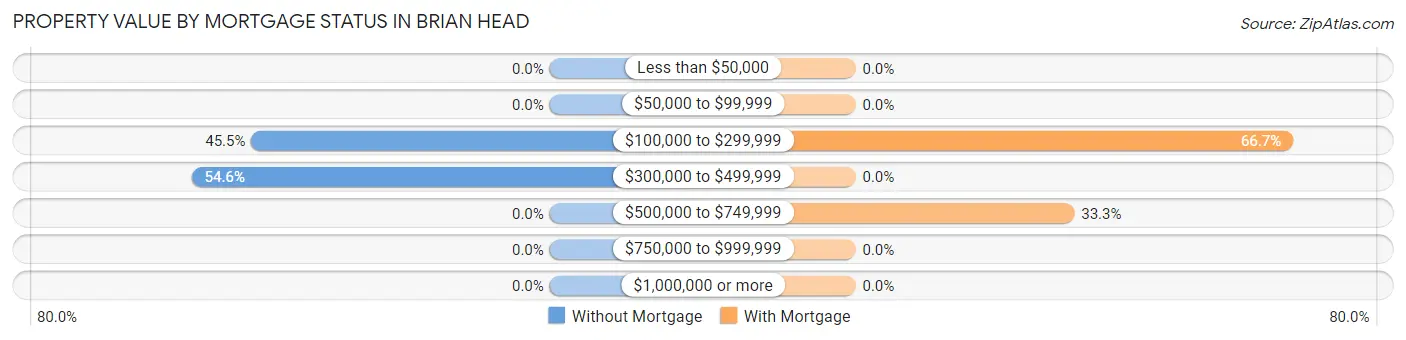
| Property Value | Without Mortgage | With Mortgage |
| Less than $50,000 | 0 (0.0%) | 0 (0.0%) |
| $50,000 to $99,999 | 0 (0.0%) | 0 (0.0%) |
| $100,000 to $299,999 | 10 (45.5%) | 6 (66.7%) |
| $300,000 to $499,999 | 12 (54.5%) | 0 (0.0%) |
| $500,000 to $749,999 | 0 (0.0%) | 3 (33.3%) |
| $750,000 to $999,999 | 0 (0.0%) | 0 (0.0%) |
| $1,000,000 or more | 0 (0.0%) | 0 (0.0%) |
| Total | 22 (100.0%) | 9 (100.0%) |
Household Income by Mortgage Status in Brian Head
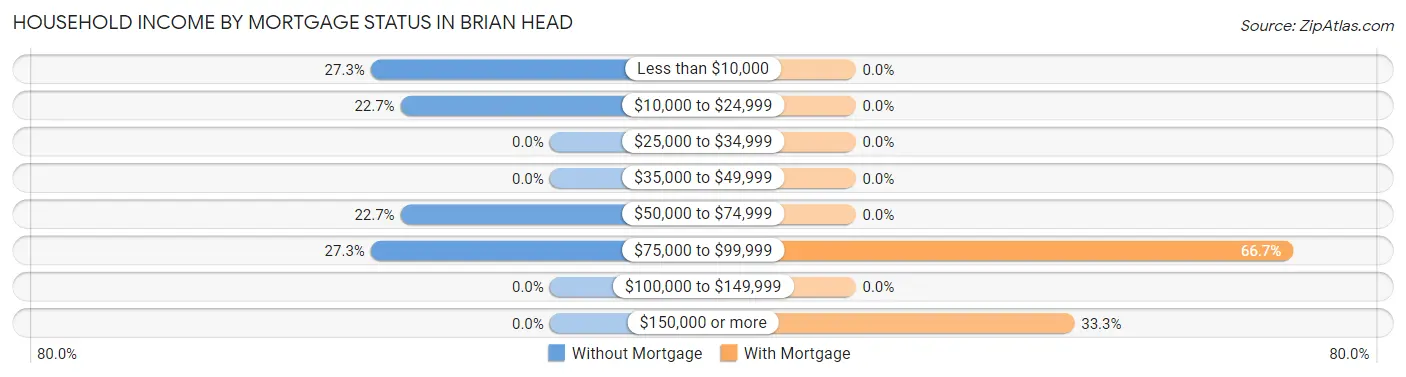
| Household Income | Without Mortgage | With Mortgage |
| Less than $10,000 | 6 (27.3%) | 0 (0.0%) |
| $10,000 to $24,999 | 5 (22.7%) | 0 (0.0%) |
| $25,000 to $34,999 | 0 (0.0%) | 0 (0.0%) |
| $35,000 to $49,999 | 0 (0.0%) | 0 (0.0%) |
| $50,000 to $74,999 | 5 (22.7%) | 0 (0.0%) |
| $75,000 to $99,999 | 6 (27.3%) | 6 (66.7%) |
| $100,000 to $149,999 | 0 (0.0%) | 0 (0.0%) |
| $150,000 or more | 0 (0.0%) | 3 (33.3%) |
| Total | 22 (100.0%) | 9 (100.0%) |
Property Value to Household Income Ratio in Brian Head
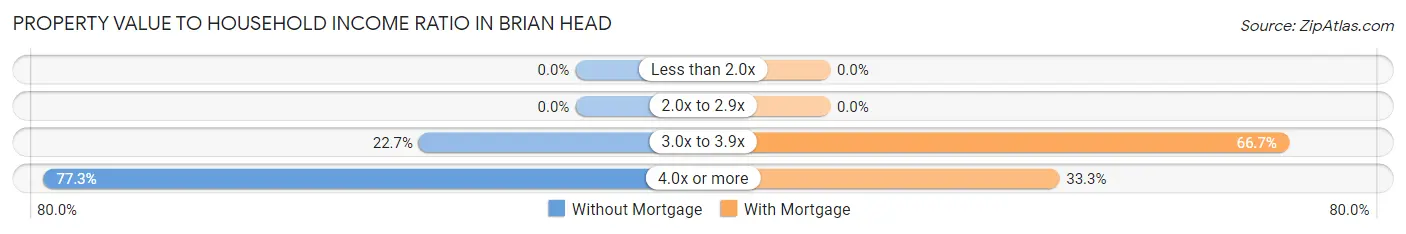
| Value-to-Income Ratio | Without Mortgage | With Mortgage |
| Less than 2.0x | 0 (0.0%) | 0 (0.0%) |
| 2.0x to 2.9x | 0 (0.0%) | 0 (0.0%) |
| 3.0x to 3.9x | 5 (22.7%) | 6 (66.7%) |
| 4.0x or more | 17 (77.3%) | 3 (33.3%) |
| Total | 22 (100.0%) | 9 (100.0%) |
Real Estate Taxes by Mortgage Status in Brian Head
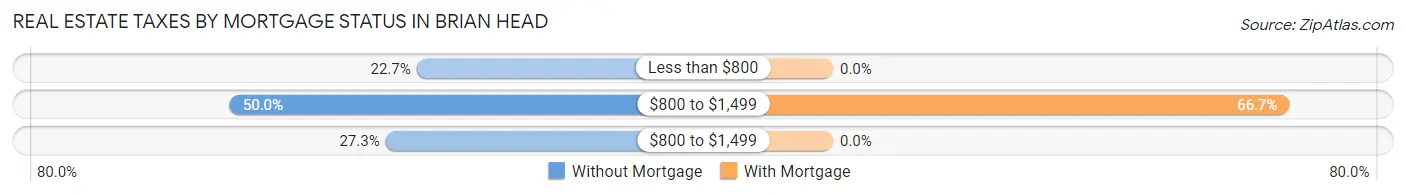
| Property Taxes | Without Mortgage | With Mortgage |
| Less than $800 | 5 (22.7%) | 0 (0.0%) |
| $800 to $1,499 | 11 (50.0%) | 6 (66.7%) |
| $800 to $1,499 | 6 (27.3%) | 0 (0.0%) |
| Total | 22 (100.0%) | 9 (100.0%) |
Health & Disability in Brian Head
Health Insurance Coverage by Age in Brian Head
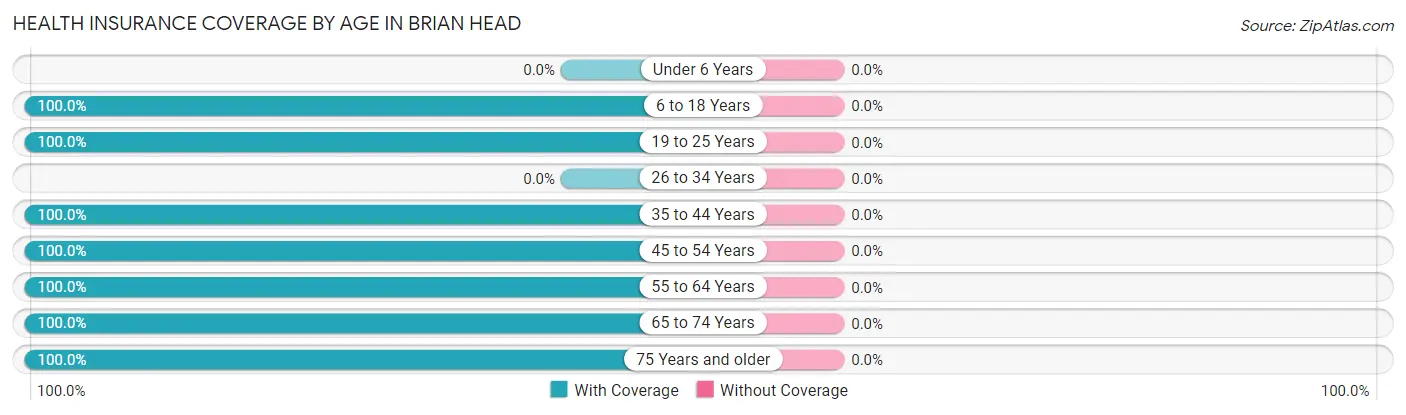
| Age Bracket | With Coverage | Without Coverage |
| Under 6 Years | 0 (0.0%) | 0 (0.0%) |
| 6 to 18 Years | 11 (100.0%) | 0 (0.0%) |
| 19 to 25 Years | 11 (100.0%) | 0 (0.0%) |
| 26 to 34 Years | 0 (0.0%) | 0 (0.0%) |
| 35 to 44 Years | 6 (100.0%) | 0 (0.0%) |
| 45 to 54 Years | 5 (100.0%) | 0 (0.0%) |
| 55 to 64 Years | 11 (100.0%) | 0 (0.0%) |
| 65 to 74 Years | 11 (100.0%) | 0 (0.0%) |
| 75 Years and older | 5 (100.0%) | 0 (0.0%) |
| Total | 60 (100.0%) | 0 (0.0%) |
Health Insurance Coverage by Citizenship Status in Brian Head
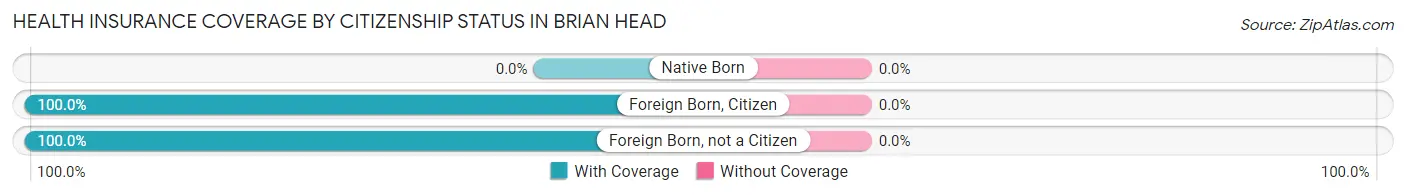
| Citizenship Status | With Coverage | Without Coverage |
| Native Born | 0 (0.0%) | 0 (0.0%) |
| Foreign Born, Citizen | 11 (100.0%) | 0 (0.0%) |
| Foreign Born, not a Citizen | 11 (100.0%) | 0 (0.0%) |
Health Insurance Coverage by Household Income in Brian Head
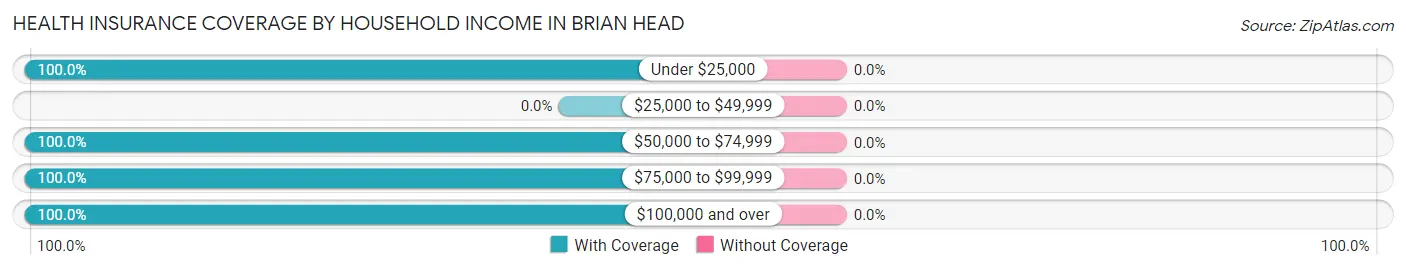
| Household Income | With Coverage | Without Coverage |
| Under $25,000 | 11 (100.0%) | 0 (0.0%) |
| $25,000 to $49,999 | 0 (0.0%) | 0 (0.0%) |
| $50,000 to $74,999 | 16 (100.0%) | 0 (0.0%) |
| $75,000 to $99,999 | 16 (100.0%) | 0 (0.0%) |
| $100,000 and over | 17 (100.0%) | 0 (0.0%) |
Public vs Private Health Insurance Coverage by Age in Brian Head
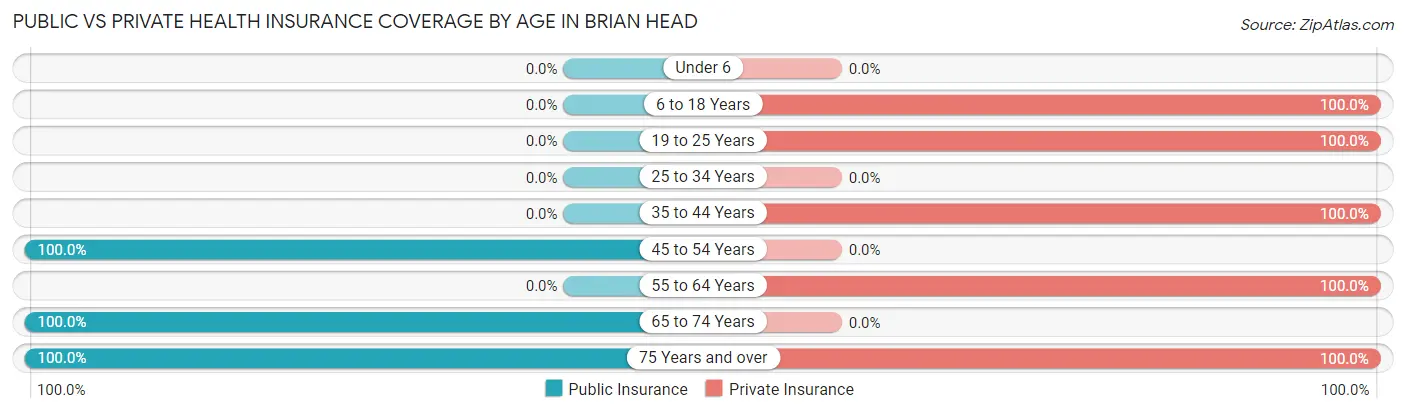
| Age Bracket | Public Insurance | Private Insurance |
| Under 6 | 0 (0.0%) | 0 (0.0%) |
| 6 to 18 Years | 0 (0.0%) | 11 (100.0%) |
| 19 to 25 Years | 0 (0.0%) | 11 (100.0%) |
| 25 to 34 Years | 0 (0.0%) | 0 (0.0%) |
| 35 to 44 Years | 0 (0.0%) | 6 (100.0%) |
| 45 to 54 Years | 5 (100.0%) | 0 (0.0%) |
| 55 to 64 Years | 0 (0.0%) | 11 (100.0%) |
| 65 to 74 Years | 11 (100.0%) | 0 (0.0%) |
| 75 Years and over | 5 (100.0%) | 5 (100.0%) |
| Total | 21 (35.0%) | 44 (73.3%) |
Disability Status by Sex by Age in Brian Head
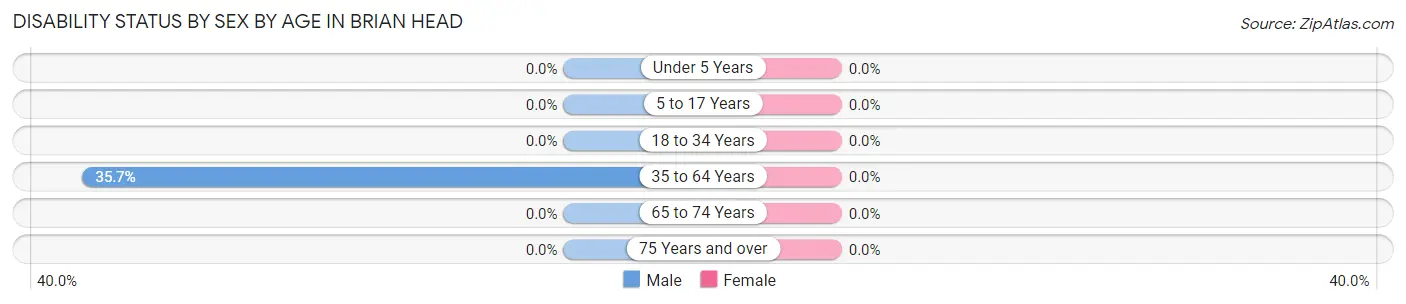
| Age Bracket | Male | Female |
| Under 5 Years | 0 (0.0%) | 0 (0.0%) |
| 5 to 17 Years | 0 (0.0%) | 0 (0.0%) |
| 18 to 34 Years | 0 (0.0%) | 0 (0.0%) |
| 35 to 64 Years | 5 (35.7%) | 0 (0.0%) |
| 65 to 74 Years | 0 (0.0%) | 0 (0.0%) |
| 75 Years and over | 0 (0.0%) | 0 (0.0%) |
Disability Class by Sex by Age in Brian Head
Disability Class: Hearing Difficulty
| Age Bracket | Male | Female |
| Under 5 Years | 0 (0.0%) | 0 (0.0%) |
| 5 to 17 Years | 0 (0.0%) | 0 (0.0%) |
| 18 to 34 Years | 0 (0.0%) | 0 (0.0%) |
| 35 to 64 Years | 0 (0.0%) | 0 (0.0%) |
| 65 to 74 Years | 0 (0.0%) | 0 (0.0%) |
| 75 Years and over | 0 (0.0%) | 0 (0.0%) |
Disability Class: Vision Difficulty
| Age Bracket | Male | Female |
| Under 5 Years | 0 (0.0%) | 0 (0.0%) |
| 5 to 17 Years | 0 (0.0%) | 0 (0.0%) |
| 18 to 34 Years | 0 (0.0%) | 0 (0.0%) |
| 35 to 64 Years | 0 (0.0%) | 0 (0.0%) |
| 65 to 74 Years | 0 (0.0%) | 0 (0.0%) |
| 75 Years and over | 0 (0.0%) | 0 (0.0%) |
Disability Class: Cognitive Difficulty
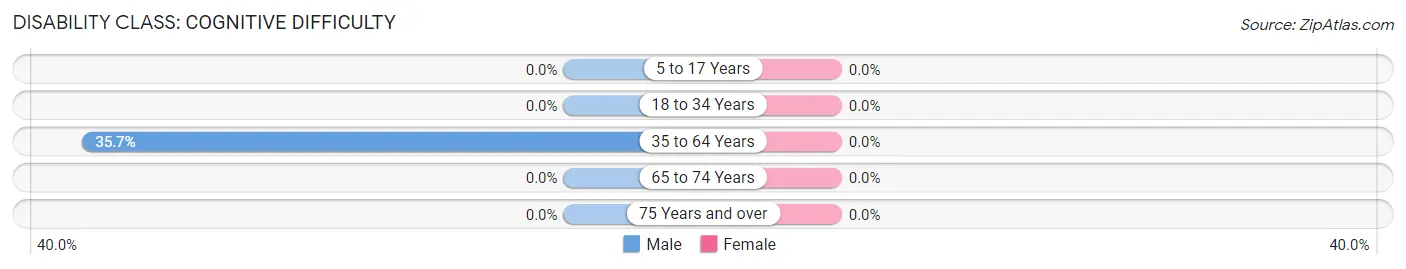
| Age Bracket | Male | Female |
| 5 to 17 Years | 0 (0.0%) | 0 (0.0%) |
| 18 to 34 Years | 0 (0.0%) | 0 (0.0%) |
| 35 to 64 Years | 5 (35.7%) | 0 (0.0%) |
| 65 to 74 Years | 0 (0.0%) | 0 (0.0%) |
| 75 Years and over | 0 (0.0%) | 0 (0.0%) |
Disability Class: Ambulatory Difficulty
| Age Bracket | Male | Female |
| 5 to 17 Years | 0 (0.0%) | 0 (0.0%) |
| 18 to 34 Years | 0 (0.0%) | 0 (0.0%) |
| 35 to 64 Years | 0 (0.0%) | 0 (0.0%) |
| 65 to 74 Years | 0 (0.0%) | 0 (0.0%) |
| 75 Years and over | 0 (0.0%) | 0 (0.0%) |
Disability Class: Self-Care Difficulty
| Age Bracket | Male | Female |
| 5 to 17 Years | 0 (0.0%) | 0 (0.0%) |
| 18 to 34 Years | 0 (0.0%) | 0 (0.0%) |
| 35 to 64 Years | 0 (0.0%) | 0 (0.0%) |
| 65 to 74 Years | 0 (0.0%) | 0 (0.0%) |
| 75 Years and over | 0 (0.0%) | 0 (0.0%) |
Technology Access in Brian Head
Computing Device Access in Brian Head
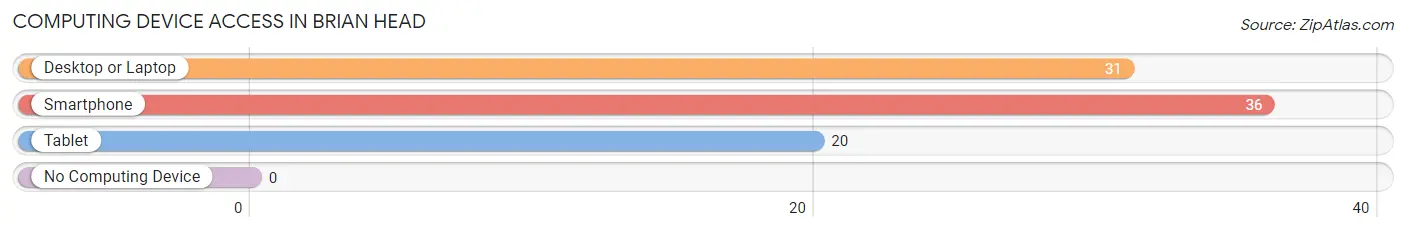
| Device Type | # Households | % Households |
| Desktop or Laptop | 31 | 86.1% |
| Smartphone | 36 | 100.0% |
| Tablet | 20 | 55.6% |
| No Computing Device | 0 | 0.0% |
| Total | 36 | 100.0% |
Internet Access in Brian Head
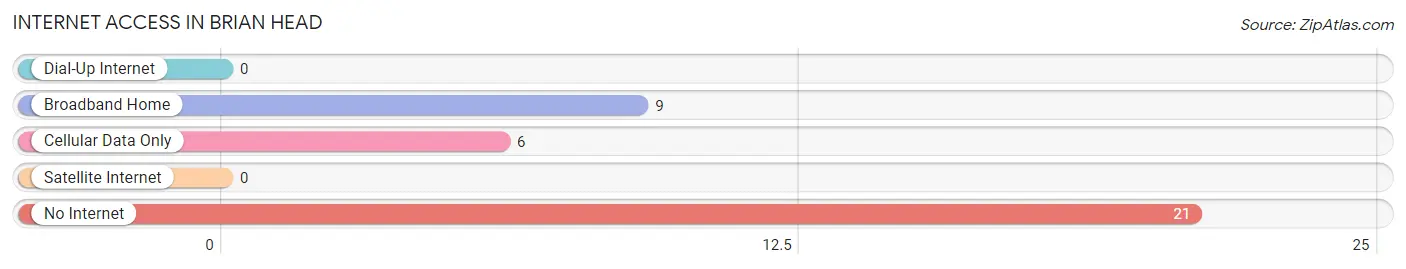
| Internet Type | # Households | % Households |
| Dial-Up Internet | 0 | 0.0% |
| Broadband Home | 9 | 25.0% |
| Cellular Data Only | 6 | 16.7% |
| Satellite Internet | 0 | 0.0% |
| No Internet | 21 | 58.3% |
| Total | 36 | 100.0% |
Brian Head Summary
Headquartered in the heart of the Grand Staircase-Escalante National Monument, Brian Head is a small mountain town located in Iron County, Utah. With a population of just over 200 people, Brian Head is a popular destination for outdoor recreation and skiing. The town is situated at an elevation of 9,800 feet and is surrounded by the majestic red rock formations of the Colorado Plateau.
Geography
Brian Head is located in the southwestern corner of Iron County, Utah, approximately 20 miles east of Cedar City. The town is situated at an elevation of 9,800 feet and is surrounded by the majestic red rock formations of the Colorado Plateau. The town is located in the Dixie National Forest and is home to the highest ski resort in Utah. The area is known for its stunning views of the surrounding mountains and valleys.
The town is located in a semi-arid climate, with hot summers and cold winters. The average annual temperature is around 40 degrees Fahrenheit, with temperatures ranging from the low 20s in the winter to the high 80s in the summer. The area receives an average of 18 inches of precipitation per year, with most of it falling in the form of snow.
History
The area that is now Brian Head was first settled by Mormon pioneers in the late 1800s. The town was originally known as “Little Denmark” due to the large number of Danish immigrants who settled in the area. In the early 1900s, the town was renamed “Brian Head” after a local rancher.
In the 1960s, the area began to develop as a ski resort. The first ski lift was installed in 1964 and the resort has grown steadily since then. Today, Brian Head is a popular destination for skiing, snowboarding, and other outdoor activities.
Economy
The economy of Brian Head is largely driven by tourism. The town is home to the highest ski resort in Utah and is a popular destination for outdoor recreation. The resort offers a variety of activities, including skiing, snowboarding, snowmobiling, and hiking. The town also has a number of restaurants, shops, and lodging options.
In addition to tourism, the town is also home to a number of small businesses, including a gas station, a grocery store, and a hardware store. The town also has a post office and a library.
Demographics
As of the 2010 census, the population of Brian Head was 203 people. The racial makeup of the town was 97.5% White, 0.5% Native American, 0.5% Asian, and 1.5% from two or more races. The median household income was $41,250 and the median age was 44.
Conclusion
Brian Head is a small mountain town located in Iron County, Utah. With a population of just over 200 people, the town is a popular destination for outdoor recreation and skiing. The town is situated at an elevation of 9,800 feet and is surrounded by the majestic red rock formations of the Colorado Plateau. The economy of Brian Head is largely driven by tourism, with the town home to the highest ski resort in Utah. The town also has a number of small businesses, including a gas station, a grocery store, and a hardware store. As of the 2010 census, the population of Brian Head was 203 people.
Common Questions
What is the Total Population of Brian Head?
Total Population of Brian Head is 60.
What is the Total Male Population of Brian Head?
Total Male Population of Brian Head is 36.
What is the Total Female Population of Brian Head?
Total Female Population of Brian Head is 24.
What is the Ratio of Males per 100 Females in Brian Head?
There are 150.00 Males per 100 Females in Brian Head.
What is the Ratio of Females per 100 Males in Brian Head?
There are 66.67 Females per 100 Males in Brian Head.
What is the Median Population Age in Brian Head?
Median Population Age in Brian Head is 51.4 Years.
What is the Average Family Size in Brian Head
Average Family Size in Brian Head is 2.6 People.
What is the Average Household Size in Brian Head
Average Household Size in Brian Head is 1.7 People.
What is Per Capita Income in Brian Head?
Per Capita income in Brian Head is $36,067.
What is the Median Family Income in Brian Head?
Median Family Income in Brian Head is $80,625.
What is the Median Household income in Brian Head?
Median Household Income in Brian Head is $63,000.
What is Inequality or Gini Index in Brian Head?
Inequality or Gini Index in Brian Head is 0.36.
How Large is the Labor Force in Brian Head?
There are 25 People in the Labor Forcein in Brian Head.
What is the Percentage of People in the Labor Force in Brian Head?
48.1% of People are in the Labor Force in Brian Head.