Zip Codes with the Highest Percentage of Population Employed in Transportation & Warehousing in Texas
RELATED REPORTS & OPTIONS
Transportation & Warehousing
Texas
Compare Zip Codes
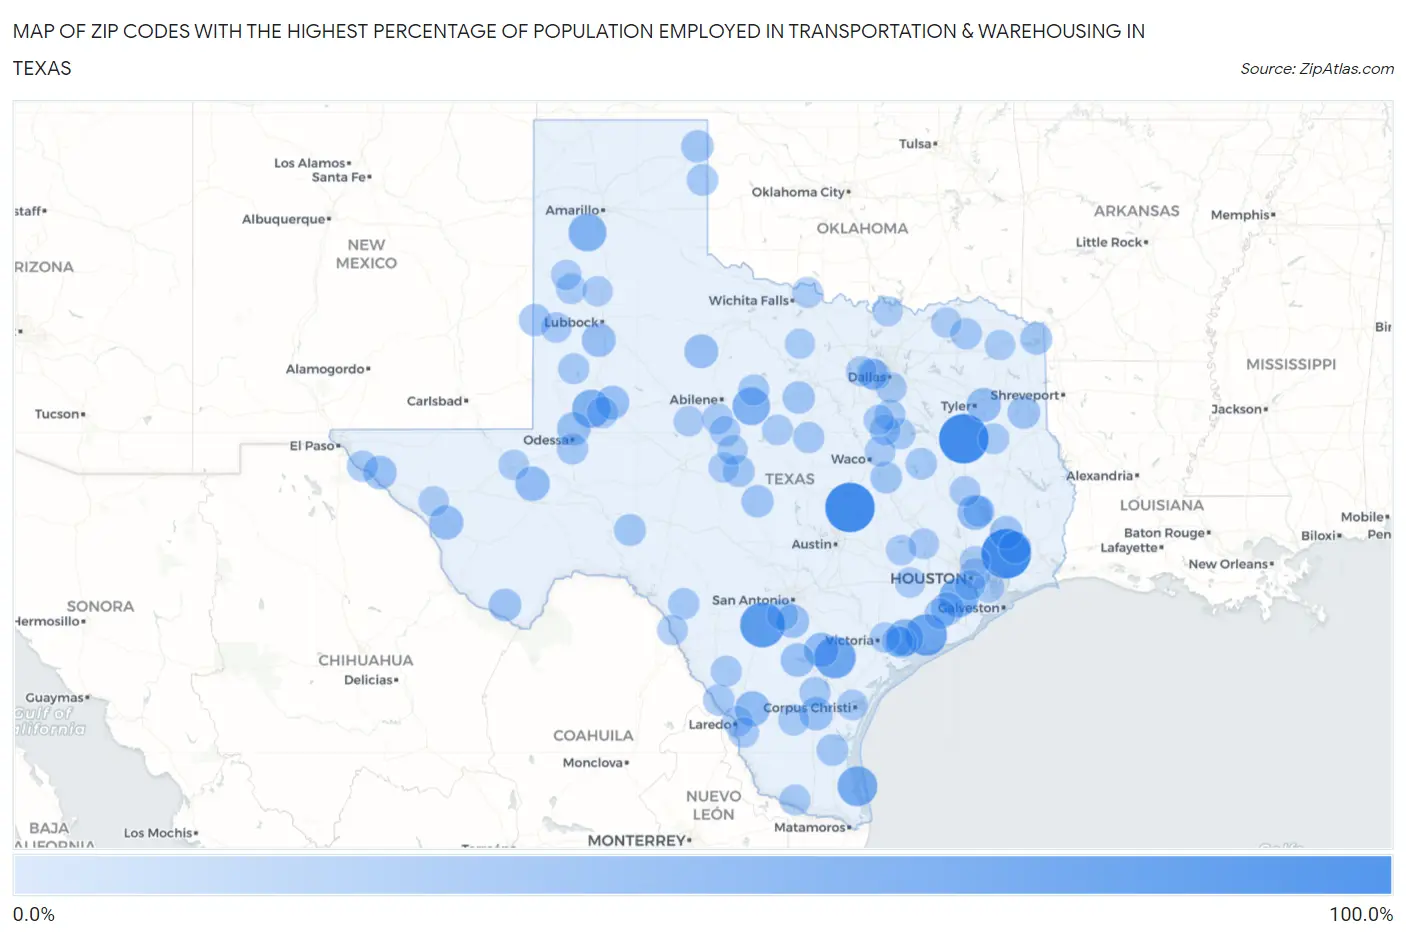
Map of Zip Codes with the Highest Percentage of Population Employed in Transportation & Warehousing in Texas
0.0%
100.0%
Zip Codes with the Highest Percentage of Population Employed in Transportation & Warehousing in Texas
| Zip Code | % Employed | vs State | vs National | |
| 1. | 77561 | 100.0% | 5.5%(+94.5)#1 | 4.9%(+95.1)#11 |
| 2. | 76573 | 100.0% | 5.5%(+94.5)#2 | 4.9%(+95.1)#18 |
| 3. | 75779 | 100.0% | 5.5%(+94.5)#3 | 4.9%(+95.1)#21 |
| 4. | 78057 | 78.0% | 5.5%(+72.5)#4 | 4.9%(+73.1)#30 |
| 5. | 77440 | 63.5% | 5.5%(+58.0)#5 | 4.9%(+58.5)#41 |
| 6. | 78104 | 63.4% | 5.5%(+57.9)#6 | 4.9%(+58.5)#42 |
| 7. | 78598 | 55.6% | 5.5%(+50.1)#7 | 4.9%(+50.6)#61 |
| 8. | 77481 | 53.3% | 5.5%(+47.8)#8 | 4.9%(+48.4)#66 |
| 9. | 79783 | 47.7% | 5.5%(+42.2)#9 | 4.9%(+42.7)#92 |
| 10. | 79091 | 46.9% | 5.5%(+41.4)#10 | 4.9%(+41.9)#96 |
| 11. | 76469 | 45.5% | 5.5%(+40.0)#11 | 4.9%(+40.5)#100 |
| 12. | 77971 | 41.3% | 5.5%(+35.8)#12 | 4.9%(+36.4)#122 |
| 13. | 78044 | 34.2% | 5.5%(+28.7)#13 | 4.9%(+29.2)#173 |
| 14. | 77359 | 33.9% | 5.5%(+28.4)#14 | 4.9%(+29.0)#177 |
| 15. | 78145 | 32.0% | 5.5%(+26.5)#15 | 4.9%(+27.1)#202 |
| 16. | 79730 | 31.8% | 5.5%(+26.3)#16 | 4.9%(+26.9)#204 |
| 17. | 79854 | 30.0% | 5.5%(+24.5)#17 | 4.9%(+25.1)#225 |
| 18. | 75705 | 29.8% | 5.5%(+24.3)#18 | 4.9%(+24.8)#233 |
| 19. | 79383 | 28.9% | 5.5%(+23.4)#19 | 4.9%(+23.9)#250 |
| 20. | 79540 | 28.6% | 5.5%(+23.1)#20 | 4.9%(+23.6)#259 |
| 21. | 78007 | 27.7% | 5.5%(+22.2)#21 | 4.9%(+22.7)#277 |
| 22. | 79748 | 27.2% | 5.5%(+21.7)#22 | 4.9%(+22.3)#287 |
| 23. | 79839 | 26.8% | 5.5%(+21.3)#23 | 4.9%(+21.8)#294 |
| 24. | 79758 | 26.7% | 5.5%(+21.2)#24 | 4.9%(+21.7)#295 |
| 25. | 78050 | 26.6% | 5.5%(+21.1)#25 | 4.9%(+21.7)#296 |
| 26. | 78342 | 26.0% | 5.5%(+20.5)#26 | 4.9%(+21.0)#311 |
| 27. | 77444 | 25.1% | 5.5%(+19.6)#27 | 4.9%(+20.2)#330 |
| 28. | 77369 | 24.1% | 5.5%(+18.6)#28 | 4.9%(+19.1)#364 |
| 29. | 75631 | 23.5% | 5.5%(+18.0)#29 | 4.9%(+18.5)#380 |
| 30. | 79852 | 23.3% | 5.5%(+17.8)#30 | 4.9%(+18.4)#385 |
| 31. | 76463 | 22.4% | 5.5%(+16.9)#31 | 4.9%(+17.4)#416 |
| 32. | 79046 | 22.3% | 5.5%(+16.8)#32 | 4.9%(+17.4)#417 |
| 33. | 77519 | 22.3% | 5.5%(+16.8)#33 | 4.9%(+17.3)#418 |
| 34. | 76842 | 21.7% | 5.5%(+16.2)#34 | 4.9%(+16.7)#450 |
| 35. | 79314 | 20.8% | 5.5%(+15.3)#35 | 4.9%(+15.9)#485 |
| 36. | 75573 | 19.7% | 5.5%(+14.2)#36 | 4.9%(+14.8)#556 |
| 37. | 78385 | 19.6% | 5.5%(+14.1)#37 | 4.9%(+14.6)#571 |
| 38. | 76661 | 19.5% | 5.5%(+14.0)#38 | 4.9%(+14.5)#572 |
| 39. | 76943 | 19.4% | 5.5%(+13.9)#39 | 4.9%(+14.5)#575 |
| 40. | 76852 | 19.2% | 5.5%(+13.7)#40 | 4.9%(+14.3)#580 |
| 41. | 79003 | 18.8% | 5.5%(+13.2)#41 | 4.9%(+13.8)#619 |
| 42. | 75838 | 18.6% | 5.5%(+13.1)#42 | 4.9%(+13.7)#629 |
| 43. | 79749 | 18.1% | 5.5%(+12.6)#43 | 4.9%(+13.2)#674 |
| 44. | 78045 | 17.9% | 5.5%(+12.4)#44 | 4.9%(+13.0)#689 |
| 45. | 78832 | 17.9% | 5.5%(+12.4)#45 | 4.9%(+12.9)#691 |
| 46. | 77364 | 17.9% | 5.5%(+12.4)#46 | 4.9%(+12.9)#692 |
| 47. | 77991 | 17.9% | 5.5%(+12.4)#47 | 4.9%(+12.9)#693 |
| 48. | 79766 | 17.8% | 5.5%(+12.3)#48 | 4.9%(+12.8)#703 |
| 49. | 75450 | 17.6% | 5.5%(+12.1)#49 | 4.9%(+12.6)#716 |
| 50. | 76436 | 17.5% | 5.5%(+12.0)#50 | 4.9%(+12.6)#719 |
| 51. | 78372 | 17.0% | 5.5%(+11.5)#51 | 4.9%(+12.0)#775 |
| 52. | 79853 | 16.8% | 5.5%(+11.3)#52 | 4.9%(+11.9)#794 |
| 53. | 78069 | 16.8% | 5.5%(+11.3)#53 | 4.9%(+11.9)#795 |
| 54. | 78341 | 16.7% | 5.5%(+11.2)#54 | 4.9%(+11.7)#813 |
| 55. | 76464 | 16.5% | 5.5%(+11.0)#55 | 4.9%(+11.6)#849 |
| 56. | 76679 | 16.2% | 5.5%(+10.7)#56 | 4.9%(+11.2)#882 |
| 57. | 79342 | 16.0% | 5.5%(+10.5)#57 | 4.9%(+11.1)#902 |
| 58. | 78576 | 16.0% | 5.5%(+10.5)#58 | 4.9%(+11.1)#903 |
| 59. | 78836 | 16.0% | 5.5%(+10.5)#59 | 4.9%(+11.1)#912 |
| 60. | 76623 | 15.8% | 5.5%(+10.3)#60 | 4.9%(+10.9)#932 |
| 61. | 75134 | 15.8% | 5.5%(+10.3)#61 | 4.9%(+10.9)#933 |
| 62. | 77420 | 15.8% | 5.5%(+10.3)#62 | 4.9%(+10.9)#936 |
| 63. | 75784 | 15.7% | 5.5%(+10.2)#63 | 4.9%(+10.8)#950 |
| 64. | 76155 | 15.5% | 5.5%(+10.0)#64 | 4.9%(+10.6)#971 |
| 65. | 76040 | 15.5% | 5.5%(+9.97)#65 | 4.9%(+10.5)#977 |
| 66. | 76377 | 15.4% | 5.5%(+9.88)#66 | 4.9%(+10.4)#990 |
| 67. | 77880 | 15.4% | 5.5%(+9.86)#67 | 4.9%(+10.4)#998 |
| 68. | 77028 | 15.2% | 5.5%(+9.68)#68 | 4.9%(+10.2)#1,024 |
| 69. | 79379 | 15.2% | 5.5%(+9.65)#69 | 4.9%(+10.2)#1,027 |
| 70. | 76624 | 15.1% | 5.5%(+9.64)#70 | 4.9%(+10.2)#1,031 |
| 71. | 78407 | 15.1% | 5.5%(+9.61)#71 | 4.9%(+10.2)#1,039 |
| 72. | 79541 | 15.0% | 5.5%(+9.48)#72 | 4.9%(+10.0)#1,069 |
| 73. | 77969 | 14.9% | 5.5%(+9.42)#73 | 4.9%(+9.98)#1,080 |
| 74. | 76650 | 14.9% | 5.5%(+9.39)#74 | 4.9%(+9.95)#1,090 |
| 75. | 77507 | 14.8% | 5.5%(+9.28)#75 | 4.9%(+9.83)#1,109 |
| 76. | 78877 | 14.6% | 5.5%(+9.09)#76 | 4.9%(+9.64)#1,145 |
| 77. | 79312 | 14.6% | 5.5%(+9.07)#77 | 4.9%(+9.62)#1,149 |
| 78. | 78041 | 14.4% | 5.5%(+8.91)#78 | 4.9%(+9.46)#1,180 |
| 79. | 78046 | 14.4% | 5.5%(+8.90)#79 | 4.9%(+9.45)#1,183 |
| 80. | 75851 | 14.1% | 5.5%(+8.64)#80 | 4.9%(+9.19)#1,254 |
| 81. | 76474 | 14.1% | 5.5%(+8.56)#81 | 4.9%(+9.12)#1,269 |
| 82. | 77835 | 14.0% | 5.5%(+8.55)#82 | 4.9%(+9.10)#1,275 |
| 83. | 77338 | 14.0% | 5.5%(+8.51)#83 | 4.9%(+9.07)#1,282 |
| 84. | 76862 | 14.0% | 5.5%(+8.45)#84 | 4.9%(+9.01)#1,294 |
| 85. | 79538 | 13.9% | 5.5%(+8.42)#85 | 4.9%(+8.98)#1,298 |
| 86. | 78935 | 13.8% | 5.5%(+8.32)#86 | 4.9%(+8.87)#1,318 |
| 87. | 79855 | 13.7% | 5.5%(+8.15)#87 | 4.9%(+8.71)#1,359 |
| 88. | 79719 | 13.6% | 5.5%(+8.10)#88 | 4.9%(+8.65)#1,375 |
| 89. | 79031 | 13.5% | 5.5%(+8.03)#89 | 4.9%(+8.59)#1,385 |
| 90. | 75470 | 13.5% | 5.5%(+7.96)#90 | 4.9%(+8.52)#1,399 |
| 91. | 76884 | 13.5% | 5.5%(+7.96)#91 | 4.9%(+8.52)#1,402 |
| 92. | 76137 | 13.4% | 5.5%(+7.94)#92 | 4.9%(+8.49)#1,409 |
| 93. | 75558 | 13.3% | 5.5%(+7.80)#93 | 4.9%(+8.35)#1,454 |
| 94. | 77988 | 13.3% | 5.5%(+7.79)#94 | 4.9%(+8.34)#1,456 |
| 95. | 77051 | 13.3% | 5.5%(+7.77)#95 | 4.9%(+8.32)#1,460 |
| 96. | 79506 | 13.3% | 5.5%(+7.76)#96 | 4.9%(+8.31)#1,462 |
| 97. | 76670 | 13.1% | 5.5%(+7.61)#97 | 4.9%(+8.17)#1,500 |
| 98. | 76459 | 13.0% | 5.5%(+7.54)#98 | 4.9%(+8.10)#1,524 |
| 99. | 79041 | 13.0% | 5.5%(+7.54)#99 | 4.9%(+8.09)#1,528 |
| 100. | 76264 | 12.9% | 5.5%(+7.42)#100 | 4.9%(+7.98)#1,553 |
Common Questions
What are the Top 10 Zip Codes with the Highest Percentage of Population Employed in Transportation & Warehousing in Texas?
Top 10 Zip Codes with the Highest Percentage of Population Employed in Transportation & Warehousing in Texas are:
What zip code has the Highest Percentage of Population Employed in Transportation & Warehousing in Texas?
77561 has the Highest Percentage of Population Employed in Transportation & Warehousing in Texas with 100.0%.
What is the Percentage of Population Employed in Transportation & Warehousing in the State of Texas?
Percentage of Population Employed in Transportation & Warehousing in Texas is 5.5%.
What is the Percentage of Population Employed in Transportation & Warehousing in the United States?
Percentage of Population Employed in Transportation & Warehousing in the United States is 4.9%.