Zip Codes with the Highest Percentage of Population Employed in Agriculture, Fishing & Hunting in Waxahachie, TX
RELATED REPORTS & OPTIONS
Agriculture, Fishing & Hunting
Waxahachie
Compare Zip Codes
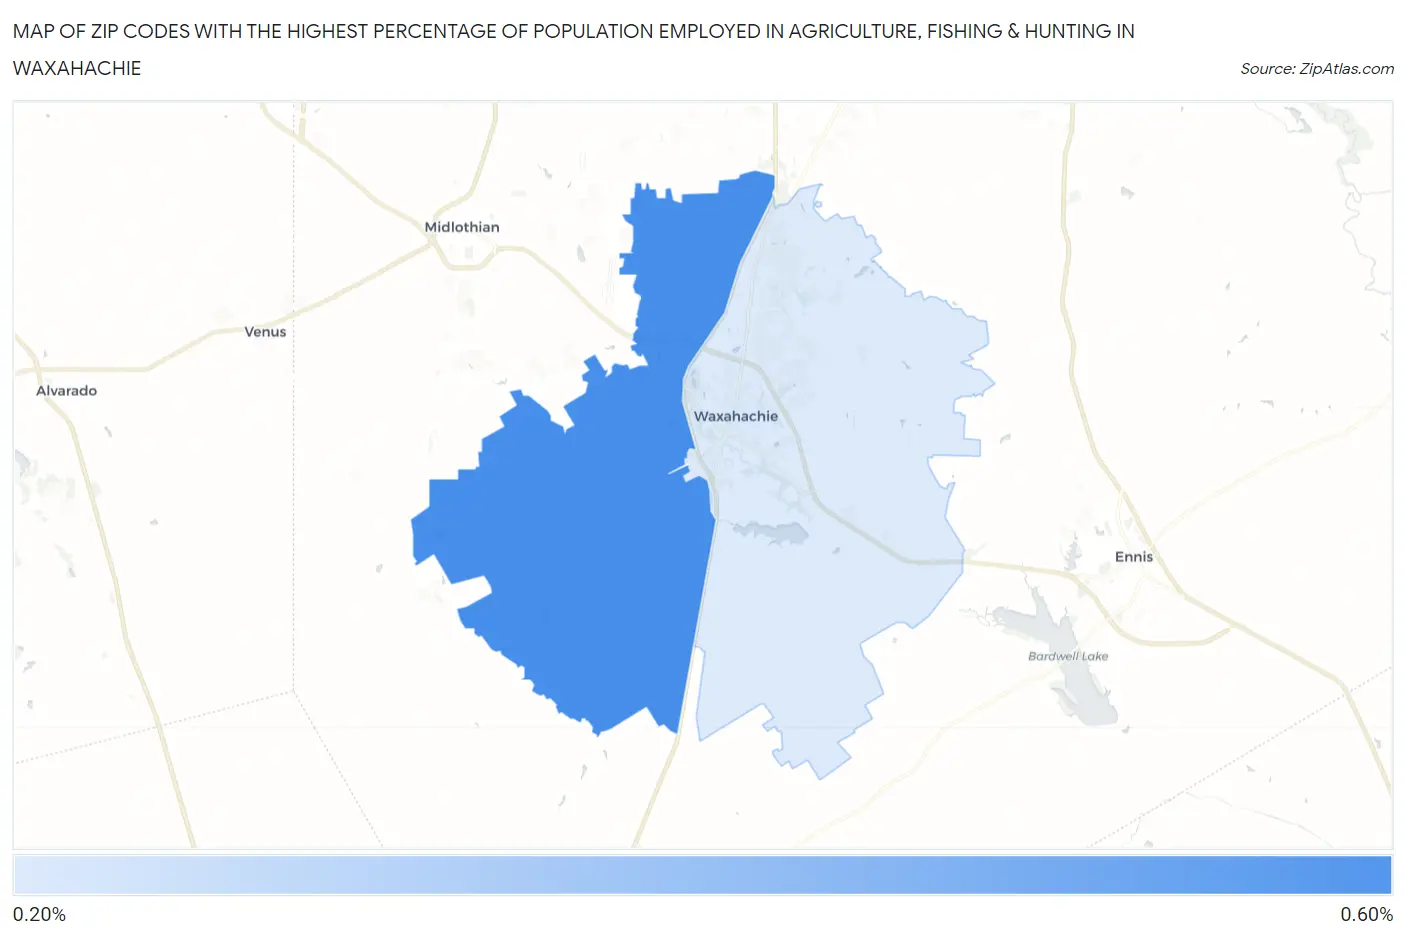
Map of Zip Codes with the Highest Percentage of Population Employed in Agriculture, Fishing & Hunting in Waxahachie
0.0%
0.60%
Zip Codes with the Highest Percentage of Population Employed in Agriculture, Fishing & Hunting in Waxahachie, TX
| Zip Code | % Employed | vs State | vs National | |
| 1. | 75167 | 0.54% | 0.75%(-0.215)#1,025 | 1.2%(-0.663)#18,965 |
| 2. | 75165 | 0.21% | 0.75%(-0.546)#1,238 | 1.2%(-0.994)#22,288 |
1
Common Questions
What are the Top Zip Codes with the Highest Percentage of Population Employed in Agriculture, Fishing & Hunting in Waxahachie, TX?
Top Zip Codes with the Highest Percentage of Population Employed in Agriculture, Fishing & Hunting in Waxahachie, TX are:
What zip code has the Highest Percentage of Population Employed in Agriculture, Fishing & Hunting in Waxahachie, TX?
75167 has the Highest Percentage of Population Employed in Agriculture, Fishing & Hunting in Waxahachie, TX with 0.54%.
What is the Percentage of Population Employed in Agriculture, Fishing & Hunting in Waxahachie, TX?
Percentage of Population Employed in Agriculture, Fishing & Hunting in Waxahachie is 0.089%.
What is the Percentage of Population Employed in Agriculture, Fishing & Hunting in Texas?
Percentage of Population Employed in Agriculture, Fishing & Hunting in Texas is 0.75%.
What is the Percentage of Population Employed in Agriculture, Fishing & Hunting in the United States?
Percentage of Population Employed in Agriculture, Fishing & Hunting in the United States is 1.2%.