Zip Codes with the Highest Percentage of White / Caucasian Population in Waco, TX

RELATED REPORTS & OPTIONS

White / Caucasian
Population
Families and Households
Female Fertility
Female Fertility (Unmarried)
Race (Community Size)
Race (Percentage)
Ancestry (Community Size)
AfricanAmericanApacheArabArgentineanArmenianAustralianAustrianBhutaneseBlackfeetBritishBurmeseCajunCanadianCelticCentral AmericanCentral American IndianCherokeeChickasawChileanChoctawColombianCreekCubanCzechCzechoslovakianDanishDutchDutch West IndianEastern EuropeanEcuadorianEgyptianEnglishEuropeanFilipinoFinnishFrenchFrench CanadianGermanGreekGuamanian / ChamorroGuatemalanHonduranHungarianIndian (Asian)IranianIrishItalianJamaicanJapaneseKoreanLaotianLebaneseLithuanianMalaysianMexicanMexican American IndianNative HawaiianNavajoNicaraguanNigerianNorthern EuropeanNorwegianPalestinianPanamanianPennsylvania GermanPeruvianPolishPortuguesePuebloPuerto RicanRomanianRussianSalvadoranScandinavianScotch-IrishScottishSiouxSlovakSouth AmericanSpaniardSpanishSri LankanSubsaharan AfricanSwedishSwissThaiTurkishUkrainianVenezuelanWelshWest IndianYugoslavian
Ancestry (Percentage)
AfricanAmericanApacheArabArgentineanArmenianAustralianAustrianBhutaneseBlackfeetBritishBurmeseCajunCanadianCelticCentral AmericanCentral American IndianCherokeeChickasawChileanChoctawColombianCreekCubanCzechCzechoslovakianDanishDutchDutch West IndianEastern EuropeanEcuadorianEgyptianEnglishEuropeanFilipinoFinnishFrenchFrench CanadianGermanGreekGuamanian / ChamorroGuatemalanHonduranHungarianIndian (Asian)IranianIrishItalianJamaicanJapaneseKoreanLaotianLebaneseLithuanianMalaysianMexicanMexican American IndianNative HawaiianNavajoNicaraguanNigerianNorthern EuropeanNorwegianPalestinianPanamanianPennsylvania GermanPeruvianPolishPortuguesePuebloPuerto RicanRomanianRussianSalvadoranScandinavianScotch-IrishScottishSiouxSlovakSouth AmericanSpaniardSpanishSri LankanSubsaharan AfricanSwedishSwissThaiTurkishUkrainianVenezuelanWelshWest IndianYugoslavian
Immigrant Origin (Total)
Immigrant Origin (Percentage)
Income
Income (Families)
Income (Households)
Poverty
Poverty (Families)
Unemployment
Employment Occupations
Employment Industries
Employer Class
Commute Time
Commute Means
School Enrollment
Education by Degree Field
Occupancy
Finances
Physical Characteristics
Waco
Compare Zip Codes
Comparison Subject

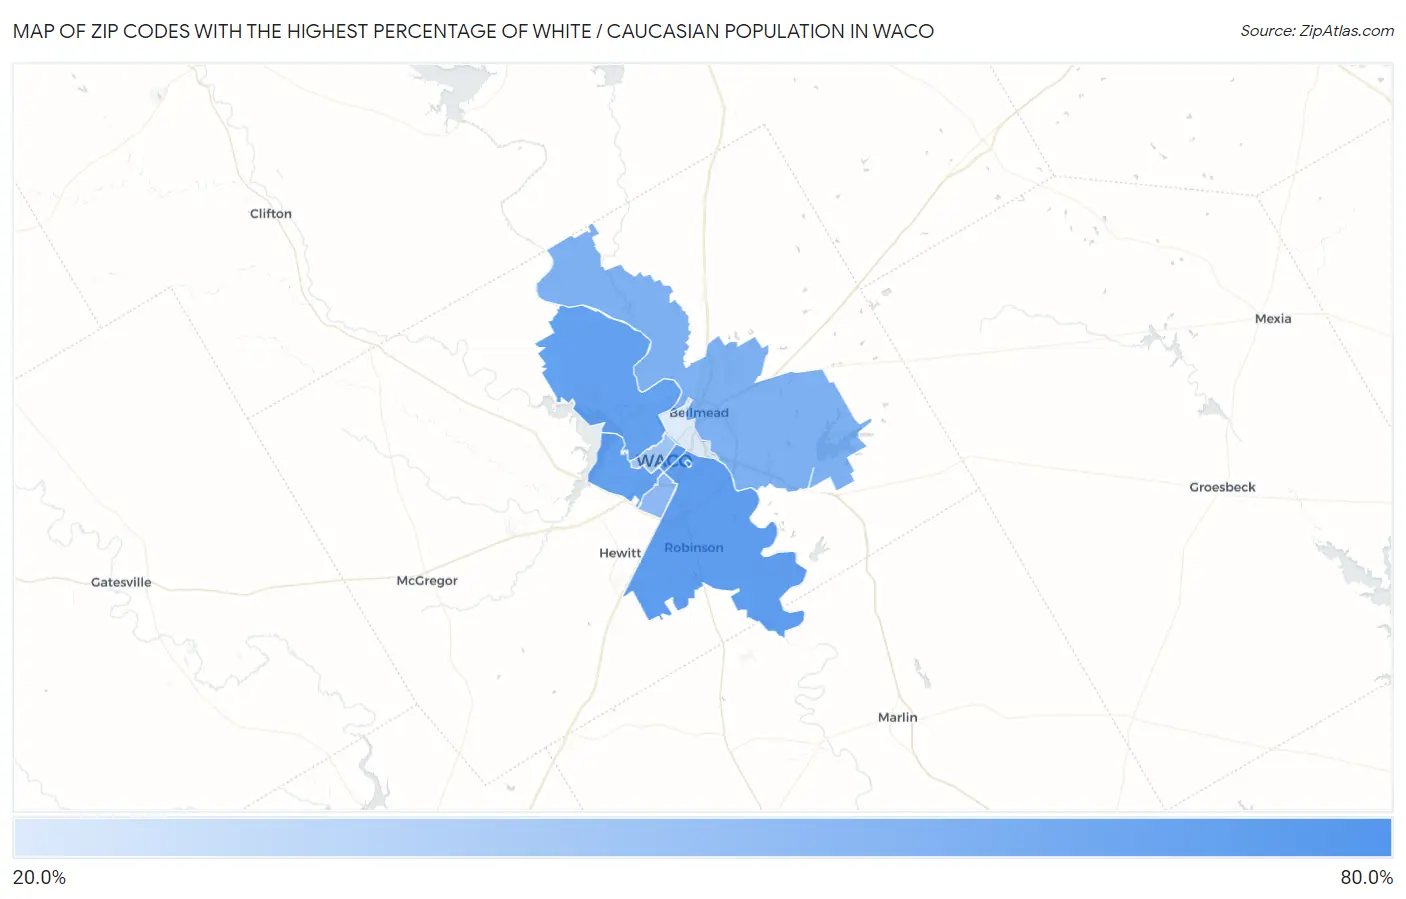
Map of Zip Codes with the Highest Percentage of White / Caucasian Population in Waco

0.0%
80.0%
Zip Codes with the Highest Percentage of White / Caucasian Population in Waco Map

Zip Codes with the Highest Percentage of White / Caucasian Population in Waco, TX

Zip Code White / Caucasian vs State vs National
1.7679877.1%59.1%(+18.0)#82065.9%(+11.2)#22,231
2.7670169.1%59.1%(+9.97)#1,10265.9%(+3.22)#24,962
3.7670667.1%59.1%(+7.92)#1,18965.9%(+1.18)#25,552
4.7671065.4%59.1%(+6.21)#1,23865.9%(-0.528)#26,028
5.7670865.1%59.1%(+5.99)#1,24465.9%(-0.756)#26,091
6.7670555.7%59.1%(-3.48)#1,50165.9%(-10.2)#28,187
7.7671149.1%59.1%(-10.1)#1,64265.9%(-16.8)#29,327
8.7670742.9%59.1%(-16.2)#1,73865.9%(-23.0)#30,201
9.7670422.2%59.1%(-36.9)#1,90065.9%(-43.6)#32,021

Common Questions

What are the Top 5 Zip Codes with the Highest Percentage of White / Caucasian Population in Waco, TX?
Top 5 Zip Codes with the Highest Percentage of White / Caucasian Population in Waco, TX are:
#1
77.1%
#2
69.1%
#3
67.1%
#4
65.4%
#5
65.1%
What zip code has the Highest Percentage of White / Caucasian Population in Waco, TX?
76798 has the Highest Percentage of White / Caucasian Population in Waco, TX with 77.1%.
What is the Percentage of White / Caucasian Population in Waco, TX?
Percentage of White / Caucasian Population in Waco is 59.9%.
What is the Percentage of White / Caucasian Population in Texas?
Percentage of White / Caucasian Population in Texas is 59.1%.
What is the Percentage of White / Caucasian Population in the United States?
Percentage of White / Caucasian Population in the United States is 65.9%.