Zip Codes with the Highest Percentage of Population Employed in Agriculture, Fishing & Hunting in Texas City, TX
RELATED REPORTS & OPTIONS
Agriculture, Fishing & Hunting
Texas City
Compare Zip Codes
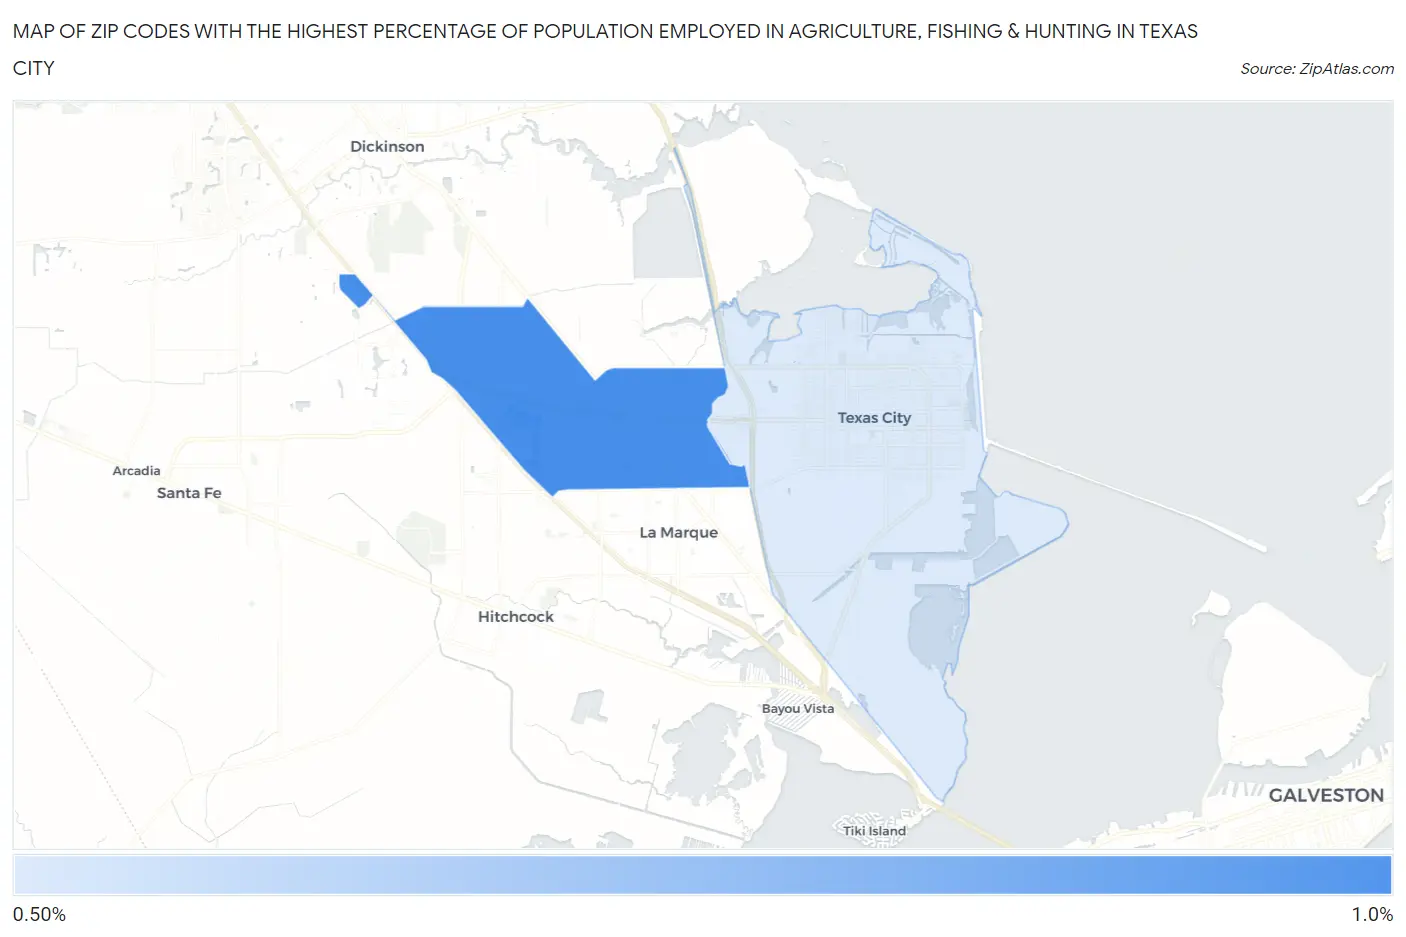
Map of Zip Codes with the Highest Percentage of Population Employed in Agriculture, Fishing & Hunting in Texas City
0.0%
1.0%
Zip Codes with the Highest Percentage of Population Employed in Agriculture, Fishing & Hunting in Texas City, TX
| Zip Code | % Employed | vs State | vs National | |
| 1. | 77591 | 0.90% | 0.75%(+0.150)#877 | 1.2%(-0.297)#16,696 |
| 2. | 77590 | 0.58% | 0.75%(-0.177)#1,005 | 1.2%(-0.624)#18,659 |
1
Common Questions
What are the Top Zip Codes with the Highest Percentage of Population Employed in Agriculture, Fishing & Hunting in Texas City, TX?
Top Zip Codes with the Highest Percentage of Population Employed in Agriculture, Fishing & Hunting in Texas City, TX are:
What zip code has the Highest Percentage of Population Employed in Agriculture, Fishing & Hunting in Texas City, TX?
77591 has the Highest Percentage of Population Employed in Agriculture, Fishing & Hunting in Texas City, TX with 0.90%.
What is the Percentage of Population Employed in Agriculture, Fishing & Hunting in Texas City, TX?
Percentage of Population Employed in Agriculture, Fishing & Hunting in Texas City is 0.64%.
What is the Percentage of Population Employed in Agriculture, Fishing & Hunting in Texas?
Percentage of Population Employed in Agriculture, Fishing & Hunting in Texas is 0.75%.
What is the Percentage of Population Employed in Agriculture, Fishing & Hunting in the United States?
Percentage of Population Employed in Agriculture, Fishing & Hunting in the United States is 1.2%.