Zip Codes with the Highest Percentage of Population Employed in Farming, Fishing & Forestry in Texas City, TX
RELATED REPORTS & OPTIONS
Farming, Fishing & Forestry
Texas City
Compare Zip Codes
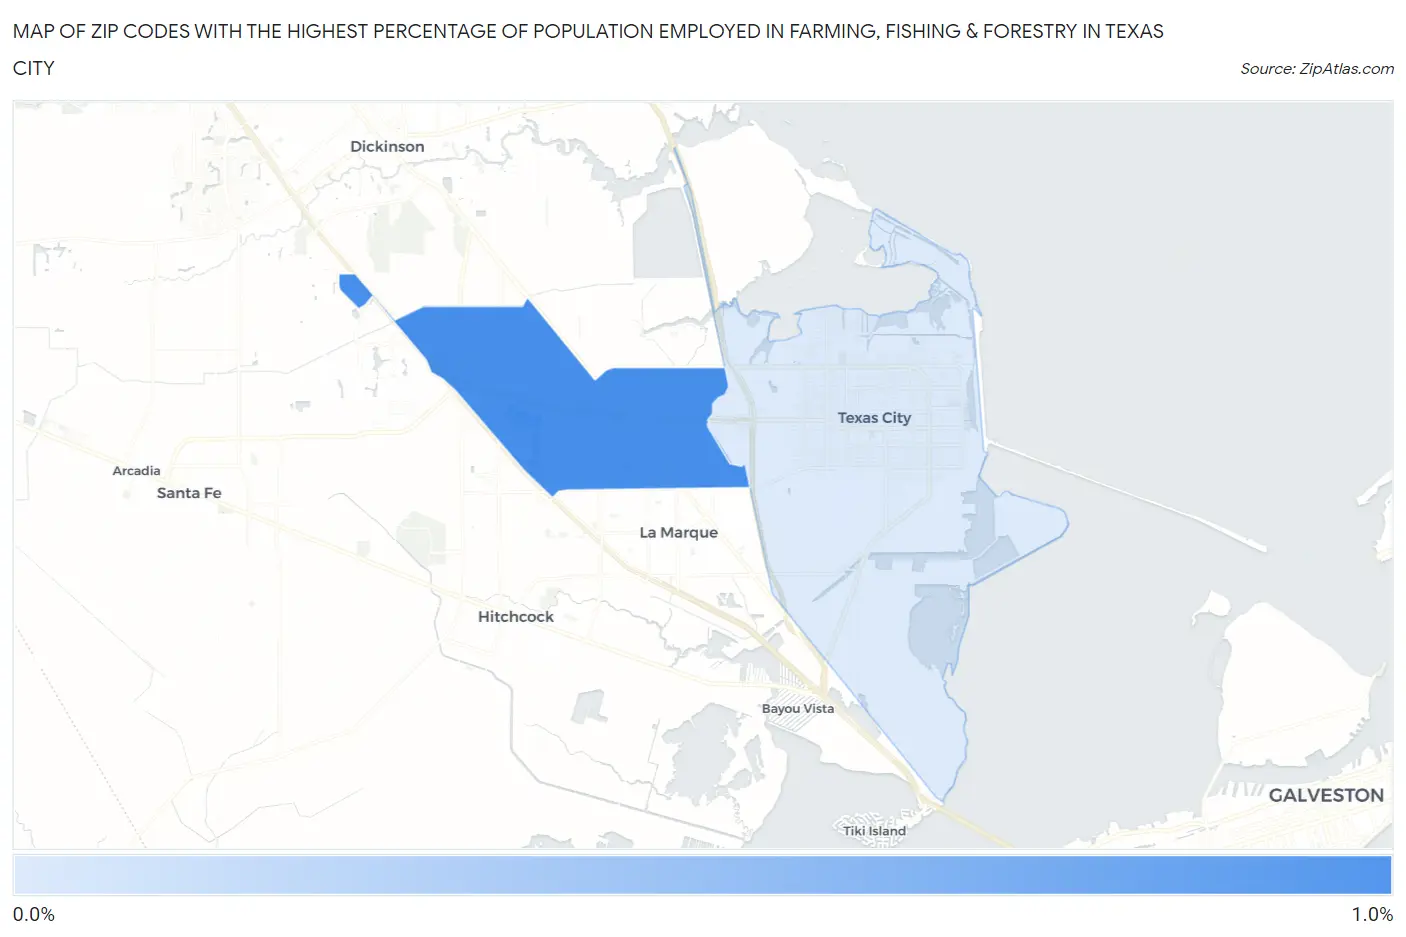
Map of Zip Codes with the Highest Percentage of Population Employed in Farming, Fishing & Forestry in Texas City
0.0%
1.0%
Zip Codes with the Highest Percentage of Population Employed in Farming, Fishing & Forestry in Texas City, TX
| Zip Code | % Employed | vs State | vs National | |
| 1. | 77591 | 0.90% | 0.37%(+0.530)#541 | 0.61%(+0.296)#10,221 |
| 2. | 77590 | 0.17% | 0.37%(-0.205)#919 | 0.61%(-0.438)#16,625 |
1
Common Questions
What are the Top Zip Codes with the Highest Percentage of Population Employed in Farming, Fishing & Forestry in Texas City, TX?
Top Zip Codes with the Highest Percentage of Population Employed in Farming, Fishing & Forestry in Texas City, TX are:
What zip code has the Highest Percentage of Population Employed in Farming, Fishing & Forestry in Texas City, TX?
77591 has the Highest Percentage of Population Employed in Farming, Fishing & Forestry in Texas City, TX with 0.90%.
What is the Percentage of Population Employed in Farming, Fishing & Forestry in Texas City, TX?
Percentage of Population Employed in Farming, Fishing & Forestry in Texas City is 0.38%.
What is the Percentage of Population Employed in Farming, Fishing & Forestry in Texas?
Percentage of Population Employed in Farming, Fishing & Forestry in Texas is 0.37%.
What is the Percentage of Population Employed in Farming, Fishing & Forestry in the United States?
Percentage of Population Employed in Farming, Fishing & Forestry in the United States is 0.61%.