Zip Codes with the Highest Percentage of Population Employed in Health Care & Social Assistance in Sugar Land, TX

RELATED REPORTS & OPTIONS

Health Care & Social Assistance
Population
Families and Households
Female Fertility
Female Fertility (Unmarried)
Race (Community Size)
Race (Percentage)
Ancestry (Community Size)
AfricanAmericanArabArgentineanArmenianAustrianBelgianBhutaneseBlackfeetBolivianBrazilianBritishBritish West IndianBulgarianBurmeseCajunCanadianCentral AmericanCentral American IndianCherokeeChoctawColombianComancheCroatianCubanCzechCzechoslovakianDanishDutchEastern EuropeanEcuadorianEgyptianEnglishEthiopianEuropeanFilipinoFinnishFrenchFrench CanadianGermanGreekGuamanian / ChamorroGuatemalanHonduranHungarianIndian (Asian)IranianIrishItalianJamaicanJapaneseJordanianKoreanLaotianLebaneseLithuanianMexicanMongolianMoroccanNative HawaiianNavajoNicaraguanNigerianNorthern EuropeanNorwegianOkinawanOsagePakistaniPalestinianPanamanianPeruvianPolishPortuguesePuerto RicanRomanianRussianSalvadoranScandinavianScotch-IrishScottishSerbianSlovakSouth AmericanSouth American IndianSpaniardSpanishSri LankanSubsaharan AfricanSudaneseSwedishSwissSyrianThaiTurkishUkrainianVenezuelanVietnameseWelshWest Indian
Ancestry (Percentage)
AfricanAmericanArabArgentineanArmenianAustrianBelgianBhutaneseBlackfeetBolivianBrazilianBritishBritish West IndianBulgarianBurmeseCajunCanadianCentral AmericanCentral American IndianCherokeeChoctawColombianComancheCroatianCubanCzechCzechoslovakianDanishDutchEastern EuropeanEcuadorianEgyptianEnglishEthiopianEuropeanFilipinoFinnishFrenchFrench CanadianGermanGreekGuamanian / ChamorroGuatemalanHonduranHungarianIndian (Asian)IranianIrishItalianJamaicanJapaneseJordanianKoreanLaotianLebaneseLithuanianMexicanMongolianMoroccanNative HawaiianNavajoNicaraguanNigerianNorthern EuropeanNorwegianOkinawanOsagePakistaniPalestinianPanamanianPeruvianPolishPortuguesePuerto RicanRomanianRussianSalvadoranScandinavianScotch-IrishScottishSerbianSlovakSouth AmericanSouth American IndianSpaniardSpanishSri LankanSubsaharan AfricanSudaneseSwedishSwissSyrianThaiTurkishUkrainianVenezuelanVietnameseWelshWest Indian
Immigrant Origin (Total)
Immigrant Origin (Percentage)
Income
Income (Families)
Income (Households)
Poverty
Poverty (Families)
Unemployment
Employment Occupations
Employment Industries
Employer Class
Commute Time
Commute Means
School Enrollment
Education by Degree Field
Occupancy
Finances
Physical Characteristics
Sugar Land
Compare Zip Codes
Comparison Subject

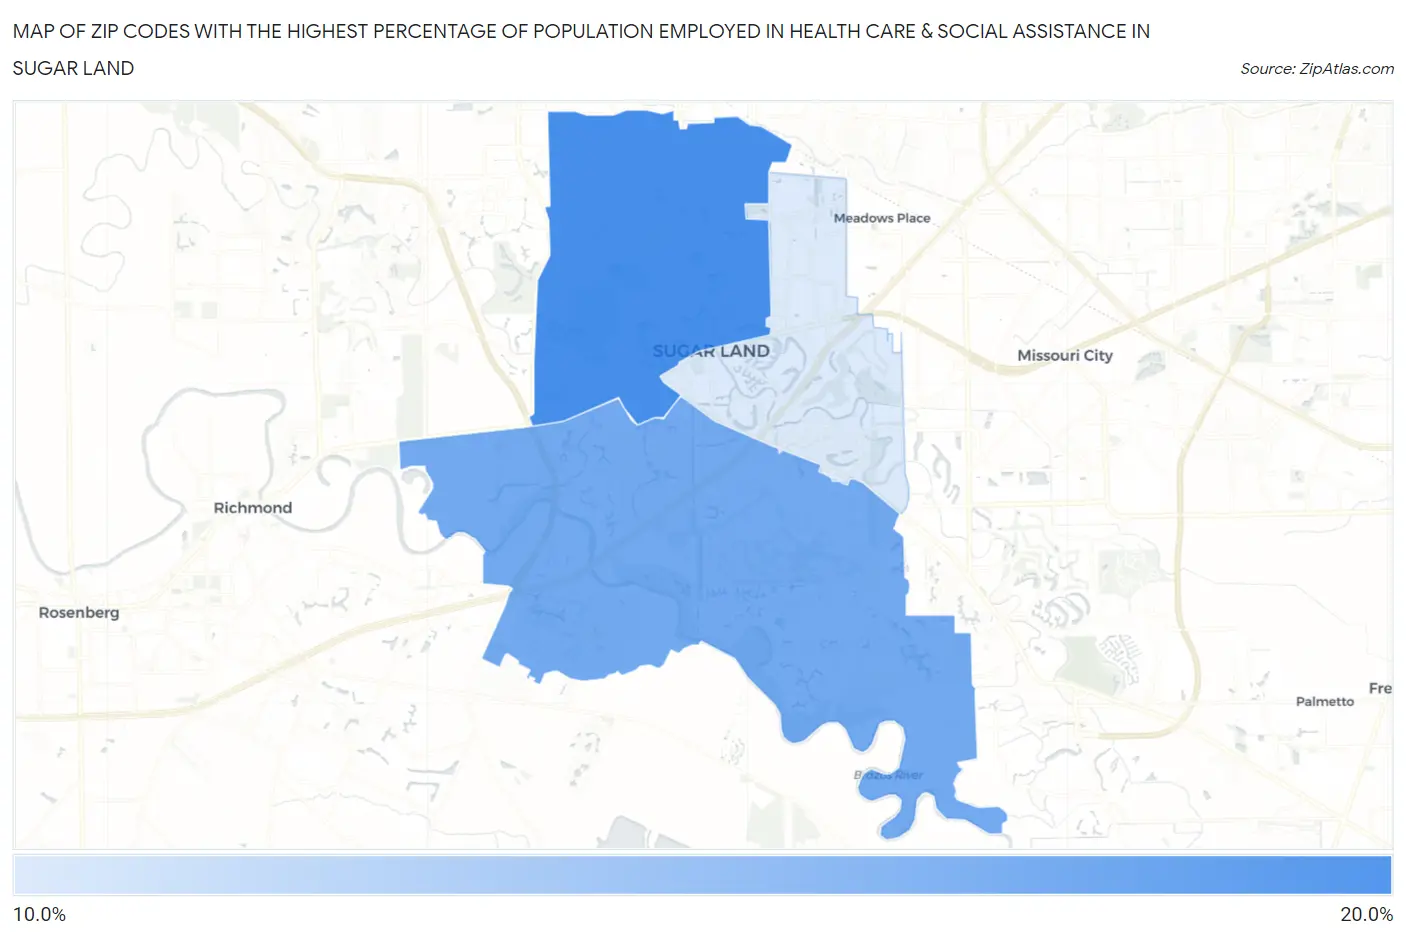
Map of Zip Codes with the Highest Percentage of Population Employed in Health Care & Social Assistance in Sugar Land

0.0%
20.0%
Zip Codes with the Highest Percentage of Population Employed in Health Care & Social Assistance in Sugar Land Map

Zip Codes with the Highest Percentage of Population Employed in Health Care & Social Assistance in Sugar Land, TX

Zip Code % Employed vs State vs National
1.7749816.8%11.9%(+4.85)#27913.9%(+2.84)#8,087
2.7747915.9%11.9%(+3.94)#34213.9%(+1.93)#9,775
3.7747813.7%11.9%(+1.81)#57813.9%(-0.204)#14,715

Common Questions

What are the Top Zip Codes with the Highest Percentage of Population Employed in Health Care & Social Assistance in Sugar Land, TX?
Top Zip Codes with the Highest Percentage of Population Employed in Health Care & Social Assistance in Sugar Land, TX are:
#1
16.8%
#2
15.9%
#3
13.7%
What zip code has the Highest Percentage of Population Employed in Health Care & Social Assistance in Sugar Land, TX?
77498 has the Highest Percentage of Population Employed in Health Care & Social Assistance in Sugar Land, TX with 16.8%.
What is the Percentage of Population Employed in Health Care & Social Assistance in Sugar Land, TX?
Percentage of Population Employed in Health Care & Social Assistance in Sugar Land is 14.1%.
What is the Percentage of Population Employed in Health Care & Social Assistance in Texas?
Percentage of Population Employed in Health Care & Social Assistance in Texas is 11.9%.
What is the Percentage of Population Employed in Health Care & Social Assistance in the United States?
Percentage of Population Employed in Health Care & Social Assistance in the United States is 13.9%.