Zip Codes with the Highest Percentage of Population Employed in Agriculture, Fishing & Hunting in Sherman, TX
RELATED REPORTS & OPTIONS
Agriculture, Fishing & Hunting
Sherman
Compare Zip Codes
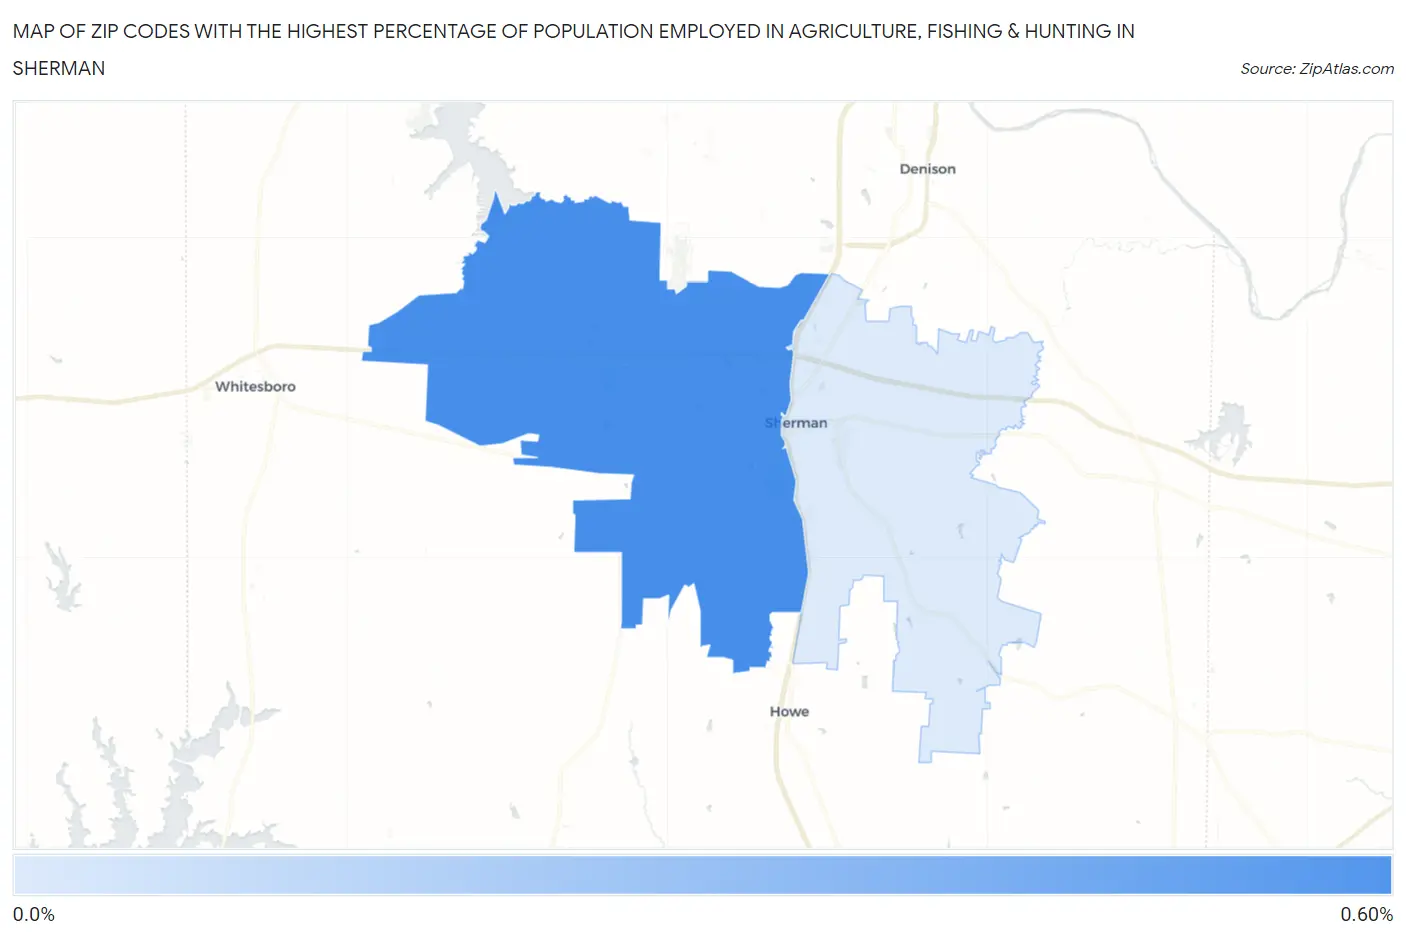
Map of Zip Codes with the Highest Percentage of Population Employed in Agriculture, Fishing & Hunting in Sherman
0.0%
0.60%
Zip Codes with the Highest Percentage of Population Employed in Agriculture, Fishing & Hunting in Sherman, TX
| Zip Code | % Employed | vs State | vs National | |
| 1. | 75092 | 0.52% | 0.75%(-0.231)#1,031 | 1.2%(-0.678)#19,095 |
| 2. | 75090 | 0.070% | 0.75%(-0.682)#1,401 | 1.2%(-1.13)#24,105 |
1
Common Questions
What are the Top Zip Codes with the Highest Percentage of Population Employed in Agriculture, Fishing & Hunting in Sherman, TX?
Top Zip Codes with the Highest Percentage of Population Employed in Agriculture, Fishing & Hunting in Sherman, TX are:
What zip code has the Highest Percentage of Population Employed in Agriculture, Fishing & Hunting in Sherman, TX?
75092 has the Highest Percentage of Population Employed in Agriculture, Fishing & Hunting in Sherman, TX with 0.52%.
What is the Percentage of Population Employed in Agriculture, Fishing & Hunting in Sherman, TX?
Percentage of Population Employed in Agriculture, Fishing & Hunting in Sherman is 0.13%.
What is the Percentage of Population Employed in Agriculture, Fishing & Hunting in Texas?
Percentage of Population Employed in Agriculture, Fishing & Hunting in Texas is 0.75%.
What is the Percentage of Population Employed in Agriculture, Fishing & Hunting in the United States?
Percentage of Population Employed in Agriculture, Fishing & Hunting in the United States is 1.2%.